www.atmos-chem-phys.net/15/8401/2015/ doi:10.5194/acp-15-8401-2015
© Author(s) 2015. CC Attribution 3.0 License.
Aerosol chemistry above an extended archipelago of the eastern
Mediterranean basin during strong northern winds
E. Athanasopoulou1,2, A. P. Protonotariou2, E. Bossioli2, A. Dandou2, M. Tombrou2, J. D. Allan1,3, H. Coe1, N. Mihalopoulos4,5, J. Kalogiros4, A. Bacak1, J. Sciare6,7, and G. Biskos7,8,9
1School of Earth, Atmosphere and Environmental Sciences, University of Manchester, Manchester, M13 9PL, UK 2Department of Applied Physics, National and Kapodistrian University of Athens, 15784 Athens, Greece
3National Centre for Atmospheric Science, University of Manchester, Manchester, M13 9PL, UK
4Institute for Environmental Research and Sustainable Development, National Observatory of Athens, 15236 Athens, Greece 5Chemistry department, University of Crete, 71003 Heraklion, Crete, Greece
6Laboratoire des Sciences du Climat et de l’Environnement, LSCE, UMR8212, CNRS-CEA-UVSQ,
91191 Gif-sur-Yvette, France
7Energy Environment and Water Research Center, The Cyprus Institute, Nicosia, Cyprus 8Department of Environment, University of Aegean, 81100 Mytilene, Greece
9Faculty of Civil Engineering and Geosciences, Delft University of Technology, Delft, the Netherlands
Correspondence to:E. Athanasopoulou ([email protected])
Received: 4 February 2015 – Published in Atmos. Chem. Phys. Discuss.: 27 March 2015 Revised: 25 May 2015 – Accepted: 29 June 2015 – Published: 28 July 2015
Abstract. Detailed aerosol chemical predictions by a com-prehensive model system (i.e. PMCAMx, WRF, GEOS-CHEM), along with airborne and ground-based observa-tions, are presented and analysed over a wide domain cov-ering the Aegean Archipelago. The studied period is 10 successive days in 2011, characterized by strong northern winds, which is the most frequently prevailing synoptic pat-tern during summer. The submicron aerosol load in the lower troposphere above the archipelago is homogenously enriched in sulfate (average modelled and measured submi-cron sulfate of 5.5 and 5.8 µg m−3, respectively), followed by organics (2.3 and 4.4 µg m−3) and ammonium (1.5 and 1.7 µg m−3). Aerosol concentrations smoothly decline aloft, reaching lower values (<1 µg m−3)above 4.2 km altitude. The evaluation criteria rate the model results for sulfate, am-monium, chloride, elemental carbon, organic carbon and to-tal PM10 mass concentrations as “good”, indicating a satis-factory representation of the aerosol chemistry and precur-sors. Higher model discrepancies are confined to the high-est (e.g. peak sulfate values) and lowhigh-est ends (e.g. nitrate) of the airborne aerosol mass size distribution, as well as in airborne organic aerosol concentrations (model underestima-tion ca. 50 %). The latter is most likely related to the
in-tense fire activity at the eastern Balkan area and the Black Sea coastline, which is not represented in the current model application. The investigation of the effect of local variables on model performance revealed that the best agreement be-tween predictions and observations occurs during high winds from the northeast, as well as for the area confined above the archipelago and up to 2.2 km altitude. The atmospheric age-ing of biogenic particles is suggested to be activated in the aerosol chemistry module, when treating organics in a suffi-cient nitrogen and sulfate-rich environment, such as that over the Aegean basin. More than 70 % of the predicted aerosol mass over the Aegean Archipelago during a representative Etesian episode is related to transport of aerosols and their precursors from outside the modelling domain.
1 Introduction
their subsequent climate forcing (Nabat et al., 2014), as well as relevant air quality and health issues (Rodríguez et al., 2002; Medina et al., 2004). During summertime, regional circulation phenomena and increased photochemistry favour the accumulation and secondary formation of atmospheric aerosols (Millán et al., 1997; Rodríguez et al., 2002; Pey et al., 2013). The atmosphere over the Aegean Archipelago (also referred to as the Aegean Sea), part of the eastern Mediterranean (EM), is frequently affected by strong north-ern winds during the warm period. These winds are often bound to the Etesian flow (Maheras, 1986; Kotroni et al., 2001; Tylris and Lelieveld, 2013; Anagnostopoulou et al., 2014), which is the most common synoptic situation over the Aegean Sea (AS) during summer, transporting dry and cool air masses downwind of southern Russia, Ukraine, cen-tral/eastern Europe, the Balkan states and Turkey (Vrekous-sis et al., 2005; Bryant et al., 2006; Sciare et al., 2008). The emissions from biomass burning and important urban and industrial centres situated in these regions, combined with the intense photochemical ageing of the arriving plumes and the decreased deposition of species in the marine environ-ment, make the atmosphere above the AS a favourable area for aerosol investigation, particularly during regional-range transport phenomena observed in summer.
Previous aerosol modelling studies covering the AS (Lazaridis et al., 2005; Fountoukis et al., 2011; Im et al., 2012) have shown the predominance of non sea-salt sulfate in the fine aerosol mode, in agreement with previous ground-based observations (Mihalopoulos et al., 1997; Bardouki et al., 2003; Kanakidou et al., 2011), unlike anywhere else in Europe. Together with the high degree of oxidation of the organic matter (Hildebrandt et al., 2010), these findings are both consistent with the atmospheric conditions stated above. In addition, the important role of natural aerosol sources (sea-salt production and long-range transported dust plumes) has been investigated, not only on the total PM10 mass levels (particulate matter with aerodynamic diameter<10 µm) and
on model performance, but also on the gas–aerosol interac-tions towards the modification of inorganic aerosol composi-tion (Kallos et al., 2007; Astitha and Kallos, 2008; Athana-sopoulou et al., 2008; Im, 2013). Another common output of model applications over this archipelago is the exoge-nous influence (short-, medium- and long-range transport) on aerosol chemical composition, PM10concentration levels
(European limit exceedances) and regional climate, in com-parison with the contribution of local sources (Lazaridis et al., 2005; Kallos et al., 2007; Im and Kanakidou, 2012).
The relation between meteorology and aerosol load over the EM is less understood, and it has only been until recently that people have started studying it using atmospheric mod-els. Im et al. (2012) and Megaritis et al. (2013) have stud-ied the influence of temperature increases of up to 5 K on the chemical composition of aerosol particles. Their results are contradictory for sulfate (negative and positive changes in mass concentrations, respectively), but they are in
agree-ment for nitrate (decrease in mass concentrations) and or-ganics (increase in mass concentrations). Inversely, the ef-fect of aerosols on regional climate has been investigated by Solomos et al. (2011) and Kallos et al. (2014), who showed that the properties of atmospheric particles can modify cloud structure and precipitation during a heavy rainfall event over the EM. Given the complexity of the aerosol mixture in the Mediterranean basin, further studies on the chemical charac-terization and size distribution of the aerosol mass will eluci-date the interactions between airborne particles, meteorology and climate in the region.
A satisfactory representation of aerosol chemical species by model applications is a challenging task. Predictions over the AS from the aforementioned studies have been evalu-ated against concurrent or past measurements (Chabas and Lefevre, 2000; Kouvarakis et al., 2001; Smolik et al., 2003; Eleftheriadis et al., 2006; Gerasopoulos et al., 2006, 2007; Sciare et al., 2003, 2008; Koulouri et al., 2008; Pikridas et al., 2010; Im et al., 2012). Comparisons showed a moderate to large underestimation of the simulated PM10(Lazaridis et al., 2005; Im and Kanakidou, 2012) or organic mass concentra-tion (Fountoukis et al., 2011), despite inorganic species being well represented (Astitha and Kallos, 2008; Athanasopoulou et al., 2008; Fountoukis et al., 2011). Improved model perfor-mance for precipitation is achieved when cloud condensation nuclei activation of aerosols is included (Kallos et al., 2014). Most of the above modelling studies focus on the surface representation of aerosols and are compared against ground-based observational data from the station of Finokalia in Crete (south AS). A few modelling studies that investi-gated the vertical profiles of dust and sea-salt aerosols found that particles over the EM did not elevate higher than 2 km (Astitha and Kallos, 2008; Solomos et al., 2011). The latter study, which was compared against airborne measurements conducted near the Israeli coast, showed a good correla-tion between modelled and airborne measurements of aerosol mass concentrations. An earlier airborne experiment over the Aegean Archipelago (not bound to a regional model appli-cation), showed that the atmosphere 3.5 km above sea level (a.s.l.) is almost completely depleted of particles during Ete-sians (Formenti et al., 2002). This study also confirmed that additional quantities of aged aerosols from fossil fuel com-bustion and forest fires are transported southward. Recently, four clustered airborne campaigns, performed during a 10-day period of strong northern winds (including Etesians), provided amongst others a unique data set, including mea-surements of the chemical composition of submicron parti-cles above the AS and western Turkey. The first results from these measurements are selectively presented in Bezantakos et al. (2013) and Tombrou et al. (2013, 2015).
set and supportive ground-based aerosol observations. In or-der to capture the airflows over the Aegean basin more ef-ficiently, a comprehensive coupling of gases and aerosols between the PMCAMx and GEOS-CHEM chemical trans-port models (CTM) is performed and applied here for the first time. Outputs from the PMCAMx model are compared against the complete set of experimental aerosol data, pro-viding the most extensive evaluation of aerosol simulation performances over a wide region of the Mediterranean basin. The large number of prediction–observation pairs enables the investigation of the parameters that significantly affect aerosol model performance. An inter-comparison among dif-ferent scenarios is performed with respect to the airborne observations, in order to improve predictions of the organic aerosol fraction in the marine environment. This combined use of CTMs and monitoring data, which is emphasized by the latest European air quality directive, is taking advantage of the capabilities of the applied model system. The current model applications presented here complement the newly existing aerosol data set regarding the origin and chemical ageing of the organic matter (primary, oxygenated, anthro-pogenic and biogenic), the chemical composition and parti-cle size distribution and the role of non-local sources of air pollution on the mass of each aerosol species under different paths of northern transport.
2 Experimental data 2.1 Airborne measurements
Airborne data from four EUFAR (http://www.eufar.net/) campaigns (i.e. AEGEAN-GAME, ACEMED, CarbonExp and CIMS) are utilized in this study. The measurements were conducted using the UK BAe-146-301 Atmospheric Research Aircraft, which was operated through the Facil-ity for Airborne Atmospheric Measurements (FAAM, http: //www.faam.ac.uk/). Nine flights were performed between 31 August and 09 September 2011 (cf. Fig. 1). In all flights, the aircraft took off from and landed at the airport of Cha-nia in northwest (NW) Crete. Five of the flights passed over the AS (on 1, 2, 4, and 7 September), one oriented towards Thessaloniki passing over Athens (8 September), while the aircraft flew over the western coast of Turkey up to the south-west (SW) coast of the Black Sea during the rest of the flights. With the exception of the last flight on 8 September, all flights were performed from 08:00 to 15:00 UTC. Flight paths in the Greek airspace were at altitudes up to 5 km a.s.l., while those over Turkey were above 2 and up to 7.6 km a.s.l. The airborne measurements during these campaigns pro-vided, among other atmospheric parameters, the chemi-cal composition of aerosols. High-time resolution measure-ments of the sulfate (SO2−
4 ), nitrate (NO−3), ammonium
(NH+
4), chloride (Cl−)and organic (OA) content of the
sub-micron particles (PM1)were performed by an airborne
com-pact time-of-flight aerosol mass spectrometer (cToF-AMS) (Canagaratna et al., 2007; Morgan et al., 2010). Aerosol mass concentrations are reported at ambient temperature and sure (i.e. a conversion from standard temperature and pres-sure to ambient conditions has been applied). In common with other AMS measurements, these measurements nomi-nally represent the submicron, non-refractory component of the aerosols, therefore do not include any sulfate, nitrate or chloride associated with sea salt or dust particles. The col-lection efficiency (CE) was estimated based on the param-eterization described by Middlebrook et al. (2012), which was close to unity based on the acidic nature of the parti-cles. Because no on-board validation of this chemical data was available (no other composition data were obtained and the possible presence of sea salt particles would confound a comparison with the particle sizing instruments), it is prudent to assign an uncertainty of ca. 30–35 % to the AMS measure-ments, as suggested by Bahreini et al. (2009).
Wind speed and direction, air temperature and water vapour mixing ratio were also available and used here for model evaluation (Sect. 4.1). More information on the flights, instrumentation and measured data during this period can be found in Bezantakos et al. (2013) and Tombrou et al. (2015).
2.2 Ground measurements
Ground-based measurements of the chemical composition and physical properties of the particles in the region were conducted at two remote stations located at Vigla (39◦58′N, 25◦04′E; 420 m a.s.l.) on the island of Lemnos and Fi-nokalia, (35◦20′N, 25◦40′E; 150 m a.s.l.) on the island of Crete, between 29 August and 09 September 2011. Both sites are far from major cities and local anthropogenic sources (Fig. 1a). To determine the aerosol chemical composition ob-served at Vigla and Finokalia, particles were collected every 1, 6 or 8 h using PM10and PM1samplers. The ground aerosol
data used in this study are the PM10 elemental (EC) and
organic carbon (OC) (6 h samples), the PM1 SO24− (hourly
samples) and the total PM10mass (8 h samples).
OC and EC concentrations on the collected samples were measured with a Sunset lab instrument (Sunset Labora-tory Inc.; OR, USA) implemented with the EUSAAR-2 protocol (Cavalli et al., 2010). Analytical procedures and detection limits of the methods are reported in detail by Paraskevopoulou et al. (2014). Finally, measurements of an-ions in PM1 were performed at Finokalia using a particle-into-liquid sampler (PILS) (Orsini et al., 2003) running at 15.5 L min−1and coupled with an ion chromatograph (IC). More information on the PILS-IC settings used here is avail-able in Sciare et al. (2011).
Wind speed, wind direction, as well as the concentra-tions of ozone (O3)and nitrogen oxides (NOx: NO+NO2)
Figure 1. (a)Geographical map of the PMCAMx model domain covering the greater area of the Aegean Sea, showing also the trajectories for the nine flights during the modelling period (29 August–09 September 2011). All flights took off and landed at the airport of Chania. The aircraft over the Aegean Sea moved anti-clockwise. The ground monitoring sites are indicated by the bold fonts. The rest indicate areas discussed within the text.(b)The aircraft altitude during the time frame of each flight.
3 Methodology 3.1 Model framework
The model system used in this study is comprised of the re-gional aerosol model PMCAMx, the rere-gional meteorological model WRF/ARW (hereafter referred as WRF, Skamarock et al., 2008) and the global chemistry transport model GEOS-CHEM (Bey et al., 2001), following the methodology de-scribed by Tombrou et al. (2009). The setup of the modelsis given in Table 1 and Sect. S1 in the Supplement. All air qual-ity model results presented in this study correspond to the PMCAMx runs.
PMCAMx is the research version of a former version (v.4) of the publicly available 3-D, Eulerian chemical trans-port model CAMx (ENVIRON, 2003). Aerosols therein, are represented by a detailed chemical composition: potassium (K+), calcium (Ca2+), magnesium (Mg2+), NH+
4, sodium
(Na+), SO2−
4 , NO3, Cl−, water (H2O), EC, reactive and
in-ert primary organic aerosols (APO and POA, respectively), oxidized APO (AOO) and secondary organic aerosols of an-thropogenic (ASOA) and biogenic (BSOA) origin. All these species are distributed over 10 discrete and internally mixed size sections, in the diameter range of 0.04 to 40 µm (cut-off diameters: 0.04, 0.08, 0.1, 0.3, 0.6, 1.2, 2.5, 5, 10, 20, 40 µm). This chemical and size treatment results in 400 aerosol model components in total.
The aerosol-related dynamical processes considered in PMCAMx include primary emissions, new particle for-mation by nucleation, condensation, evaporation, wet and dry deposition, coagulation and chemistry. The incorpo-rated chemical modules are shown in Table 1. The age-ing rate constants for primary and secondary organic aerosols (both anthropogenic and biogenic) are 4×10⁻¹¹ and 1×10⁻¹¹cm3mol−1s−1, respectively (Murphy et al., 2011).
3.2 Model coupling
In the frame of this study, the two chemical models are coupled offline, so that GEOS-CHEM provides concentra-tions for a series of species at the boundaries (lateral and top; boundary conditions – BCs) of the PMCAMx domain for each hour of the simulation period. A three-dimensional initialization field (29 August 2011, 00:00 Local Standard Time; LST) is also extracted from GEOS-CHEM and used by PMCAMx (ICs). Differences in the chemistry and spa-tial resolution used by the two models demanded a chemi-cal and three-dimensional matching between the two mod-els with respect to the gas and aerosol fields. The chemi-cal linking between the two air quality models (Table 2) in-volves 41 gaseous species (20 of which are VOCs) and 63 aerosol species (SO2−
4 , NO−3, NH+4, APO, ASOA, BSOA,
EC, Na+, Cl−, Mg2+, Ca2+and others, distributed over the size bins treated by PMCAMx). A conversion factor of 2.1 was used to calculate total organic aerosols (OA) from the OC GEOS-CHEM outputs, of which value is suitable for non-urban areas (Turpin and Lim, 2001) and has already been reported in the literature for OA over Crete (Sciare et al., 2005; Hildbrandt et al., 2010). In order to assess the relative contribution of the different OA precursors to the total SOA transported from outside the PMCAMx modelling domain (GEOS-CHEM BCs), each of the five lumped SOA species treated by the volatility basis set (VBS) scheme in PM-CAMx is coupled to each unique oxidative product treated by GEOS-CHEM (instead to that of the uniform distribution of their mixture, Sect. 4.3). Sea-salt and dust species treated by GEOS-CHEM are chemically resolved to the PMCAMx species following Athanasopoulou et al. (2008) and Kandler et al. (2007) respectively (cf. Table 2).
The hourly meteorological fields provided offline by the WRF to the PMCAMx, include horizontal wind speed, tem-perature, diffusion coefficients (Kv), pressure and water
vapour, cloud optical depth, cloud and precipitated water.Kv
T able 1. Main characteristics of the WRF meso-scale meteorological model, the GEOS-Chem v8-03-01 global and the PMCAM x re gional CTM applications. WRF GEOS-Chem PMCAMx Chemical and ph ysical mechanisms Planetary boundary layer (PBL) parameterization: YSU (Hong et al., 2006) (standard run). BOULA C (Bougeault and Lacarrére, 1989) and QNSE (Suk orian-sk y et al., 2005) are used in tw o additional scenarios. NO x –O x –h ydrocarbon-aerosol species module (the SO A module by Chung and Seinfeld, 2002 and Henze et al., 2008 is inc luded). The mechanism is combined to the ISORR OPIA II aerosol thermodynamics (F oun-toukis and Nenes, 2007). Gaseous chemistry: SAPRC99 (Carter ,1990), inor ganic aerosol chemistry: ISORR OPIA II (F ountoukis and Nenes, 2007), or ganic aerosol chemistry: VBS (Shri vas-ta va et al., 2008; Lane et al., 2008) Initial, lateral and boundary conditions National Centers for En vironmental Prediction (NCEP) operational Global Final Analyses (1.0 ◦× 1.0 ◦) From the global GEOS-chem simulation (4.0 ◦× 5.0 ◦) From the gl obal GEOS-chem simulation (0.5 ◦× 0.667 ◦) Input data Sea surf ace temperature (SST): real-time global SST analysis data (0.5 ◦× 0.5 ◦) Land use cate gories: 24 Soil cate gories: 16 (US Geological Surv ey) Anthropogenic emissions: W ang et al. (1998), Benk ovitz et al. (1996), Y evich and Log an (2003), Piccot et al. (1992) Natural emissions: Price and Rind (1992) Meteorological data: Goddard Earth Observing System (GEOS-5)/N ASA Global Modeling and Assimilation Of fice Anthropogenic, agricultural, forests: Hellenic Ministry of En vironment, EMEP , Sea-salt and dust: Athanasopoulou et al. (2008, 2010) Meteorological data: from the WRF simulation (0.056 ◦× 0.056 ◦) V ertical grid 35 sigma le vels (from ca. 10 m a.g.l. to 50 hP a) 47 hybrid eta le vels (from ca. 50 m a.g.l. to 0.01 hP a) 14 le vels (from surf ace to ca. 5.8 km) Parent and nesting domains (e xtended ar -eas of) (A) Europe (0.5 ◦× 0.5 ◦) (B) Greece and Italy (0.167 ◦× 0.167 ◦) (C) Ae gean Archipelago (0.056 ◦ × 0.056 ◦) (A) Global domain (4 ◦× 5 ◦) (B) Europe (0.5 ◦× 0.667 ◦) Ae gean Archipelago (0.056 ◦ × 0.056 ◦)
then adjusted for the heights under 100 m, which is found to benefit air quality predictions (ENVIRON, 2011). Minimum
Kvvalue is set to 0.1 m2s−1.
3.3 Simulations setup
The PMCAMx simulation domain is the greater area of the Aegean Archipelago (Fig. 1a; 34.1 to 42.5◦N, 18.4 to 29◦E) with 0.056◦(∼6.2 km) horizontal grid resolution and 14 ver-tical layers with their domain-averaged layer top at 20.9, 29.3, 69.7, 129, 169, 228, 531, 869, 1256, 1696, 2166, 3252, 4496 and 575 m above ground level (a.g.l.). The simulations are realized during the period from 29 August to 09 Septem-ber 2011, so that they are directly comparable with measure-ments. Model outputs are extracted on hourly basis. The first 2 days are used as a spin-up.
Emissions from the anthropogenic, agricultural ac-tivities and forests used by the PMCAMx model for the area of Greece are based on a National database provided by the Ministry of Environment for the year 2002. The emission rates for the area of Turkey are retrieved from the EMEP emission data set (http://www.ceip.at/webdab-emission-database/ officially-reported-emission-data/). Analytical information on the setup for the WRF and GEOS-CHEM simulations, as well as on the emissions treated by the chemical models is given in the Supplement (Sect. S1).
The standard model application that provides the base-case outputs follows the modelling configuration described so far. The first applied scenario aims at investigating the exogenous aerosol fraction over the Aegean Archipelago (trans-boundary pollution). This is captured by the coupling between PMCAMx and GEOS-CHEM models and was iden-tified through a combination of two simulations: the standard run (i.e. BCs provided by GEOS-CHEM) and a scenario with constant, minimum BCs (scenario 1). The different contribu-tion to aerosol levels from sources in Greece and the Turk-ish area (covered by the simulation domain) is calculated by switching off the emissions from Turkey in scenario 1 (sce-nario 2) (Sects. 4.2 to 4.4).
To assess the sensitivity of organic aerosol simulation per-formance, a series of model scenarios was performed. Here, results on the OA sensitivity to their ageing process are pre-sented, following previous model studies (Tsimpidi et al., 2010; Fountoukis et al., 2011): one scenario with the BSOA ageing switched off (scenario 3) and another with the ASOA ageing constant multiplied by 4 (scenario 4) (Sect. 4.3).
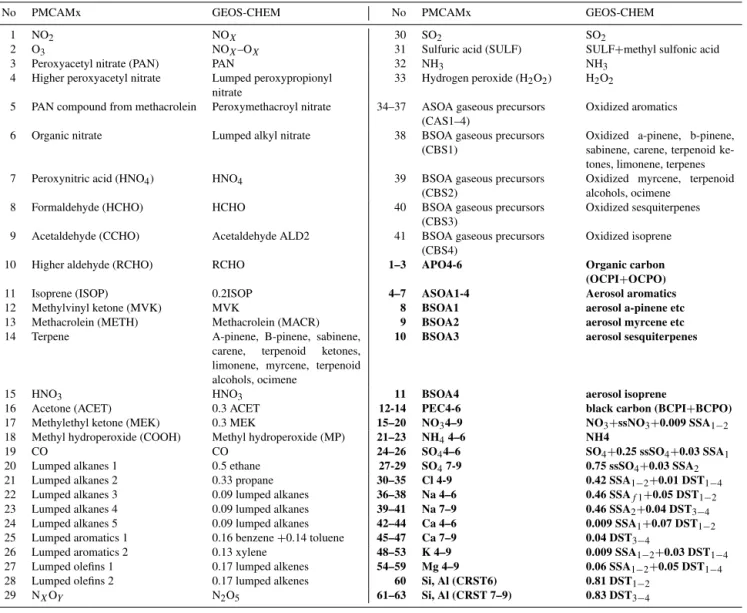
Table 2.The chemical coupling (in ppb) between the PMCAMx (SAPRC, ISORROPIAII and VBS mechanisms) and the GEOS-CHEM (SOA mechanism) model. Aerosols are shown in bold. The numbers next to PMCAMx aerosol species correspond to their size bins. PM2.5 in PMCAMx corresponds to the bins 1 to 6, while the rest of the bins (7 to 10) are PM2.5−40. Sea-salt aerosols (SSA) in GEOS-CHEM are simulated in two bins (effective diameter ranges 0.2 to 5 and 5 to 8 µm), while dust particles (DST) are split into 4 bins (effective diameters 1.4, 2.8, 4.8 and 9 µm).
No PMCAMx GEOS-CHEM No PMCAMx GEOS-CHEM
1 NO2 NOX 30 SO2 SO2
2 O3 NOX–OX 31 Sulfuric acid (SULF) SULF+methyl sulfonic acid
3 Peroxyacetyl nitrate (PAN) PAN 32 NH3 NH3
4 Higher peroxyacetyl nitrate Lumped peroxypropionyl nitrate
33 Hydrogen peroxide (H2O2) H2O2 5 PAN compound from methacrolein Peroxymethacroyl nitrate 34–37 ASOA gaseous precursors
(CAS1–4)
Oxidized aromatics 6 Organic nitrate Lumped alkyl nitrate 38 BSOA gaseous precursors
(CBS1)
Oxidized a-pinene, b-pinene, sabinene, carene, terpenoid ke-tones, limonene, terpenes
7 Peroxynitric acid (HNO4) HNO4 39 BSOA gaseous precursors
(CBS2)
Oxidized myrcene, terpenoid alcohols, ocimene
8 Formaldehyde (HCHO) HCHO 40 BSOA gaseous precursors
(CBS3)
Oxidized sesquiterpenes 9 Acetaldehyde (CCHO) Acetaldehyde ALD2 41 BSOA gaseous precursors
(CBS4)
Oxidized isoprene
10 Higher aldehyde (RCHO) RCHO 1–3 APO4-6 Organic carbon
(OCPI+OCPO)
11 Isoprene (ISOP) 0.2ISOP 4–7 ASOA1-4 Aerosol aromatics
12 Methylvinyl ketone (MVK) MVK 8 BSOA1 aerosol a-pinene etc
13 Methacrolein (METH) Methacrolein (MACR) 9 BSOA2 aerosol myrcene etc
14 Terpene A-pinene, B-pinene, sabinene,
carene, terpenoid ketones, limonene, myrcene, terpenoid alcohols, ocimene
10 BSOA3 aerosol sesquiterpenes
15 HNO3 HNO3 11 BSOA4 aerosol isoprene
16 Acetone (ACET) 0.3 ACET 12-14 PEC4-6 black carbon (BCPI+BCPO)
17 Methylethyl ketone (MEK) 0.3 MEK 15–20 NO34–9 NO3+ssNO3+0.009 SSA1−2
18 Methyl hydroperoxide (COOH) Methyl hydroperoxide (MP) 21–23 NH44–6 NH4
19 CO CO 24–26 SO44–6 SO4+0.25 ssSO4+0.03 SSA1
20 Lumped alkanes 1 0.5 ethane 27-29 SO47-9 0.75 ssSO4+0.03 SSA2
21 Lumped alkanes 2 0.33 propane 30–35 Cl 4-9 0.42 SSA1−2+0.01 DST1−4
22 Lumped alkanes 3 0.09 lumped alkanes 36–38 Na 4–6 0.46 SSAf1+0.05 DST1−2
23 Lumped alkanes 4 0.09 lumped alkanes 39–41 Na 7–9 0.46 SSA2+0.04 DST3−4
24 Lumped alkanes 5 0.09 lumped alkanes 42–44 Ca 4–6 0.009 SSA1+0.07 DST1−2
25 Lumped aromatics 1 0.16 benzene+0.14 toluene 45–47 Ca 7–9 0.04 DST3−4
26 Lumped aromatics 2 0.13 xylene 48–53 K 4–9 0.009 SSA1−2+0.03 DST1−4
27 Lumped olefins 1 0.17 lumped alkenes 54–59 Mg 4–9 0.06 SSA1−2+0.05 DST1−4
28 Lumped olefins 2 0.17 lumped alkenes 60 Si, Al (CRST6) 0.81 DST1−2
29 NXOY N2O5 61–63 Si, Al (CRST 7–9) 0.83 DST3−4
(QNSE) (Sukoriansky et al., 2005) (scenario 6). This selec-tion was based on wind speed differences between seven dif-ferent PBL schemes (Dandou et al., 2014) (Sects. 4.2 to 4.3). In order to compare predicted versus measured nitrate aerosol fractions (i.e. using the AMS data), a sea-salt aerosols-free case was applied (scenario 7) (Sect. 4.5). A summary of all model applications is given in Table 3.
3.4 Model evaluation statistics
Aerosol predictions are compared against AMS measure-ments using the statistical measures of mean bias (MB) and error (ME), mean fractional bias (MFB) and error (MFE), normalized mean bias (NMB) and error (NME), root mean square error (RMSE) and correlation coefficient (r andr2).
The formulas of these indices are given in Table S2 in the Supplement. The airborne observational data that fall within a computational cell during a model time step (hour) are av-eraged, in order to be directly comparable with the model outputs.
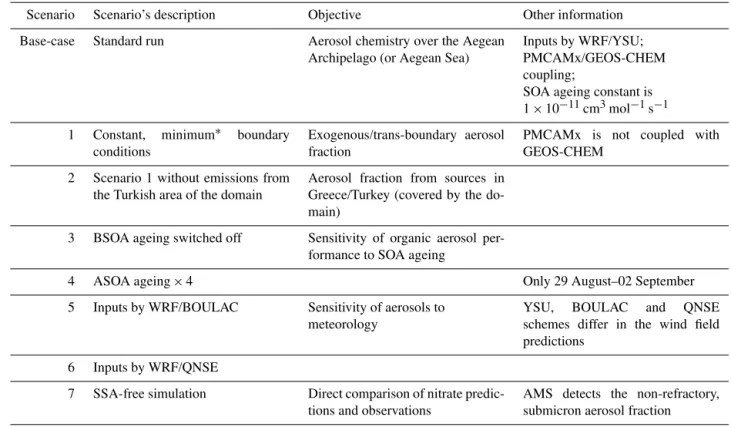
Table 3.Description of the modelling scenarios performed by the PMCAMx model during 29 August–09 September 2011.
Scenario Scenario’s description Objective Other information
Base-case Standard run Aerosol chemistry over the Aegean
Archipelago (or Aegean Sea)
Inputs by WRF/YSU; PMCAMx/GEOS-CHEM coupling;
SOA ageing constant is 1×10⁻¹¹cm3mol−1s−1 1 Constant, minimum∗ boundary
conditions
Exogenous/trans-boundary aerosol fraction
PMCAMx is not coupled with GEOS-CHEM
2 Scenario 1 without emissions from the Turkish area of the domain
Aerosol fraction from sources in Greece/Turkey (covered by the do-main)
3 BSOA ageing switched off Sensitivity of organic aerosol per-formance to SOA ageing
4 ASOA ageing×4 Only 29 August–02 September
5 Inputs by WRF/BOULAC Sensitivity of aerosols to meteorology
YSU, BOULAC and QNSE
schemes differ in the wind field predictions
6 Inputs by WRF/QNSE
7 SSA-free simulation Direct comparison of nitrate predic-tions and observapredic-tions
AMS detects the non-refractory, submicron aerosol fraction
∗aerosol species concentrations are equal to 10−9µg m−3.
Each of these paired samples were subdivided into two samples, on the basis of thresholds considering the model performance; i.e. the threshold is set for the parameter value where performance goals are met (or not) for the∼75 % of the predicted values of the one (or the other) sub-sample. In particular, the threshold regarding altitude is estimated to be at 2.2 km, close to the PBL height over the domain. Other thresholds set for the paired samples are the longitude of 27◦that separates the Aegean Sea from Turkey, the 0-degree winds that divide NW from NE (northeast) sectors and the wind speed of 9 m s−1. The statistical hypothesis tests (F andttests) confirmed that for all cases, the two sub-samples
were significantly different from each other. This procedure specified under which conditions (e.g. wind speed values and direction) aerosol model performance over the AS is system-atically good or poor and is presented in Sects. 4.2 to 4.4.
4 Results and discussion
The following sections analyse the model results with re-spect to the measurements. In parallel, measurement find-ings are supported by the capabilities of the current model system. Model outputs are thoroughly evaluated against air-borne AMS and ground-based observations. MFB and MFE were selected as the most appropriate metrics to summarize aerosol model (PMCAMx) performance (Boylan and
Rus-sell, 2006). The calculated values are compared against the proposed goals and criteria for each aerosol species (Ta-ble S2), in order to characterize model performance as good (the level of accuracy that is considered to be close to the best a model can be expected to achieve) or average (the level of accuracy that is considered to be acceptable for modelling applications). When the standards are not met for one or more species, the model skills (with regard to these species) are characterized as poor, and the reasons for the model dis-crepancies are further investigated.
The WRF model was evaluated following the model-evaluation benchmarks suggested by Tesche et al. (2001) and Emery et al. (2001). In particular, mean absolute gross error (MAGE), MB, RMSE and index of agreement (IA) are com-pared against the proposed benchmark values (Table S2).
4.1 Meteorology and gas-phase chemistry
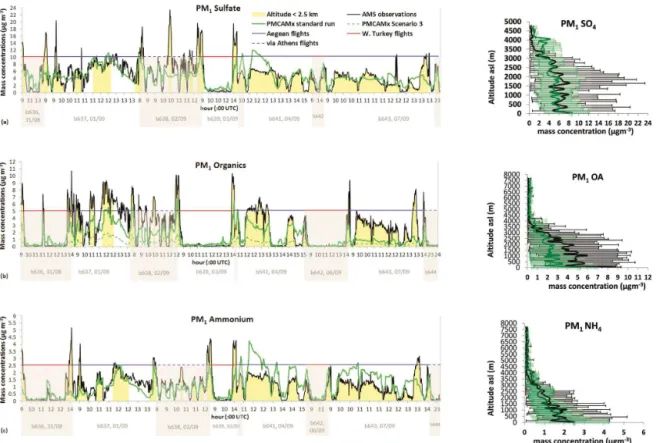
Figure 2.Comparison of PMCAMx results (green continuous line) with AMS airborne measurements (black continuous line) for total PM1: (a)sulfate; the legend applies for all succeeding graphs,(b)organics (green dashed line for scenario 3 is also shown),(c)hourly particulate ammonium concentrations (µg m−3
)for all flights in the frame of the AEGEAN-GAME, ACEMED, CarbonExp and CIMS campaigns, during 31 August–09 September 2011. Data from the flights over the Aegean Sea, via Athens and over west Turkey are discriminated by the horizontal blue, dashed-blue and red lines, respectively. The yellow shaded area indicates mass concentrations below 2.2 km a.s.l. The flight numbers and dates are shown at the bottom. More detailed flight information is embedded in Fig. 1. On the right of each graph, the vertical profile of each species averaged per 100 m (error bars with minimum and maximum values) is shown.
An overall good agreement is found between the airborne measured and simulated values over the archipelago, as far as humidity, air temperature and wind direction are con-cerned (cf. Table S3). Regarding wind speed, model perfor-mance is weaker (two out of the three proposed benchmarks are reached, as shown in Table S2). The predicted mean value (8.0 m s−1)along all flight tracks is in good agreement with the measured one (8.4 m s−1; Table S3). More specifi-cally, the average (maximum) predicted value was 9.0 (16.5) and 7.5 (19.5) m s−1upon the flight tracks below and above 2.2 km a.s.l., respectively. The corresponding measured wind speeds were 9.7 (22.4) and 7.8 (24.1) m s−1. As far as the surface-wind speed (at 10 m a.g.l.) is concerned, the 9-day average (minimum to maximum) surface wind speed predic-tions at Finokalia were 7.5 (3.0 to 10.7) m s−1, while the re-spective measurements were 6.8 (1.1 to 9.1) m s−1. The dif-ferent scale between point measurements and model results, which represent volume averages, contributes to this diver-gence.
Fourth and seventh September 2011 were typical Ete-sian days with strong-channelled northeasterly surface winds
(>15 m s−1) over the archipelago (Tyrlis and Lelieveld, 2012). Under such conditions, the afternoon marine atmo-spheric boundary layer was around 1000, 700 and 500 m in the north, SW and SE (southeast) Aegean, respectively, suc-cessfully represented by the PBL schemes used in this study (Tombrou et al., 2015; Dandou et al., 2014).
Gas-phase comparisons between PMCAMx and ground concentration measurements do not exhibit any significant inconsistencies. The 12-day average (minimum to maxi-mum) NOx and O3 predictions at Finokalia were 0.4 (0.1
to 2.8) and 62 (42 to 72) ppbv, while the respective measure-ments were 0.5 (0 to 1.4) and 66 (41 to 89) ppbv. The tem-poral correlation between predictions and measurements is also good, i.e. NME of the hourly data series is 55 and 10 %, respectively (Fig. S1b and c in the Supplement).
4.2 Sulfate aerosols (PM1SO4)
4.2.1 Model evaluation
Figure 2a shows all available prediction–observation pairs of the airborne PM1SO4in the greater area of the archipelago. The average profile of airborne sulfate is rather homogeneous up to 2.2 km a.s.l. and shows average modelled (measured) concentration of 5.8 (5.5) µg m−3. Concentrations smoothly decline aloft, reaching lower values (<1 µg m−3) above 4.2 km. The high uniformity and content in the vertical is a first indication that the low troposphere above the AS is a receptor of distant industrial plumes and medium-range sources, especially under strong NE winds (Fig. S1a). This also explains the higher sulfate concentration values in the lower troposphere above the AS (modelled: 5 µg m−3 and measured: 4.7 µg m−3)than above Turkey (which are 3.6 and 3.7 µg m−3, respectively).
The average model performance statistics have satisfac-tory values with 77 % of the data pairs being within the 2:1 and 1:2 lines (Table S3). The MFB and MFE, when com-pared with the goals, rate the sulfate model system perfor-mance as good, with only 15 % of the MFE values calculated for each data pair being outside the criteria lines.
The good model performance is also supported by check-ing each ground data pairs. Figure 3 shows all predictions of PM1SO4against the respective available (PILS-IC)
mea-surements from ground level, while Table S4 embeds the average ground statistics. The average modelled (measured) concentration is 5.9 (6.4) µg m−3, representative of the afore-mentioned domain-wide average within the PBL over the archipelago. Most of MFE values meet the criteria with few outliers observed (14 % of the cases). Evidently, there is no clear diurnal cycle of sulfate during the studied period (Fig. 3). This is attributed to the lack of strong local sulfur dioxide (SO2)sources (Pikridas et al., 2010), as well as to
the continuous dispersion of the overflying plumes, during their transport over the sea.
Sulfate is the dominant species of the atmospheric aerosols, as indicated both by observations and predictions. This is in line with the majority of earlier long term observa-tions and campaigns in the region (Sciare et al., 2008; Pikri-das et al., 2010; Im et al., 2012). PM1SO4production is
re-lated to its gaseous precursors (SO2), mostly emitted from
the industrialized areas in the Balkans, Turkey and eastern Europe (Sciare et al., 2003a, b; Pikridas et al., 2010), which is converted to sulfuric acid (H2SO4)that has low vapour
pres-sure and nucleates or condenses mainly in the aerosol fine mode (Mihalopoulos et al., 2007). The satisfactory compar-ison between model predictions and spatially divergent ob-servations of sulfate over the greater area of the AS proves the representation of its sources and processes in the applied model system to be good.
4.2.2 Exogenous influences
Confidence in this model system allows the provision of sup-plementary information on the role of sulfur transport from outside the PMCAMx domain, not provided by the measure-ments. The origin of sulfate from the hot spot regions upwind of the archipelago is tracked by the calculation of the trans-ported mass to the total PM1SO4predictions (standard run
– scenario 1, light red shaded area in Fig. 3). It is found that a notable part of area-wide episodic events is attributed by about 85 % to trans-boundary transport of sulfate particles and its gaseous precursor during most of the studied period. The spatial distribution of daily mean sulfate concentrations over the domain of interest together with the contribution of the trans-boundary transport (standard run – scenario 1, iso-lines) is given for a representative Etesian day (Fig. 4a). The exact origin of SO4, determined by back-trajectory calcula-tions (Bezantakos et al., 2013), is the eastern Europe and the wider Black Sea region. The remaining 10–15 % SO4of PM1
is equally formed by sulfur emissions in the western conti-nental part of Greece and sources in the Turkish area of the domain (scenario 2−scenario 1).
A different pattern is observed on 31 August 2011, when the observed winds at Finokalia change to NW (Fig. S1a). The concentration map of this episode indicates that the air parcels passing over continental Greece (Athens and Pelo-ponnese) head towards the south AS (Fig. 4b). During that day, trans-boundary pollution in the area is less important compared to the rest of the studied period. In particular, the submicron sulfate over the south AS (Finokalia) is equally shaped by the local (domain-wide) and by the exogenous sources, with 80 % of the former originating from the Greek territory (scenario 2 −scenario 1). Interestingly, the peak values (∼10 µg m−3)at Finokalia observed during the
sul-fur transport from Greek power plants towards the south AS (Fig. 3) are lower than those related to the transport from the Balkans and from further NE (∼12 µg m−3). Model
incon-sistencies during this plume transport (Fig. 3) are related to the strong gradient from near-source to background, which is not accurately resolved and captured by the model’s grid resolution. The exogenous influence on SO4concentrations
in the north Aegean remains high (70 %) on 31 August and originates from the continental area between the Black and the Caspian Sea (Bezantakos et al., 2013).
4.2.3 Sensitivity of model performance
The high spatial and temporal resolution of airborne mea-surements, allows for an extended diagnostic evaluation and may help to better address poor model system performance over the EM. Increased model discrepancies are mostly at-tributable to the lower and the higher ends of airborne PM1 SO4 concentrations distribution (minimum and
be-Figure 3.Comparison of PMCAMx (total shaded area) with hourly measurements (black dotted line) of total PM1sulfate concentrations
(µg m−3)over Finokalia during 31 August–09 September 2011. The contribution of PMCAMx predicted trans-boundary (standard run – scenario 1, in light red) and local (scenario 1, in dark red) to the total PM1sulfate mass is also shown. The ability of the model to reproduce
observations is estimated through the calculation of the mean fractional biases (MFB), shown at the bottom. Model performance is average (good), when MFB values are within the red (green) lines (Boylan and Russell, 2006).
low, although it is typical for aerosol concentrations below 2 µg m−3(Boylan and Russell, 2006). The largest model un-derestimations occur mainly in the area of Chania, where measurements frequently exceed 14 µg m−3. Measurements during take-offs and landings are contaminated by local air-port emissions, while predictions cannot ideally reproduce concentrated plumes, but are representative of a much wider area (∼38 km2)and time scales (1 h). Indeed, sulfate model
predictions in the greater area of Chania (6 to 10 µg m−3) are much closer to previous measurements (7 to 9 µg m−3) in a nearby, suburban area (Kopanakis et al., 2012). The maximum sulfate aerosol concentration (23.4 µg m−3)is ob-served in the lower troposphere (∼1.7 km) over Athens (02 September 2011, around 10:00 UTC). Here, the model under-prediction (4.6 µg m−3) is intensified by the narrow shape of the Athens pollution plume (relative to the size of the model grid size), as well as by the spatial and temporal changes in actual conditions and fuels used for transportation in the greater Athens area, that are not captured in emission inventories.
For more in-depth examinations regarding model system skills for sulfate predictions, MFE for airborne data are bro-ken down for those parameters significantly affecting model performance (Table 4). As shown in this table, sulfate model performance is not consistent throughout the troposphere: it meets the goals at altitudes lower than 2.2 km a.s.l., but is poor at higher altitudes. This is more pronounced over Turkey (25 % of the total number of data pairs over 27 to 29◦E, correspond to altitudes from 4 to 7 km a.s.l.) and it is because a few large deviations between low concentration values (below 1 µg m−3)can have a significant impact on the overall performance assessment.
The other two parameters affecting sulfate model skills are related to the wind conditions. Good model performance
is observed under strong (>9 m s−1)NE winds above the archipelago (local measurements along the flight tracks), that are typical of an Etesian pattern (Tombrou et al., 2015). Un-der NW and/or winds of lower intensity, sulfate predictions are still acceptable. The sensitivity of sulfate on the simu-lated wind is further examined by scenarios 5 (BOULAC PBL scheme) and 6 (QNSE PBL scheme), providing the low-est and stronglow-est wind speeds respectively, below 2.2 km alti-tude. The average value inside the PBL layer ranges between 5.3 and 5.8 µg m−3, for an average wind speed variation from 8.6 (BOULAC) to 9.8 (QNSE) m s−1(below 2.2 km altitude) among the runs. Changes among concentration fields are anti-correlated with the wind fields, due to the higher disper-sion of pollution that is associated with stronger winds. The aerosol model skills are rather insensitive to these variations, although scenario 6 exhibited the lowest MFB and MFE val-ues (12.9 and 56.3 %, respectively) and the highest corre-lation with measurements (r2=0.4). Lastly, sulfate predic-tions showed a similar performance for all days (flights), in-dependently of the time of day and latitude.
4.3 Organic aerosols (PM1OA and PM10OC)
4.3.1 Model evaluation
Experimentally determined concentrations of the organic fraction of the submicron particles over the AS (Fig. 2b) are much lower than sulfate. In particular, the average measured concentration below 2.2 km a.s.l. is 4.2 µg m−3, with peaks ranging from 7 to 11 µg m−3. Similar findings have previ-ously been observed in the AMS measurements at Finokalia (Hildebrandt et al., 2010; Pikridas et al., 2010).
Figure 4.Daily average PM1lowest level concentration fields (µg m−3)of sulfate, organics and ammonium species, during:(a),(c),(e)NE winds (04 September 2011) and(b),(d),(f)NW winds (31 August 2011), blowing over the Aegean Sea. Iso-lines show the contribution of trans-boundary sources to the total aerosol mass [(standard run – scenario 1)/standard run].
2.3 µg m−3), which is consistent with findings reported by many modelling studies (e.g. Zhang et al., 2014, and refer-ences therein). Also, the comparison of GEOS-CHEM re-sults with integrated global airborne observations resulted in the underestimation of the median OA concentrations in 13 of the 17 aircraft campaigns over central Europe, North America and western Africa (Heald et al., 2011). The main reasons for such underestimations were the poor model rep-resentation of SOA, as well as the lack of important sources and sinks of OA. The sources of error that may have
con-tributed to the unaccounted OA mass in the current model system are investigated in Sects. 4.3.3, 4.3.4 and 4.3.6.
Table 4. Mean and mean fractional error (MFE) values for the complete sample and for paired sub-samples of the airborne model-measurement data set. Paired sampling is based on the methodology described in Sect. 3.4. MFE with bold italic (italic) fonts indicate good (poor) model performance, according to the selected evaluation criteria (cf. Table S2). The rest of the model outputs (MFE with black fonts) are acceptable (average model performance).
Airborne PM1 Sulfate (µg m−3) Ammonium (µg m−3) Organics (µg m−3)
PMCAMx mean (min–max) 4.8 (0.3–12.1) 1.1 (0.05–4.2) 1.4 (0.01–6.8)
AMS mean (min–max) 5 (0.2–23.4) 1 (0.05–5.2) 2.4 (0.05–10.7)
MFE ( % meets goals/criteria) 55(56/73) 63(70/79) 83(51)
1st pair of samples < 2.2 >2.2 km a.s.l. < 2.2 >2.2 km a.s.l.
PMCAMx mean (min–max) 5.5 (1.1–12.1) 3.8 (0.3–9.7) 2.3 (0.2–6.8) 0.9 (0.01–4.8) AMS mean (min–max) 5.8 (0.2–23.4) 3.7 (0.2–15) 4.4 (0.1–10.7) 1.1 (0.05–9.4) MFE (% meets goals/criteria) 44 (64/82) 72 (<50/59) 74 (<50/58) 89(<50/50)
2nd pair of samples Aegean Turkey Aegean Turkey Aegean Turkey
PMCAMx mean (min–max) 5 (0.5–12.1) 3.3 (0.3–10.7) 1.3 (0.06–4.2) 0.8 (0.05–2.7) 2 (0.1–5.6) 0.5 (0.01–4.8) AMS mean (min–max) 4.7 (0.2–20.4) 3.5 (0.2–19.6) 1.1 (0.05–4) 0.4 (0.05–2) 3.4 (0.05–9.3) 0.7 (0.05–8) MFE (% meets goals/criteria) 48 (63/79) 85(<40/46) 54 (79/87) 71(62/76) 77 (<60/60) 92(<30/36)
3rd pair of samples NE NW winds NE NW winds
PMCAMx mean (min–max) 5.4 (0.7–11.5) 4 (0.3/12.1) 1.9 (0.02–5.6) 1 (0.01–6.8) AMS mean (min–max) 5.6 (0.2–23.4) 4.1 (0.2–20.4) 3.2 (0.05–10.4) 1.6 (0.05–10.7) MFE (% meets goals/criteria) 51 (60/77) 61 (<60/69) 76 (<60/62) 89(<40/42)
4th pair of samples U > 9 <9 m s−1 U > 9 <9 m s−1
PMCAMx mean (min–max) 5.1 (0.4–12.1) 4.5 (0.3–11.3) 1.5 (0.06–4.2) 0.8 (0.05–3.1) AMS mean (min–max) 5.5 (0.2–23.4) 4.5 (0.2–20.42) 1.2 (0.05–4.3) 0.9 (0.05–5.2) MFE (% meets goals/criteria) 46(62/82) 63 (<60/65) 52 (80/100) 71(61/72)
whereas the large oxygenated fraction of organics in the AS troposphere creates a more homogeneous field.
Modelled organic concentrations (PM10 OA) are divided
here by a factor of 2.1, to extract the organic carbon mass concentrations over non-urban areas (see explanation in Sect. 3.2), which can be compared to ground PM10OC
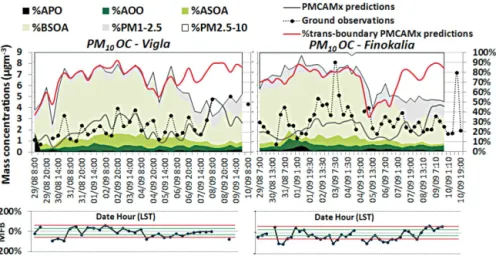
mea-surements. Model performance is good (Fig. 5 and Table S4), with 41 (82) % of the model predictions meeting the per-formance goals (criteria). The average PM10 OC
concentra-tion values are similar over the north and south AS (2.3 and 2.9 µg m−3, respectively), indicating the absence of major lo-cal OA sources, which can also explain the smaller range of their spatial variability.
4.3.2 OA analysis
The experimental data obtained during this study cannot sep-arate SOA from OA, their biogenic from their anthropogenic part, as well as the fine from the coarse organic PM10 frac-tion. Model outputs are used to help untangle these contri-butions (cf. Fig. 5). Similar predictions over both measure-ment sites suggest again the large spatial homogeneity of or-ganic particles over the archipelago. Up to 40 % of PM10
or-ganics are located between 1 and 10 µm (which is slightly higher compared to the 25 % experimentally determined at Finokalia by Sciare et al., 2003a), 75 % of which is coarse
(PM2.5−10). Submicron OA over the AS are mainly sec-ondary (95 %) and originate primarily (80 %) from biogenic sources, which is explained in the next paragraph. Most of these results are consistent with previous studies covering the region of the AS (Hildebrandt et al., 2010; Athanasopoulou et al., 2013), and are explained by the aged nature of the OA over the sea, especially during the summer period.
4.3.3 Uncertainties in OA treatment
Previous PMCAMx applications over Europe using the VBS scheme for SOA formation (Fountoukis et al., 2011, 2014), have been shown to be competent in predicting realistic lev-els of PM1 OA over the south Aegean Archipelago
Figure 5.Comparison of PMCAMx (grey lines) with 6-h measurements (black dotted line) of total PM10OC concentrations (µg m−3)over Vigla (left) and Finokalia (right) during 31 August–09 September 2011. The relative contribution of PMCAMx predicted trans-boundary (standard run – scenario 1, red line) to the total PM10OA mass is also shown. Green shaded areas represent the chemical composition of
PM1OA predictions, grey shaded area shows the organics in the PM1−2.5size range, while the remaining (white shaded area) represents the organics in the coarse fraction (PM2.5−10). All areas are percentage values. The ability of the model to reproduce observations is estimated through the calculation of the mean fractional biases (MFB), shown at the bottom. Model performance is average (good), when MFB values are within the red (green) lines (Boylan and Russell, 2006). The predicted OC is acquired by dividing OA by 2.1 (Turpin and Lim, 2001).
mean molar ratio NH+
4 /SO24−≤2), which facilitates BSOA
oxidation (cf. Zhao et al., 2013, and references therein). As a consequence, deactivating BSOA ageing (scenario 3; dotted green line in Fig. 2b) changed the model skills for organ-ics from average to poor (average predicted value from sce-nario 3 is 0.7 µg m−3 for the atmosphere up to 2.2 km a.s.l. over the AS).
The sensitivity of the model results on ASOA ageing (stan-dard run – scenario 4) was limited to 5 % both for the average OA concentration predictions and their chemical composi-tion. In particular, the faster oxidation rate of anthropogenic SOA resulted in a minor increase (up to 10 %) of the pre-dicted OA during the whole simulation period of scenario 4. Such a different model response to BSOA/ASOA changes stems from the isoprene/aromatics concentration ratio from
GEOS-CHEM (ICs), which takes the average value of 9/1
over the AS. Scenario 4 had a positive though minor effect on performance metrics.
A possible error in OA predictions introduced by the VBS mechanism is that species with similar volatilities can have different properties and reactivities. Nevertheless, the devel-opment of more complex VBS schemes with respect to these issues (Donahue et al., 2011) has already shown no signifi-cant improvements in OA performance over Europe. This is probably due to uncertainties in our understanding of SOA evolution in the atmosphere (Murphy et al., 2012).
In case the VBS chemical module would have intro-duced significant errors, then OA estimations would have performed similarly throughout the troposphere. In contrast, the OC model performance at both ground locations has been rated as “good” (cf. Sect. 4.3.1), while the calculated
statis-tics for the paired sampling for airborne organics revealed an inconsistent behaviour of biases throughout the troposphere (Table 4). The model performance in the upper atmosphere and especially in the area above Turkey (elevated flight paths, low concentration values, as described in the previous sec-tion) is rated as “poor” and deteriorates the overall organic model performance.
Overall, the well-established VBS scheme is investigated and revisited, so that it better describes OA behaviour over the southeastern Mediterranean during summertime. The current SOA treatment is found to be satisfactory and it is not regarded as introducing important errors in OA predictions.
4.3.4 Biomass burning component
Based on this evidence, bb particles are found to be an im-portant component of PM1OA over the AS during summer, which can largely explain the PM1OA underestimation (ca. 50 %) by the current model application, which lacks repre-sentation of fire emissions (cf. Sect. S2). This is a quite real-istic hypothesis, given the observations reported by Sciare et al. (2008) and Bougiatioti et al. (2014). In particular, the sys-tematic measurements of aerosols in the southern AS region (Finokalia) during late summer have shown that 30–35 % of OA comes from biomass burning in the eastern Balkans and at the European countries surrounding the Black Sea. Bossi-oli et al. (2014) have shown that the wildfire emissions sec-tor contributes on average ca. 50–60 % to the total PM1OA
mass predictions in the AS region during the summer, which further supports our speculation.
4.3.5 Other exogenous influences
Organic aerosol mass and gaseous (VOC) precursors from the Balkans and further north, shapes more than 90 % of their total concentration levels over the AS during the Etesian event (Fig. 4c). The effect of organic-rich plumes from conti-nental Greece during the non-Etesian event (with prevailing NW winds, Fig. 4d), as well as the domain-wide photochem-istry, decrease slightly the role of exogenous sources (now 70 % on average) over the whole region of the AS. Exam-ining the different chemical constituents of the transported SOA and precursors (34 to 41 gaseous and 4 to 11 aerosol paired species as listed in Table 2) in the studied domain, shows that the exogenous organic mass primarily originates from isoprene (mean NE boundary concentration values of 1 to 2 µg m−3), while aromatics are 2 to 6 times lower. The rest of the transported organic species (a-pinene, myrcene, sesquiterpenes etc) are insignificant. It should be noted that these findings correspond to the accounted sources of OA particles (and their precursors) by the current model setup, which do not reflect BB, as discussed in the previous section.
4.3.6 Other model performance issues
In order to further investigate the underestimation of the model to other important sources of OA, we performed a series of sensitivity tests. Independent artificial increases in emissions from the road transport, maritime and industrial sectors showed insignificant changes in the organic aerosol predictions. An additional scenario (increased values) for the applied BCs from GEOS-CHEM resulted in unrealisti-cally high OA concentration outputs. In general, although some uncertainty in the emission inventory as well as in GEOS-CHEM performance cannot be excluded, these do not contribute substantially to the OA underestimation, pointing again to the fire activity to be the main deficiency in the cur-rent model application with respect to OA results.
Wind also affects the quality of organic aerosol predic-tions, but only regarding direction, as already explained in
Sect. 4.3.4 . The day, time of day, latitude and wind speed do not affect organic aerosol model performance. The latter is also confirmed by scenarios 5 and 6 (MFE=72 to 80 %), al-though scenario 5, which was based on slightly lower winds (i.e. lower dispersion), produced slightly higher concentra-tion values having the subsequent (though minor) reduced model bias.
4.4 Ammonium aerosols (PM1NH4)
The hourly variation of airborne ammonium concentration predictions is consistent with the observations (Fig. 2c). Apart from the expected inconsistencies in the observed peak values already discussed, performance issues are tied with sulfate inconsistencies (e.g. during 04 September 2011). This is related to the fact that during summer most of the ammo-nium is associated with the sulfate rather than the nitrate frac-tion.
The average predicted (observed) PBL concentration of PM1 NH4 is 1.6 (1.4) µg m−3, which is consistent with the ground ammonium concentrations in earlier measurements at Finokalia (Kouvarakis et al., 2001; Metzger et al., 2006; Pikridas et al., 2010). Regardless of the high uncertainties in ammonia emissions usually incorporated in the photochemi-cal models (Skjøth et al., 2011), the reproduction of the ob-served data by the current model system is high, i.e. 70 (79) % of the MFE values meet the goals (criteria). The overall model performance for the ammonium species is good and optimized over the archipelago and under strong winds (Ta-ble 4). The rest of the examined parameters (flight/day, time of day, altitude, latitude and wind direction) do not seem to affect model performance with respect to ammonium.
Air parcels arriving in the simulation domain are predicted to contribute ca. 70 % of the average PM1 NH4 concentra-tions when originating from a NE direction (Fig. 4e) and by a lower percentage (though above 50 %) when originat-ing from NW (Fig. 4f).
4.5 Nitrate and chloride aerosols (PM1NO3and Cl)
The measured non-refractory submicron nitrate concentra-tions below 2.2 km a.s.l. (0.2 µg m−3in average) are strongly overestimated by the model system (1.9 µg m−3)(as shown in Table S3). This is attributed to two distinct reasons: the sea-salt component of nitrate (standard run – scenario 7), which is not captured by the AMS measurements, accounts for the 54 % of PM1 NO−
3 predictions. Also, the average
exogenous contribution from upwind (standard run – sce-nario 1) is ca. 1 µg m−3, which is unrealistic according to cur-rent measurements. When subtracting these mass fractions from total PM1NO3 predictions, the model results become
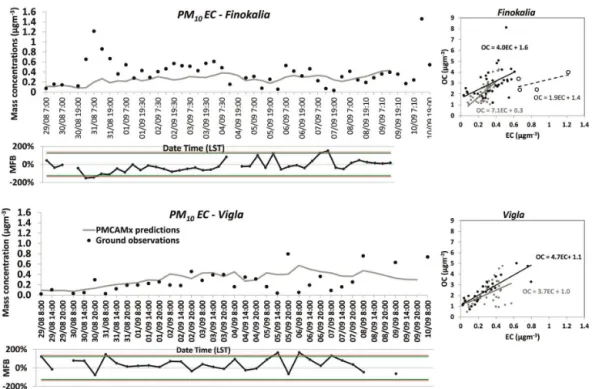
Figure 6.Comparison of PMCAMx (grey lines) with 6-h measurements (black dots) of PM10elemental carbon concentrations (µg m−3)over Vigla (top) and Finokalia (bottom) during 31 August–09 September 2011. The ability of the model to reproduce observations is estimated through the calculation of the mean fractional biases (MFB), shown at the bottom of each graph. Model performance is average (good), when MFB values are within the red (green) lines (Boylan and Russell, 2006). OC versus EC (grey/PMCAMx and black/measurements data points and lines) in PM10is shown on the right of each graph. The black dashed line in Finokalia reflects the slope of OC to EC for the measurements during the NW transport from continental Greek sources (black empty circles, 31 August 2011).
normalized model performance, but also due to the higher uncertainty of measurements.
Measured (submicron non-refractory) and modelled chlo-ride is low (<0.8 µg m−3), because of the insignificant sea-salt content in the submicron fraction, the inability of AMS to measure sea-salt chloride, as well as its gradual displacement by nitrate and sulfate ions. Nevertheless, model performance is found to be good (Table S3).
4.6 Particulate elemental carbon (PM10EC)
Figure 6 shows the diurnal variation of the PM10EC for the
ground sites of the south and north Aegean basin. Both the absolute values and their temporal evolution are well repro-duced by the model. In particular, the average measured (and modelled) concentration is ca. 0.3 µg m−3, and therefore the model performance is rated as good (Table S4), with a few exceptional outliers. Elemental carbon is dominated by com-bustion sources. Thus, it can be assumed that the fossil fuel sources are well represented by the emission data sets used by this model system.
As for sulfate, the footprint of continental Greek sources (mainly from the Athens metropolitan area) is apparent in EC concentrations at Finokalia during the prevailing NW direc-tions (0.6 to 1.2 µg m−3). During the rest of the period, EC levels fluctuate at similar levels at both sites.
Unlike PM1OA performance, no model underestimation related to the fire activity upwind is observed for surface PM10 EC. This is mainly because the long-range transport
of fire plumes is more efficient in higher altitudes due to the lack of surface deposition and stronger winds. Likewise, the PM10 OC measurements near ground, although slightly
un-derestimated by the model system (cf. Table S4), perform much better than PM1OA in and above the PBL (cf. Table 4).
In parallel, the signal of fires on the low levels of ground EC (average values of observations and predictions are largely below 1 µg m−3), already reported by Sciare et al. (2008), is most probably within the biases (ca. the 40 % of them is above 0.2 µg m−3)over the AS during summertime. The OC/EC ratio from the measured (modelled) data during this
period is as high as 4.7 (4.0) and 4.0 (7.1) at the north (Vigla) and south (Finokalia) AS (Fig. 6), being at similar levels with those measured previously in Finokalia (Koulouri et al., 2008; Pikridas et al., 2010; Im et al., 2012). OC/EC slopes
greater than 2 suggest the significant fraction of secondary species in the organic aerosol mass in background areas, as predicted and previously discussed in Sect. 4.3. The lower OC/EC slope at Finokalia during 31 August (1.9) is close
Figure 7.Comparison of PMCAMx (total shaded area) with 8-h measurements (black dotted line) of PM10concentrations (µg m−3)over Finokalia during 31 August–09 September 2011. Colour shaded areas represent the chemical composition of PM1predictions, the grey shaded area shows the PM1−2.5, while the remaining (white shaded area) represents the coarse fraction (PM2.5−10). The ability of the model to reproduce observations is estimated through the calculation of the mean fractional biases (MFB), shown at the bottom. Model performance is average (good), when MFB values are within the red (green) lines (Boylan and Russell, 2006).
the urban plume transport from the NW. The latter was also depicted in the spatial distribution of sulfate (Fig. 4b).
4.7 Particulate matter (PM10)
The average predicted total PM10 mass at Finokalia
dur-ing the simulated period is found to be 30.1 µg m−3. This value is very close to the average of the concurrent obser-vations (29 µg m−3), as well as to previous measurements in non-urban areas of the Mediterranean region (Rodriguez et al., 2001; Gerasopoulos et al., 2006; Lazaridis et al., 2008; Koulouri et al., 2008; Kopanakis et al., 2012). The perfor-mance skills of the model system on PM10 predictions are rated as good (Table S4) and the daily evolution of PM10 pre-dictions is satisfactory (Fig. 7). Atypically high PM10 con-centration levels observed at Finokalia on 01 September sug-gest that the quality of sampling on this particular day might be questionable.
The combined use of measurement and modelling tech-niques during this period is useful for the estimation of the chemical composition and the size distribution of PM10
mea-surements at Finokalia (Fig. 7). Sulfate account for the 45 % of PM1mass, followed by OM. The latter represents the 20 %
of PM1(2.6 µg m−3), which is similar to measurements at
Fi-nokalia (Pikridas et al., 2010). The predicted submicron am-monium content at Finokalia (1.7 µg m−3)is consistent ei-ther with the current airborne or with the past ground-based observations at this site (Sect. 4.4). The contribution of the rest aerosol species (Cl and EC) is minor (2 %). The levels of the submicron nitrate are greatly overestimated by the model system (Sect. 4.5).
Submicron aerosol is the largest fraction of the PM2.5mass
(76 %), but accounts for 42 % of the total PM10. This is
mostly related to the elevated coarse aerosol concentrations (14.2 µg m−3), which shape the PM
2.5/PM10 ratio around
54 %. Previous ground-based observations over the EM have resulted in fractions ca. 50 % (Kanakidou et al., 2011), fur-ther supporting the satisfactory aerosol predictions over the whole size range by this model system.
Given the similar levels of ground and airborne measure-ments over the AS and below 2.2 km a.s.l. (discussed in Sects. 4.2–4.5), it can be stated that the current analysis of the ground PM10measurements performed by the model is rep-resentative of the PBL above the archipelago during strong northern winds.
5 Summary and conclusions
A recently applied model system consisting of three well-established atmospheric models (namely, PMCAMx, WRF and GEOS-CHEM), and a unique aerosol data set collected in the EM are synergistically used in the frame of this study during a 10-day period characterized by strong north-ern winds (August–September 2011). The aircraft data set used represents a spatially diverse set of aerosol observations (covering the horizontal area of ca. 3×10⁵km2and extend-ing from the sea surface to 7.5 km aloft), employed to per-form the most extensive – to our knowledge – model eval-uation of major aerosol chemical component concentrations over the EM to date (>1300 observation-prediction samples
per species).
The vertical resolution in the measurements allowed the exploration of the aerosol profiles above the Aegean Sea. The PBL above the archipelago (<2.2 km a.s.l.) is
homoge-nously enriched in sulfate (average modelled and measured PM1 SO4 of 5.5 and 5.8 µg m−3, respectively), followed
Aerosol model performance within the PBL is largely within an acceptable level of accuracy (for all major chem-ical species except for nitrate), or even close to the best level of accuracy (sulfate, ammonium and chloride satisfy the criteria), with 50 to 80 % reproduction of these stan-dards. Comparison with the ground-based observations (356 observation-prediction samples in total) suggested an even higher model quality, with a good reproducibility of all stud-ied species and a few outliers (<15 % outside the criteria
lines).
Wide and commonly found under-predictions in sulfate, elemental carbon and coarse aerosols (cf. Nopmongcol et al., 2012) are not observed in the current study. Also, in contrast to the uncertainties in ammonia emissions usually reported in air quality modelling (e.g. Skjøth et al., 2011), the observed ammonium levels are well reproduced here. These findings support that the power plants, motorways and natural aerosol sources, including agricultural activities of the surrounding area of the archipelago and upwind, are well represented and treated by this model system.
Relatively high OC/EC ratios (4 to 5) from the ground
observations are successively reproduced by the PMCAMx model (OC/EC: 4 to 7), suggesting the large oxygenation
rate of the organic matter above the archipelago, nicely rep-resented by the employed OA chemical module. The acti-vation of the chemical ageing of BSOA in this formulation, greatly improves model performance due to the sufficient NOxconcentration and the sulfate-rich Aegean environment.
On the other hand, OA predictions showed minor (or unreal-istic) response to anthropogenic emissions and variations in BCs. The fire activity, not taken into account by the current model application, is the main cause of OA underestimation (ca. 50 %), which is consistent with local measurements of the fire-induced OA fraction (e.g. Bougiatioti et al., 2014). This finding serves as a challenge for future model develop-ment.
Model performance was also dependent on the altitude (below and above 2.2 km), the longitude (western and east-ern than 27◦E, i.e. above the AS and western Turkey, respec-tively), the wind speed (above and below 9 m s−1)and wind direction (NE and NW) over the studied area. The (time of) day and latitude did not affect model biases. The sensitivity of aerosol predictions on different PBL schemes showed a minor effect on aerosol concentrations (e.g. 5.3 to 5.8 µg m−3 and 2.1 to 2.4 µg m−3 for airborne sulfate and organics, re-spectively), and did not change model performance. Overall, aerosol predictions within the PBL over the archipelago un-der strong NE winds showed the best performance.
More than 70 % of the predicted aerosol mass over the AS during the Etesians is associated with the transport of aerosols and their precursors from outside the PMCAMx modelling domain. In the case of organics, this mass origi-nates primarily from the oxidation of isoprene. These find-ings underline the significance of the detailed gaseous and aerosol model coupling developed in this study, towards
more accurate model predictions. The origin of the trans-ported plume during NW winds, distinctively identified from the model simulations (Greek industrialized areas) and the daily evolution of sulfate, EC (and OC/EC) and total PM10,
shapes half of the total sulfate mass, the rest being attributed to the exogenous sources. Also, the observed peak in sub-micron sulfate during this event at Finokalia (10 µg m−3)is lower than the concentrations during the Etesian flow (12 to 14 µg m−3). Therefore, developing abatement strategies to reduce aerosol levels in the EM is both a national and transnational task. Key findings from the current and simi-lar applications can provide information on the origin of air parcels and the contribution of local and exogenous sources, thus on the effective design of air policies.
A forthcoming application of the same model system aims at investigating its performance, as well as aerosol levels and interactions during recent Saharan dust intrusions in the tro-posphere over the Aegean Sea.
The Supplement related to this article is available online at doi:10.5194/acp-15-8401-2015-supplement.
Acknowledgements. This work is in the frame of the AERAS-EtS
research project, which is implemented within the framework of the Action “Supporting Postdoctoral Researchers” of the Operational Program “Education and Lifelong Learning” (Action’s Beneficiary: General Secretariat for Research and Technology), and is co-financed by the European Social Fund (ESF) and the Greek state. Experimental data are available from: the AEGEAN-GAME-2 and ACEMED campaigns funded by EUFAR under FP7, the CarbonExp campaign funded by ESA and the CIMS project funded by the NERC campaign. Airborne data were obtained using the BAe-146-301 Atmospheric Research Aircraft flown by Directflight Ltd and managed by the Facility for Airborne Atmospheric Mea-surements (FAAM), which is a joint entity of NERC and the Met Office. We gratefully acknowledge the FAAM Team, M. Smith, A. Wellpott and A. Dean for all their effort to make campaigns successful. Many thanks to P. Brown and to the mission scientists D. Kindred and S. Abel, as well as the lidar person J. Kent, all from the Met. Office. E. Athanasopoulou thanks C. Fountoukis and S. N. Pandis for the use of the updated PMCAMx code, as well as V. Amiridis, D. Schuettemeyer and C. Percival for the use of the AMS data from the ACEMED, CarbonExp and CIMS flights. We greatly appreciate the constructive and helpful suggestions made by the two anonymous reviewers, which led us to important improvements in the manuscript.