Original Article
Artigo Original
Effect of time of contraction and rest on the
masseter and anterior temporal muscles
activity in subjects with temporomandibular
disorder
Efeito do tempo de contração e repouso na
atividade dos músculos masseter e temporal
anterior em indivíduos com DTM
Lilian Gerdi Kittel Ries1Maylli Daiani Graciosa1 Licerry Palma Soares1 Fabiana Flores Sperandio1 Gilmar Moraes Santos1 Viviane Veroni Degan2 Inaê Caroline Gadotti3
Keywords
Masticatory Muscles Muscle Fatigue Electromyography Temporomandibular Joint Disorders Craniomandibular Disorders
Descritores
Músculos Mastigatórios Fadiga Muscular
Eletromiograia
Transtornos da Articulação Temporomandibular Transtornos Craniomandibulares
Correspondence address:
Lílian Gerdi Kittel Ries Centro de Ciências da Saúde e do Esporte – CEFID, Universidade do Estado de Santa Catarina – UDESC Rua Pascoal Simone, 358, Bairro Coqueiros, Florianópolis (SC), Brazil, CEP: 88080-350.
E-mail: lí[email protected]
Received: April 23, 2015
Study carried out at Centro de Ciências da Saúde, Universidade do Estado de Santa Catarina – UDESC - Florianópolis (SC), Brazil.
1Centro de Ciências da Saúde, Universidade do Estado de Santa Catarina – UDESC - Florianópolis (SC), Brazil. 2Programa de Pós-graduação em Odontologia, Fundação Hermínio Ometto – UNIARARAS - Araras (SP), Brazil. 3Department of Physical Therapy, Nicole Wertheim College of Nursing and Health Sciences, Florida International
University, Miami, Florida, United States
Financial support: None.
Conlict of interests: nothing to declare.
ABSTRACT
Purpose: The main objective of this study was to investigate the effect of time of contraction and rest on the masseter and temporal muscles activity. Methods: 49 female subjects between 18 and 30 years of age were divided into TMD (n: 26) and control groups (n: 23). Surface electromyograph was used to evaluate the anterior temporal and masseter muscles during contraction and rest protocols. The root means square, median frequency
and slope coeficient of the linear regression line parameters were analyzed. Results: A signiicant effect of
time in the contraction and rest muscle protocols was found. TMD patients showed a signiicant decrease in median frequency in the right masseter muscle and the slope coeficient in the right temporal muscle during the
contraction protocol to control subjects. Conclusion: Despite the TMD patients presented with higher fatigue susceptibility compared to the control group, both groups must meet the maximum time of 5 s of maximum voluntary contraction and at least 30 s rest between successive contractions of masticatory muscles during clinical or research assessment protocols.
RESUMO
Objetivo: O principal objetivo deste estudo foi investigar o efeito do tempo de contração e repouso na atividade dos músculos masseter e temporal. Métodos: 49 sujeitos do gênero feminino com idade entre 18 e 30 anos foram
divididos em grupos DTM (n: 26) e controle (n: 23). A eletromiograia de superfície foi utilizada para avaliar os
músculos temporal anterior e masseter durante protocolos de contração e repouso muscular. Foram analisados
os parâmetros eletromiográico raiz quadrada da média, frequência mediana e o coeiciente da inclinação da
reta de regressão linear. Resultados: Foi encontrado efeito signiicativo do tempo no protocolo de contração e
de repouso muscular. No protocolo de contração, sujeitos com DTM apresentaram signiicativa diminuição da frequência mediana no masseter direito e do coeiciente de inclinação do músculo temporal direito comparados
INTRODUCTION
Temporomandibular disorders (TMD), also called craniomandibular dysfunction (CMD), is a broad term that includes several clinical manifestations involving the temporomandibular joint and associated structures. Emotional stress and muscle tension contribute and aggravate the TMD and can dificult its recovery(1).
Unilateral or bilateral pain caused by jaw movements or during palpation is the most common patient’s complaint(2).
Evidence shows that myofascial pain is related to muscle hyperactivity(3,4) and to alterations in the muscle motor behavior
during the function of mastication. Subjects with TMD present with more asymmetry during mastication(5,6) and larger amplitude
of muscle activity during rest position(7-9). TMD patients have
larger amplitude of muscle activity because of its lower functional eficiency and predisposition to muscle fatigue when compared to asymptomatic subjects performing the same activity(7).
The alteration of the normal pattern of muscle activity in TMD patients can affect their masticatory function and decrease its eficiency. Muscle fatigue is related to an increase in the concentration of metabolites and changes in both muscle iber conduction velocity and number of motor units recruited(10).
Typical movements of mastication can overload the elevator muscles of the jaw, and the different motor control strategies used are interpreted as tactics of a protective mechanism(3). However,
it is unclear how the time of a muscle contraction affects the behavior of the masticatory activity in individuals with TMD.
Muscle fatigue is considered a risk factor for changes in the masticatory performance in subjects with TMD(4).The activity of
the masticatory muscles in healthy individuals is characterized by periods of rest between consecutive muscle contractions. The knowledge of how muscle activity is modiied based on the time of contraction and/or rest, including the different motor control strategies, can help researchers and clinicians to improve existing diagnostic procedures.
Currently, there is no reliable information on the electromyography (EMG) parameters of amplitude (root mean square-RMS) and median frequency (MF) during contraction protocols and /or rest of masticatory muscles in subjects with TMD. It is believed that such individuals have changes in RMS and MF values during these protocols, when compared with subjects without TMD. Therefore, the objectives of this study was to investigate the effect of time of contraction and rest on the masseter and anterior temporal muscles activity in TMD patients and compare to healthy individuals.
MATERIAL AND METHODS
Subjects
This is an experimental cross-sectional study consisted of a sample of 49 females between 18 and 30 years of age recruited by local advertise. The subjects were recruited through local advertisements and were divided into two groups: TMD diagnosis (TMD group, n: 26, age: 23.58 ± 3.85 years, weight: 59.5 ± 9, 9 kg, height: 163.65 ± 6.24 cm) and a group without
a diagnosis or signs and symptoms of TMD (control group, n: 23, age: 21.65 ± 2.76 years, weight: 56.27 ± 6.54kg, height: 161.83 ± 6.14 cm).
The subjects were evaluated using the Research Diagnostic Criteria for Temporomandibular Disorder (RDC/TMD)(11).
The patients’ history and the clinical criteria were used to diagnose the TMD.
The study included subjects who had full permanent dentition (at least 28 teeth).
Subjects who had history of trauma to the face, temporomandibular joint, neck and scapular region; vestibular alterations; dislocation; systemic disorders such as arthritis and arthrosis; use of orthodontic and/or orthopedic functional appliance; use of analgesics and anti-inlammatory drugs were excluded from the study.
The subjects were informed about the procedures and objectives of the study and asked to sign the informed consent. This study was approved by the Research Ethics Committee of the university (number 149333).
Electromyography
After the informed consent was signed and the demographic data was collected, the electromyographic activity was evaluated. The EMG recording analysis was performed using a four-channel system (Miotool, MIOTEC, Porto Alegre, Brazil), with analog/digital converter board with 14-bit resolution, acquisition frequency of 2000 Hz, minimum rejection ratio of 110 dB and surface Ag/AgCl electrodes (Meditrace 200, Kendall™, EUA).
For the data collection, subjects were asked to remain seated in a chair with the head positioned towards Frankfurt position (parallel to the ground), hands resting on their thigh sand knees and aligned with the shoulder, back at the height of the scapula and hips and knees lexed to 90 degrees.
The electrodes were positioned along the muscle ibers and ixed on the skin, in the area of the anterior temporal (AT) and supericial masseter (MA) muscles bilaterally. The reference electrode was placed on the sternum notch. An isometric contraction of the jaw elevator muscles (teeth clench) was used to locate the AT and MA muscles(12, 13). In order to decrease the electrical skin
impedance, the muscle location was cleaned with hydrophilic cotton with 70% alcohol solution(14). The parailm (Parailm M,
Pechinery Plastic Packaging, Batavia, IL, USA) (made of wax paper) was bent 15 times to the size of 1.5 cm x 3.5 cm (bubble gum size) and positioned between the subjects occlusal surfaces of the irst and second upper and lower molars bilaterally in order to collect the data(15).
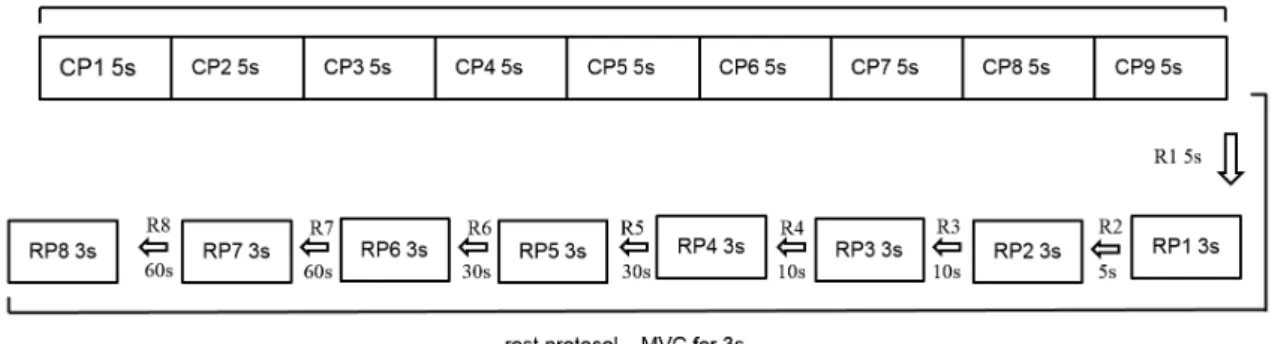
Time effect on muscle activity was evaluated during contraction protocol (CP) and rest protocol (RP)(4). The CP
allow the recovery of energy sources(16). Throughout the data
collection, all subjects received a verbal command in order to stimulate the MVC. A visual feedback with muscle activation display was also used to stimulate and maintain maximum amplitude of contraction. A procedure of familiarization with the test was performed for all subjects before the start of each data collection. The illustration of the steps of the data acquisition is shown in Figure 1.
Analysis
The EMG data was analyzed with Matlab software (version R2009a, MathWorks Inc, EUA). A butterworth ilter type and band pass with cut off frequency of 20 Hz and 500 Hz was used in the raw EMG signal. The amplitude and frequency parameters were analyzed. The amplitude was analyzed using the root mean square (RMS). The median frequency (MF) was calculated by the power density spectrum after 500 ms Hamming window (1000 data) using the Fast Fourier Transform (FFT). For the CP analysis (45 s), nine consecutive periods of 5 s were selected. In the RP, eight periods of 3 s were selected (Figure 1). The irst analyzed period (CP1) was considered the MVC standard for muscle CP and RP. Consequently, beyond the irst period, 16 windows (eight periods of CP and eight periods of RP) were analyzed. RMS and MF values were calculated for all periods over 1000 initial data. In order to calculate the effect of time on each muscle in CP and RP, all periods were normalized using CP1 ((each analyzed period of the CP or RP /CP1) X100). To check the effect of the irst rest period in the RP, the last period of the CP was considered the initial data.
Descriptive statistics was used to characterize the study subjects. To test the normality of the data, ShapiroWilks test was used. The effects of CP and RP were analyzed with Two-way (time and group) repeated measures analyzes of variance (ANOVA) with post hoc Bonferroni adjustment. Linear regression was used to analyze the nine periods included in both CP and RP for every muscle. The slope coeficient of the linear regression was calculated for MF and RMS values on the analyzed periods. Independent T-test was used to calculate the difference between the average slope coeficient of AT and MA muscles between TMD and control groups. The analysis was performed using Statistical Package for the Social Sciences
(SPSS 20.0). A signiicance level of 5% (p<0.05) with two tailed distribution was set for the analysis.
RESULTS
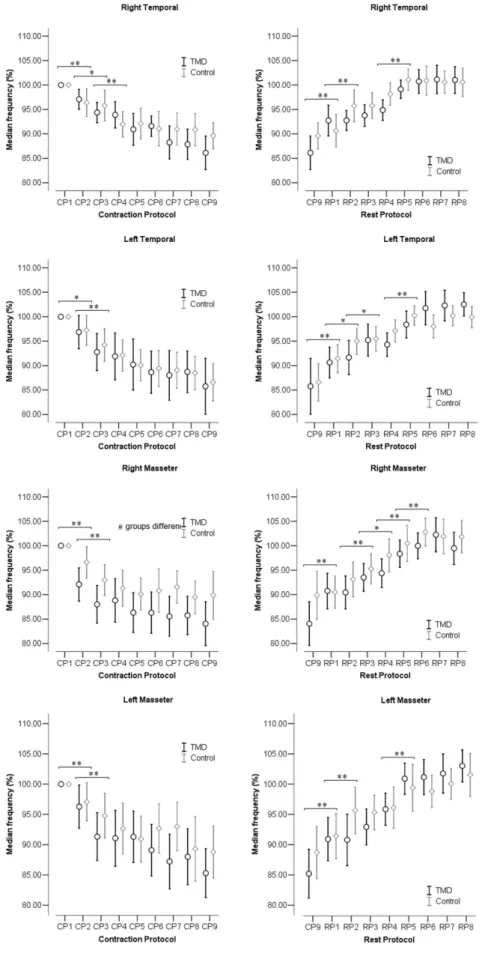
The MF (%), RMS (%), and the slope coeficient of MF and RMS for each muscle and period of CP and RP are shown in Figures 2, 3 and 4, respectively, for both TMD and control groups.
Effect of time and group in the MF% for muscle CP and
RP
In Figure 2, the MF decreased progressively during the CP and increased in the RP. Analysis of variance showed a signiicant effect of time for all muscles in both CP and the RP (p < 0.001). In the CP, signiicant difference was found after 5 s of contraction (between CP1 and CP2; CP2 and CP3) for all muscles (p < 0.05). In the RP, signiicant difference was found especially after 5 s of rest between CP9 and RP1 for all muscles (p < 0.05). In CP, a signiicant difference between control and TMD groups was observed for the right MA muscle (p = 0.047). There was no interaction effect between time and group in any of the tests (p > 0.05).
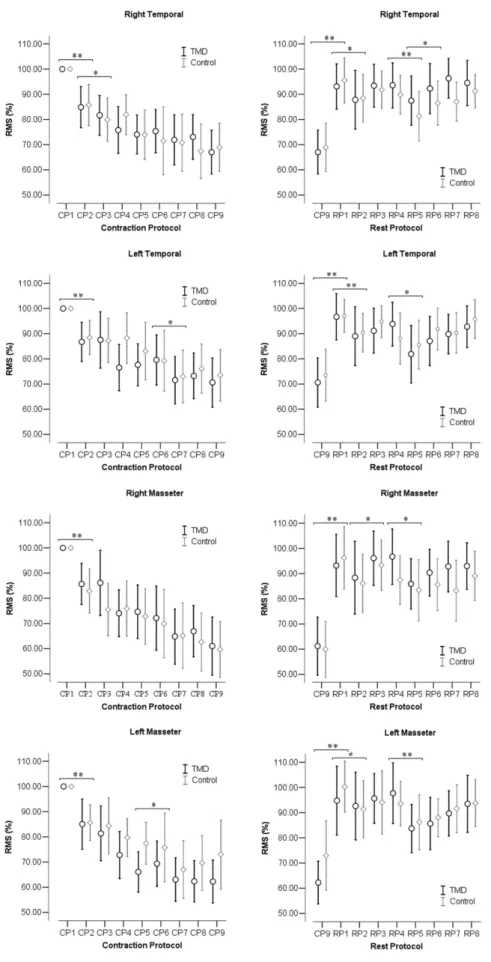
Effect of time and group in the RMS% for CP and RP
In Figure 3, the RMS% decreased progressively during the muscle CP. In RP, the RMS% increased particularly after the irst rest period. Analysis of variance showed a signiicant effect of time for all muscles in both CP and the RP (p < 0.001). In the CP, there was signiicant difference (p < 0.01) after 5 s of contraction (between CP1and CP2). In the RP, there was signiicant difference especially after 5 s and 10 s of rest (between CP9 and RP1) (p < 0.01). There was no group interaction effect (p > 0.05) or between group and time effect (p > 0.05) in any of the tests.
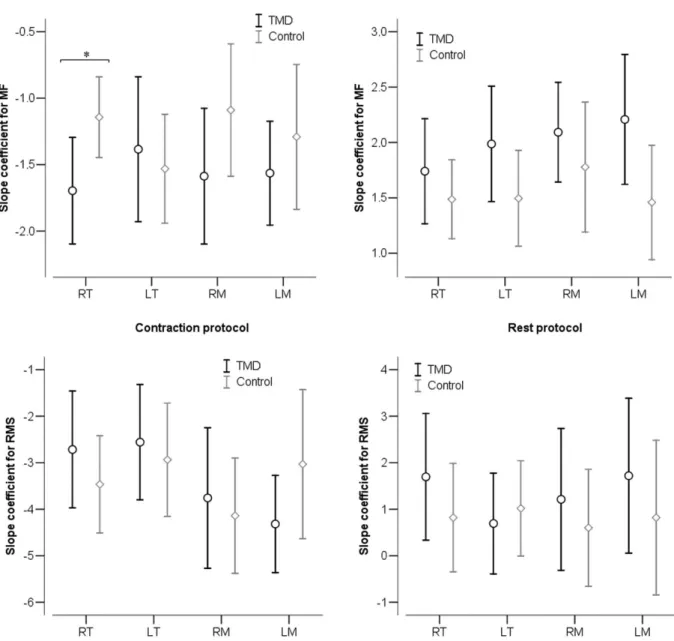
Slope Coeficient for MF% and RMS% between groups
In Figure 4, negative values of slope coeficient of the linear regression for both MF% and RMS% are observed in the muscle CP for all muscles. On the muscle RP, these values
Figure 2. Confidence interval (95%) of the median frequency between periods of contraction in the contraction protocol (CP) and rest protocol (RP) between TMD and control groups
Figure 3. Confidence interval (95%) of the root mean square (RMS) between periods of contraction protocol (CP) and rest protocol (RP) between TMD and control groups
were all positive. A signiicant difference was found between the groups in slope coeficient for MF% on the right AT muscle in the muscle CP (p = 0.03).
DISCUSSION
This study analyzed the effect of time of contraction and rest during the activity of the MA and AT muscles between subjects with and without TMD. The results of this study showed a progressive increase of susceptibility to fatigue during the CP for both MA and AT muscles bilaterally in both groups with a signiicant increase after 5 s and 10 s of maximum contraction. A signiicant recovery was also observed for both muscles in both groups during the RP especially after 5 s and 10 s of
rest. When compared to the control group, subjects with TMD presented with more levels of susceptibility to fatigue with a signiicant difference in the RM and RT muscles during the course of CP. The results of this study shows the importance of controlling the time of contraction and rest of the masticatory muscles during clinical and research protocols.
Exhausting muscle contraction induces change in its EMG activity, which is characterized by reduced MF(17). In the
masticatory muscles, a consistent relationship between the fatigue process and decrease in MF is observed(18). The results
of this study show that MF is a good indicator to analyze the susceptibility to fatigue of masticatory muscles as a progressive decrease of this parameter in the course of the CP. Additionally, there was a signiicant decrease in MF in all muscles analyzed
after the irst 5 s and 10 s of MVC. The susceptibility to fatigue started in a period before to that found by Maton et al.(18), 10 s,
regardless of whether the bite force was 15%, 30%, 45%, 60%, 75% and 90% of maximum.
The progress of fatigue promote to an increase in RMS values which is caused by the recruitment of new active motor units and its synchronization(19). However, associated with the
decreased of MF, a progressive decrease in the RMS in CP for all masticatory muscles was observed in the present study, with a signiicant difference after 5s of MVC. The reduction of RMS values after muscle fatigue was also observed in other studies(18, 20, 21). Maton et al.(18) observed a decrease in RMS while
maintaining 90 to 100% of bite force and a relationship between the time of isometric resistance and the level of bite force.
Although there is a decrease in the amplitude of muscle activity during maintenance of MVC, a decrease of MF was observed. One considered hypothesis is that the fatigue process includes both a reduction in the amplitude of contraction and an increased time of rest of the fatigued motor units which is compensated by a reduction of its iring rate(18). Therefore, if
the objective is to avoid masticatory muscles fatigue, times less than 5 seconds should be considered during a CVM. During clinical evaluation is necessary to prevent muscle fatigue to avoid functional changes that would compromise the correct analysis of the masticatory system.
It can be observed that the slope coeficient for MF was higher in RAT muscle in the TMD group. However, the analysis of the progression of the MF (Figure 2) shows that the right MA muscle in the TMD group was signiicantly lower compared to the control group. These results show different issues of muscle activity. The susceptibility to fatigue of the AT muscles occurred more gradually while the susceptibility to fatigue of the MA muscles was more intense in the irst periods to then, progress slowly. In summary, the MA muscles, especially in the TMD group, were quickly susceptible to fatigue. The supericial MA muscle has a greater concentration of type IIB ibers which is characterized by being less resistant to fatigue(22). A signiicant
correlation between the decline of MF and the increase of metabolic due to muscle fatigue during an MVC was found in another study(23). Therefore, it is assumed that such changes
occur more intensely in the TMD group.
In the rest protocol, a progressive muscle recovery was found by the increase of the median frequency and muscle activity amplitude with a signiicant difference particularly after 5 s and 30 s of rest (between CP9 and RP1, and between RP4 and RP5, respectively). The amplitude of muscle activity (RMS%) showed a higher recovery after 5 s of rest and recovery from fatigue (Figure 2) was also more gradual during the data acquisition protocol.
A recovery of muscle (MF% and RMS%) in RP was observed in all muscles. In addition, there was no signiicant difference between groups. Although MVC was requested, subjects failed to return to levels of 100% of the initial activity at the end of the protocol. The MF levels, in the end of RP, exceeded 100% of the initial protocol showing muscle recovery, with lower activity levels to those found initially.
The results of this study show that after 5 s of MVC of the masticatory muscles in the CP, a signiicant decrease in MF and muscle activity occurred in both groups. During the RP, a signiicant increase in MF occurred along with an increased muscle activity in both groups after 5 s of rest. However, after 30 s of rest, MF parameters of all muscles returned to the initial level (i.e. the level of the irst period). For clinical and research purposes, this study recommends to not exceed 5 s of MVC and consider a minimum of 30 s of rest between contractions of the masticatory muscles to prevent the onset of fatigue in both TMD and control groups.
One of the limitations of this study is the lack of measurement of bite force during MVC. During muscle CP and RP, the individual was presented with a visual information display to stimulate their maximum amplitude of contraction in addition to the verbal command provided by the researcher. As there was no monitoring of bite force, the conirmation of the fatigue phenomenon cannot be asserted. However, changes in electrical activity frequency show susceptibility to muscle fatigue during the EMG acquisition(24). Future studies should investigate if
the levels of muscle fatigue and muscle behavior is different among subjects with different types of TMD classiication and with severe pain level.
CONCLUSION
Time of MVC and rest of the MA and AT muscles during the CP and RP, respectively, have exercised a greater effect after 5 s in each of the protocols. Despite the TMD patients presented with higher susceptibility to fatigue compared to the control group, both groups must meet the maximum time of 5 s of MVC and at least 30 s of rest between successive contractions of masticatory muscles during clinical or research assessment protocols.
ACKNOWLEDGEMENTS
The authors thank the Scientiic Initiation Program of Santa Catarina State University (PROBIC-UDESC) by received study grants.
REFERENCES
1. Schiffman EL, Fricton JR, Haley D. Relationship of occlusion, parafunctional habits and recents life events to mandibular dysfunction in a non- patient population. J Oral Rehabil. 1992;19(3):201-23. http:// dx.doi.org/10.1111/j.1365-2842.1992.tb01095.x. PMid:1500964. 2. Storm C, Wänman A. A two-year follow-up study of temporomandibular
disorders in a female Sami population: validation of cases and controls as predicted by questionnaire. Acta Odontol Scand. 2007;65(6):341-7. http:// dx.doi.org/10.1080/00016350701742356. PMid:18071955.
3. Farella M, Palumbo A, Milani S, Avecone S, Gallo LM, Michelotti A. Synergist coactivation and substitution pattern of the human masseter and temporalis muscles during sustained static contractions. Clin Neurophysiol. 2009;120(1):190-7. http://dx.doi.org/10.1016/j.clinph.2008.10.004. PMid:19026593.
5. Ries LGK, Alves MC, Berzin F. Asymmetric activation of temporalis, masseter, and sternocleidomastoid muscles in temporomandibular disorder patients. Cranio. 2008;26(1):59-64. PMid:18290526.
6. Felício CMD, Mapelli A, Sidequersky FV, Tartaglia GM, Sforza C. Mandibular kinematics and masticatory muscles EMG in patients with short lasting TMD of mild-moderate severity. J Electromyogr Kinesiol. 2013;23(3):627-33. http://dx.doi.org/10.1016/j.jelekin.2013.01.016. PMid:23477915.
7. Liu ZJ, Yamagata K, Kasahara Y, Ito G. Electromyographic examination of jaw muscles in relation to symptoms and occlusion of patients with temporomandibular joint disorders. J Oral Rehabil. 1999;26(1):33-47. http://dx.doi.org/10.1046/j.1365-2842.1999.00356.x. PMid:10080323. 8. Pinho JP, Caldas FM, Mora MJ, Santana-Penin U. Electromyographyc
activity in pacients with temporomandibular disorders. J Oral Rehabil. 2000;27(11):985-90. http://dx.doi.org/10.1046/j.1365-2842.2000.00571.x. PMid:11106990.
9. Bodéré C, Téa SH, Giroux-Metges MA, Woda A. Activity of masticatory muscles in subjects with different orofacial pain conditions. Pain. 2005;116(1-2):33-41. http://dx.doi.org/10.1016/j.pain.2005.03.011. PMid:15927390. 10. Adam A, De Luca CJ. Firing rates of motor units in human vastus
lateralis muscle during fatiguing isometric contractions. J Appl Physiol. 2005;99(1):268-80. http://dx.doi.org/10.1152/japplphysiol.01344.2004. PMid:16036904.
11. Dworkin SF, LeResche L. Research diagnostic criteria for temporomandibular disorders: review, criteria, examinations and specifications, critique. J Craniomandib Disord. 1992;6(4):301-55. PMid:1298767.
12. Sommerich CM, Joines SMB, Hermans V, Moon SD. Use of surface electromyography to estimate neck muscle activity. J Electromyogr Kinesiol. 2000;10(6):377-98. http://dx.doi.org/10.1016/S1050-6411(00)00033-X. PMid:11102841.
13. Ries LGK, Bérzin F. Asymmetric activation of temporalis and masseter muscles in children with cerebral palsy. Fisioter Mov. 2009;22(1):45-52. 14. Hermens HJ, Freriks B, Disselhorst-Klug C, Rau G. Development of
recommendations for SEMG sensors and sensor placement procedures. J Electromyogr Kinesiol. 2000;10(5):361-74. http://dx.doi.org/10.1016/ S1050-6411(00)00027-4. PMid:11018445.
15. Briesemeister M, Schmidt KC, Ries LGK. Changes in masticatory muscle activity in children with cerebral palsy. J Electromyogr Kinesiol. 2013;23(1):260-6. http://dx.doi.org/10.1016/j.jelekin.2012.09.002. PMid:23063911.
16. Willardson JM. A brief review: factors affecting the length of the rest interval between resistance exercise sets. J Strength Cond Res. 2006;20(4):978-84. PMid:17194236.
17. Merletti R, Botter A, Cescon C, Minetto MA, Vieira TM. Advances in surface EMG: recent progress in clinical research applications. Crit Rev Biomed Eng. 2010;38(4):347-79. http://dx.doi.org/10.1615/CritRevBiomedEng. v38.i4.20. PMid:21133838.
18. Maton B, Rendell J, Gentil M, Gay T. Masticatory muscle fatigue: endurance times and spectral changes in the electromyogram during the production of sustained bite forces. Arch Oral Biol. 1992;31(1):521-9. http://dx.doi. org/10.1016/0003-9969(92)90134-T. PMid:1444896.
19. Tarata MT. Mechanomyography versus electromyography, in monitoring the muscular fatigue. Biomed Eng Online. 2003;2(1):3. http://dx.doi. org/10.1186/1475-925X-2-3. PMid:12625837.
20. Bajaj P, Madeleine P, Sjøgaard G, Arendt-Nielsen L. Assessment of Postexercise Muscle Soreness by Electromyography and Mechanomyography. J Pain. 2002;3(2):126-36. http://dx.doi.org/10.1054/jpai.2002.122945. PMid:14622799.
21. Faller L, Nogueira Neto GN, Button VLSN, Nohama P. Avaliação da fadiga muscular pela mecanomiografia durante a aplicação de um protocolo de EENM. Braz J Phys Ther. 2009;13(5):422-9. http://dx.doi.org/10.1590/ S1413-35552009005000057.
22. Sano R, Tanaka E, Korfage JAM, Langenbach GEJ, Kawai N, van Eijden TMGJ, et al. Heterogeneity of fiber characteristics in the rat masseter and digastric muscles. J Anat. 2007;211(4):464-70. PMid:17692082. 23. Laurent D, Portero P, Goubel F, Rossi A. Electromyogram spectrum changes
during sustained contraction related to proton and diprotonated inorganic phosphate accumulation: a 31P nuclear magnetic resonance study on human calf muscles. Eur J Appl Physiol Occup Physiol. 1993;66(3):263-8. http:// dx.doi.org/10.1007/BF00235104. PMid:8386617.
24. Woźniak K, Lipski M, Lichota D, Szyszka-Sommerfeld L. Muscle fatigue in the temporal and masseter muscles in patients with temporomandibular dysfunction. BioMed Res Int. 2015;2015:269734. http://dx.doi. org/10.1155/2015/269734. PMid:25883949.
Author contributions