• Nenhum resultado encontrado

Testing aerosol properties in MODIS Collection 4 and 5 using airborne sunphotometer observations in INTEX-B/MILAGRO

N/A
N/A
Protected

Academic year: 2017

Share "Testing aerosol properties in MODIS Collection 4 and 5 using airborne sunphotometer observations in INTEX-B/MILAGRO"

Copied!
14
0
0

Texto

(1)

www.atmos-chem-phys.net/9/8159/2009/ © Author(s) 2009. This work is distributed under the Creative Commons Attribution 3.0 License.

Chemistry

and Physics

Testing aerosol properties in MODIS Collection 4 and 5 using

airborne sunphotometer observations in INTEX-B/MILAGRO

J. Redemann1, Q. Zhang1, J. Livingston2, P. Russell3, Y. Shinozuka4, A. Clarke5, R. Johnson3, and R. Levy6 1Bay Area Environmental Research Institute, Sonoma, CA, USA

2SRI International, Menlo Park, CA, USA

3NASA Ames Research Center, Moffett Field, CA, USA 4ORAU/ NASA Ames Research Center, Moffett Field, CA, USA 5Univ. of Hawaii, Honolulu, HI, USA

6SSAI/NASA Goddard Space Flight Center, Greenbelt, MD, USA

Received: 31 March 2009 – Published in Atmos. Chem. Phys. Discuss.: 12 May 2009 Revised: 19 September 2009 – Accepted: 22 September 2009 – Published: 2 November 2009

Abstract.The 14-channel Ames Airborne Tracking Sunpho-tometer (AATS) was operated on a Jetstream 31 (J31) air-craft in March 2006 during MILAGRO/INTEX-B (Megac-ity Initiative-Local And Global Research Observations/Phase B of the Intercontinental Chemical Transport Experiment). We compare AATS retrievals of spectral aerosol optical depth (AOD) and related aerosol properties with correspond-ing spatially coincident and temporally near-coincident mea-surements acquired by the MODIS-Aqua and MODIS-Terra satellite sensors. These comparisons are carried out for the older MODIS Collection 4 (C4) and the new Collection 5 (C5) data set, the latter representing a reprocessing of the en-tire MODIS data set completed during 2006 with updated calibration and aerosol retrieval algorithm. Our analysis yields a direct, validated assessment of the differences be-tween select MODIS C4 and C5 aerosol retrievals. Our anal-yses of 37 coincident observations by AATS and MODIS-Terra and 18 coincident observations between AATS and MODIS-Aqua indicate notable differences between MODIS C4 and C5 and between the two sensors. For MODIS-Terra, we find an average increase in AOD of 0.02 at 553 nm and 0.01 or less at the shortwave infrared (SWIR) wavelengths. The change from C4 to C5 results in less good agreement with the AATS derived spectral AOD, with average differ-ences at 553 nm increasing from 0.03 to 0.05. For MODIS-Aqua, we find an average increase in AOD of 0.008 at 553 nm, but an increase of nearly 0.02 at the SWIR wavelengths. The change from C4 to C5 results in slightly less good agree-ment to the AATS derived visible AOD, with average differ-ences at 553 nm increasing from 0.03 to 0.04. However, at

Correspondence to:J. Redemann (jens.redemann-1@nasa.gov)

SWIR wavelengths, the changes from C4 to C5 result in im-proved agreement between MODIS-Aqua and AATS, with the average differences at 2119 nm decreasing from −0.02 to−0.003. Comparing the Angstrom exponents calculated from AOD at 553nm and 855nm, we find an increased rms difference from AATS derived Angstrom exponents in going from C4 to C5 for MODIS-Terra, and a decrease in rms dif-ference, hence an improvement, for the transition from C4 to C5 in MODIS-Aqua. Combining the AATS retrievals with in situ measurements of size-dependent aerosol extinction, we derive a suborbital measure of the aerosol submicron frac-tion (SMF) of AOD and compare it to MODIS retrievals of aerosol fine mode fraction (FMF). Our analysis shows a sig-nificant rms-difference between the MODIS-Terra FMF and suborbitally-derived SMF of 0.17 for both C4 and C5. For MODIS-Aqua, there is a slight improvement in the transition from C4 to C5, with the rms-difference from AATS drop-ping from 0.23 to 0.16. The differences in MODIS C4 and C5 AOD in this limited data set can be traced to changes in the reflectances input to the aerosol retrievals. An exten-sion of the C4-C5 comparisons from the area along the J31 flight track to a larger study region between 18–23◦N and 93–100◦W on each of the J31 flight days supports the find-ing of significant differences between MODIS C4 and C5.

1 Introduction

(2)

1989; Rosenfeld, 1999) involve the modification of cloud properties. The uncertainty in estimates of these aerosol forc-ings depends crucially on the uncertainty of measured and modeled aerosol properties (Schwartz, 2004; McComiskey et al., 2008). The most basic aerosol property that is used to parameterize the direct aerosol radiative forcing of climate is the aerosol optical depth (AOD), defined as the vertical integral of aerosol extinction. Recent studies conducted as part of NASA’s Global Aerosol Climatology Project reveal that the most likely trend in the period of 1991 to 2005 is a decrease in tropospheric AOD of 0.03 (Mishchenko et al., 2007). There is a need to quantify aerosol trends with small enough uncertainty to allow their inclusion in global climate models to evaluate the combined effects of greenhouse-gas induced warming and aerosol-induced cooling or warming of climate. Therefore, it is mandatory to continuously assess the uncertainty of satellite AOD retrievals, especially during major reprocessing of well established satellite data sets.

In this paper, we analyze a set of MODIS aerosol retrievals acquired over the Gulf of Mexico during MILAGRO/INTEX-B (Megacity Initiative-Local And Global Research Observations/Phase B of the Inter-continental Chemical Transport Experiment) in March 2006 (Molina et al., 2009). We track changes in aerosol properties during the transition from the MODIS Col-lection 4 (C4) to the ColCol-lection 5 (C5) data sets (http: //modis-atmos.gsfc.nasa.gov/products C005update.html) and quantitatively compare the MODIS retrievals to mea-surements made by the 14-channel Ames Airborne Tracking Sunphotometer (AATS), which was operated on a Jetstream 31 (J31) aircraft based in Veracruz, Mexico. AATS measured AOD at 13 wavelengths (354–2139 nm) and columnar water vapor (CWV) in 13 flights that sampled clean and polluted airmasses over the Gulf of Mexico and Mexico City. J31 flights were coordinated with overflights of several satellites, including Aqua, Aura, Terra, and Parasol. A companion paper to this study (Livingston et al., 2009) compares AATS measurements to aerosol retrievals from several algorithms applied to observations by the OMI instrument aboard the Aqua satellite.

The first objective of this paper is to compare AATS re-trievals of spectral AOD over dark ocean waters with cor-responding AOD values retrieved from spatially coincident and temporally near-coincident (±30 min of satellite over-pass) measurements acquired by Aqua and MODIS-Terra, both for Collection 4 and Collection 5. In this pro-cess, we compare C4 to C5, and each Collection directly to AATS measurements to assess which Collection showed quantitatively better agreement with AATS. The second ob-jective is to compare MODIS retrievals of aerosol fine mode fraction (FMF), an indicator of the anthropogenic fraction of aerosols, to the sub-micron fraction of aerosol scattering, which can be calculated using a combination of in situ mea-surements of size-segregated aerosol extinction, and AATS-derived Angstrom exponents (see Sect. 3.2 for more details).

2 Measurements

2.1 AATS measurements of spectral aerosol optical

depth

The AATS instrument has been described in detail in sev-eral previous publications (e.g., Russell et al., 2005, 2007; Livingston et al., 2007; and references therein), so we pro-vide only a brief synopsis here. The instrument measures the atmospheric transmission of the direct solar beam in 14 spec-tral channels with center wavelengths,λ, ranging from 354 to 2139 nm and bandwidths of∼5 nm (exceptions are 2.0 nm for the 354-nm channel and 17.3 nm for the 2139-nm chan-nel). Azimuth and elevation motors rotate a tracking head to lock on to the solar beam and maintain detectors normal to it. During MILAGRO/INTEX-B, AATS was mounted on the J31 in the same configuration (Russell et al., 2007) as used during the 2004 INTEX-A/Intercontinental Transport and Chemical Transformation (ITCT) field deployment.

The AATS channel wavelengths have been chosen to per-mit separation of aerosol, water vapor, and ozone transmis-sion along the AATS-to-Sun slant path. Our methods for data acquisition, reduction, calibration, and error analysis have been documented in the literature (Russell et al., 1993a, 1993b; Schmid and Wehrli, 1995; Schmid et al., 1996, 2001, 2003; Livingston et al., 2005, 2007) and are briefly summa-rized here. Spectral AOD is calculated from detector volt-ages measured in 13 channels, with the channels centered at 940 nm and neighboring wavelengths used for calculation of CWV. Calculation of AOD(λ), whereλis the AATS channel center wavelength, and CWV requires knowledge of exoat-mospheric detector voltages, V0(λ). These were calculated

from analysis of sunrise measurements acquired at Mauna Loa Observatory (MLO), Hawaii, before (January 2006) and after (May 2006) the MILAGRO deployment and, following the procedure described in Schmid et al. (2003), by analy-sis of high altitude clear air AOD spectra obtained during the deployment. Specifically, the V0values were derived

us-ing the Langley plot technique (e.g., Russell et al., 1993a, 1993b; Schmid and Wehrli, 1995) for all channels except 940 nm, for which a modified Langley technique (Reagan et al., 1995; Michalsky et al., 1995; Schmid et al., 1996, 2001) was employed to account for water vapor absorption. Analy-sis of the high altitude AOD spectra involved calculating the best-fit second order polynomial of log(AOD(λ))vs. log(λ) to ensure positive values of AOD(λ) and a “smooth” vari-ation with wavelength. The residuals between the AOD(λ) calculated from the best fit polynomial and the AOD(λ) cal-culated from the MLO V0values were then used to calculate

small correction factors to be applied to the MLO V0

val-ues. In fact, the mean V0values derived from the pre- and

(3)

of the good agreement between the two MLO data sets for most channels, we decided to apply the results of the high al-titude AOD spectral fits to the pre-MILAGRO (January 2006 MLO) values of V0and use these adjusted values in the

anal-ysis of the MILAGRO data. The statistical component of the uncertainty in V0was set equal to 50% of the mean

differ-ence between the January and May MLO results.

2.2 MODIS retrievals of aerosol optical depth

The MODIS over-ocean algorithm for the retrieval of AOD has been described in detail in Remer et al. (2005). This algo-rithm aggregates reflectances from the six channels between 553 and 2119 nm into the nominal 10 by 10 km2 retrieval grid boxes each composed of 20 by 20 pixels at 500 m reso-lution. The algorithm uses the difference in spatial variability of aerosols and clouds to identify the cloud-free pixels that are suitable for subsequent inclusion in the aerosol retrieval (Martins et al., 2002). Specifically, the standard deviation of 553-nm reflectances of a square set of 3 by 3 500-m pix-els is compared to a threshold value of 0.0025. By default, all pixels are set to “cloudy”. If the standard deviation of the reflectances in the nine 500-m pixels is smaller than the threshold value, the center pixel is declared “not cloudy” and the set of 3×3 pixels is moved in such a way that a pixel neighboring the previous center pixel becomes the new cen-ter pixel. The result is a cloud mask at an effective resolution of 500 m. This test separates aerosol from most cloud types, but may fail for large, thick clouds and for cirrus, which can be spatially homogeneous. The fraction of “cloudy” 500 by 500 m2 pixels within the 10 by 10 km2 pixel is archived in the level-2 data file for each large pixel for which an AOD is retrieved. It may also erroneously identify inhomogeneous aerosol fields as clouds. After the application of various cloud masks and a residual underwater sediment mask (Li et al., 2003), the brightest 25% and darkest 25% (at 855 nm) of the remaining pixels are discarded, in principle to remove any other surface inhomogeneities and cloud contamination. The reflectances in the remaining pixels are averaged and com-pared to a look-up table consisting of simulated reflectances for four fine and five coarse mode aerosol types, for vari-ous viewing geometries and aerosol loadings (Remer et al., 2005). All combinations of fine and coarse mode pairs that fit the measured reflectances to within 3% (or the best three combinations if no solution fits the reflectances to within 3%) are averaged to yield the average combination of fine and coarse mode aerosol and the corresponding spectral AOD at 466, 553, 644, 855, 1243, 1632 and 2119 nm.

During 2006, a complete reprocessing of all avail-able MODIS data produced the MODIS Collection 5 (C5) data set. The main differences between the previ-ous Collection 4 and the resulting Collection 5 are de-scribed at http://modis-atmos.gsfc.nasa.gov/C005 Changes/ C005 Aerosol 5.2.pdf. Major changes were made to the over-land aerosol algorithm and products. Over the ocean,

only minor changes were implemented, specifically a small change in the refractive indices of 3 of the 5 coarse aerosol modes. Initial tests, using C4 input reflectance data, sug-gested that the refractive index changes would not signifi-cantly affect regional mean AOD. However, in addition to the changes within the C5 aerosol retrieval algorithm, there were also changes between C4 and C5 in the calibration of the MODIS bands that the aerosol algorithm uses as input for its retrievals.

2.3 MODIS retrievals of aerosol fine mode fraction and

in situ measurements of the relationship between Angstrom exponent and aerosol submicron fraction of extinction

To derive an estimate of the anthropogenic portion of aerosol radiative forcing of climate an estimate of the anthropogenic contribution to the atmospheric aerosol burden is needed (Kaufman et al., 2002). MODIS provides an estimate of that contribution in the form of the aerosol fine-mode frac-tion (FMF) which is defined as the ratio of AOD from the fine-mode to the total (fine-mode plus coarse-mode) AOD at 553 nm, viz.:

FMF= AODfine

AODfine+AODcoarse

(1) The underlying assumption in the use of FMF as a mea-sure of the anthropogenic fraction of total aerosol loading is that the AOD in the fine mode is due solely to combustion-generated aerosol species, while the AOD in the coarse mode is due only to mechanically-generated, natural aerosols. We expect this assumption to be true of most aerosol contributing to extinction in the INTEX-B/MILAGRO domain with the exception of rarely encountered volcanic sources and some clean air regions that tend to have very low relative contri-butions to AOD. Testing the retrievals of MODIS FMF is complicated by at least two factors. First, there are only a few methods to evaluate the MODIS FMF. One such method is the use of AERONET observations, either from the inver-sion of sky-radiance measurements (Kleidman et al., 2005) or from the spectral deconvolution method (O’Neill et al., 2003), although neither method has itself been compared to in situ measurements. Another method introduced by Ander-son et al. (2005) uses in situ observations of the sub-micron fraction (SMFE) of aerosol extinction, i.e., the fraction of extinction that is due to particles of aerodynamic diameters less than one micrometer, in vertical aircraft profiles. These in situ measurements can be used to derive a functional re-lationship between the extinction Angstrom exponent and SMFE which is subsequently applied to sunphotometer-derived Angstrom exponents to derive full column measures of the aerosol sub-micron fraction of AOD, SMF:

SMF=AODD<1µm

AODtotal

(4)

Longitude

Latitude

Aerosol optical depth,MODIS,Terra,069,03/10/06,UT:16:50−−16:55

100oW 98oW 96oW 94oW

18oN 20oN 22oN

0 0.05 0.1 0.15 0.2 0.25 0.3 0.35 0.4 0.45 0.5

Fig. 1. Example of a J31 flight track on 10 March 2006, that was overlain on a MODIS 553nm AOD retrieval map. The AOD retrievals themselves overlie an RGB image produced from radiances measured in MODIS bands 1, 3 and 4.

A significant complication in testing FMF with SMF stems from the overlap in the particle size ranges of the MODIS fine and coarse mode lognormal models, which means that sub-orbital measurements of size-segregated aerosol extinction cannot unambiguously determine whether particles above or below a certain size cut-off contributed to the extinction of the fine or coarse mode aerosol (Anderson et al., 2005). In fact, the difference in definition between FMF and SMF alone may result in differences of 0.1 or more for a given Angstrom exponent as pointed out by Anderson et al. (2005). Because the J31 aircraft that carried AATS-14 in INTEX-B/MILAGRO was not equipped with in situ instrumentation, we use the approach devised by Anderson et al. (2005) to derive a suborbital measure of SMF. This approach requires a functional relationship between SMFE and the aerosol Angstrom exponent, defined for aerosol extinction as:

α(λ1,λ2)= −

ln(ext (λ1)/ext (λ2))

ln(λ1/λ2)

. (3)

We then apply this functional relationship to the Angstrom exponent calculated from AATS-14 AOD measurements, thereby deriving SMF for all AATS-14 full column AOD ob-servations.

The in situ measurements used here to determine the re-lationship between α and SMFE were taken with neph-elometers and particle soot absorption photometers (PSAP) aboard the NASA DC-8 research aircraft during INTEX-B/MILAGRO. For details see Sect. 3.2 of McNaughton et

(5)

3 Results

3.1 Spectral AOD comparisons

All suborbital measurements considered in this paper for the validation of MODIS aerosol retrievals were taken within

±30 min of satellite overpass time at aircraft altitudes below 80 m (usually at altitudes of 30–40 m). As an example, Fig. 1 shows the J31 flight track on 10 March 2006, overlain onto a MODIS 553nm AOD retrieval map. The AOD retrievals are themselves overlain on top of an RGB image produced from radiances measured in MODIS bands 1, 3 and 4. In this sec-tion, we present comparisons between MODIS and AATS aerosol measurements for a total of 37 coincident observa-tions with MODIS-Terra on 5, 10 and 12 March 2006 and a total of 18 coincident observations with MODIS-Aqua on 10 and 17 March 2006. Within each of the 10×10 km2MODIS aerosol retrieval boxes, the AATS measurements of AOD were averaged to yield a spectrum, which was then fitted with a quadratic least-square fit of log(AOD) versus log(λ). From the AATS-fit, the AOD at the intermediate MODIS wavelengths of 466, 553, 644, 855, 1243, 1632 and 2119 nm was determined. Although some MODIS wavelengths are represented within the AATS-14 spectrum, the fit procedure above was used to minimize the impact of possible AATS-14 single-channel contamination, calibration uncertainties, and uncertainties stemming from gaseous absorption at the near-IR wavelengths. For the AATS-MODIS comparisons in this paper we only use MODIS aerosol retrievals for which the MODIS Aerosol Estimated Quality flag, also called Quality Confidence (QC) flag, indicated “successful” AOD retrievals with values of QC≥1. “Successful” in this context means that the AOD values are recommended for quantitative sci-entific use.

Figure 2 shows scatter plots of MODIS-Terra (2a–d) and MODIS-Aqua (2e–h) versus AATS-derived AOD. Uncer-tainty range estimates of±(0.03+0.05 AOD), i.e., the combi-nation of an absolute error of 0.03 plus a relative error equal to 5% of the total MODIS-derived AOD are given as blue lines (Remer et al., 2005, 2008). The left hand plots show the comparisons between AATS and MODIS C4, while the right hand plots show comparisons between AATS and MODIS C5. The scatter plots are broken down into “visible” wave-lengths (i.e., 466 nm, 553 nm, 644 nm and 855 nm, in pan-els 2a,b,e,f) and SWIR wavelengths (i.e., 1243 nm, 1632 nm and 2119 nm, in panels 2c,d,g,h). The transition from C4 to C5 results in larger rms differences between AATS and MODIS for MODIS-Terra, and only small changes in rms differences between AATS and MODIS for MODIS-Aqua. Columns 2 and 3 of Table 1 summarize the mean difference between AATS and C4, and AATS and C5, respectively, for each of the seven MODIS wavelengths. The comparison re-veals that in the case of MODIS-Terra the transition from C4 to C5 results in differences from AATS that increase by up to 0.02 in the visible bands and by up to 0.01 in the SWIR

bands. For MODIS-Aqua, the transition from C4 to C5 re-sults in only small increases in the differences to AATS in the visible bands. In the SWIR bands, the differences from AATS generally decrease, indicating improved retrievals at these wavelengths. Figure 3 shows these results as differ-ence plots as a function of the MODIS measured reflectances. These reflectances are the averages of the 500×500 m2 pix-els that remained after the cloud and sediment masks, as well as the pixel reduction were applied. In Fig. 3, open squares denote the differences between MODIS and AATS-derived AOD for C5, while the solid circles show the difference be-tween AATS and MODIS for C4. Figure 3 supports the gen-eral conclusion that with the exception of the MODIS-Aqua SWIR bands, the transition from C4 to C5 results in less good agreement between AATS and MODIS AOD retrievals.

Figure 4 and column 5 of Table 1 provide a direct compar-ison between C4 and C5 for all MODIS AOD retrievals con-sidered here. Figure 4a shows that for MODIS-Terra there is an increase in AOD of about 0.02 at all wavelengths up to 1243 nm, with slightly smaller absolute differences (al-beit larger relative differences, see Fig. 4b) in the 1632 and 2119 nm AOD. For MODIS-Aqua, there is only a small dif-ference of about 0.005 between C4 and C5 in the AOD at 466 nm, but this difference increases to about 0.02 in the SWIR bands, resulting in better agreement with AATS at those wavelengths as noted above.

(6)

0 0.05 0.1 0.15 0.2 0.25 0.3 0.35 0 0.05 0.1 0.15 0.2 0.25 0.3

0.35 MODIS Collection 4

n= 148 r2 = 0.934 y = 1.129 x + 0.008 rms= 0.032, 23.7 %

MODIS-Terra AOD 466nm

553nm 644nm 855nm

0 0.05 0.1 0.15

0 0.02 0.04 0.06 0.08 0.1 0.12 0.14 0.16 n= 111 r2 = 0.836 y = 1.315 x +-0.011 rms= 0.018, 27.1 %

MODIS-Terra AOD

1243nm 1632nm 2119nm

0 0.05 0.1 0.15 0.2 0.25 0.3 0.35 0 0.05 0.1 0.15 0.2 0.25 0.3

0.35 MODIS Collection 5

n= 156 r2 = 0.935 y = 1.176 x + 0.023 rms= 0.052, 37.7 %

466nm 553nm 644nm 855nm

0 0.05 0.1 0.15

0 0.02 0.04 0.06 0.08 0.1 0.12 0.14 0.16 n= 117 r2 = 0.832 y = 1.629 x +-0.023 rms= 0.031, 44.4 %

1243nm 1632nm 2119nm

0 0.05 0.1 0.15 0.2 0.25 0.3 0.35 0 0.05 0.1 0.15 0.2 0.25 0.3 0.35 n= 72 r2 = 0.931 y = 1.172 x + 0.005 rms= 0.030, 17.4 %

MODIS-Aqua AOD

466nm 553nm 644nm 855nm

0 0.05 0.1 0.15

0 0.02 0.04 0.06 0.08 0.1 0.12 0.14 0.16 n= 54 r2 = 0.481 y = 1.270 x +-0.034 rms= 0.018, 24.2 %

AATS-14 AOD

MODIS-Aqua AOD

1243nm 1632nm 2119nm

0 0.05 0.1 0.15 0.2 0.25 0.3 0.35 0 0.05 0.1 0.15 0.2 0.25 0.3 0.35 n= 72 r2 = 0.920 y = 1.080 x + 0.020 rms= 0.037, 22.0 %

466nm 553nm 644nm 855nm

0 0.05 0.1 0.15

0 0.02 0.04 0.06 0.08 0.1 0.12 0.14 0.16 n= 54 r2 = 0.273 y = 1.344 x +- 0.021 rms= 0.019, 26.0 %

AATS-14 AOD 1243nm 1632nm 2119nm (a) (b) (c) (d) (e) (f) (g) (h)

Fig. 2. (a)Scatter plot comparison of MODIS-Terra Collection 4 (C4) derived visible AOD (466 nm, 553 nm, 644 nm and 855 nm) to AATS-14 derived values. (b)Same as (a), but for C5. (c)+(d)Same as (a) (b), but for the SWIR bands (i.e., 1243 nm, 1632 nm and 2119 nm).

(7)

Table 1.Comparison of MODIS Collection 4 and Collection 5 AOD retrievals to AATS measurements (columns 2 and 3) and to each other (column 5). Column 4 shows the difference in reflectances between C4 and C5. Column 5 shows the difference in AOD between C4 and C5. Results are the mean of the differences of all retrieval pairs (37 MODIS-Terra and 18 MODIS-Aqua cases) considered. Numbers in parentheses are changes in percent.

Wavelength 1AOD, C4-AATS 1AOD, C5-AATS 1ρ, C5-C4 1AOD, C5-C4 [nm]

MODIS-Terra N=37

466 0.0259(14.80) 0.0439(26.98) 0.0031(2.00) 0.0181(10.96) 553 0.0292(20.87) 0.0493(36.71) 0.0016(1.77) 0.0201(13.46) 644 0.0276(23.32) 0.0482(41.75) 0.0002(0.38) 0.0206(15.29) 855 0.0206(21.95) 0.0402(43.12) 0.0003(1.28) 0.0196(17.53) 1243 0.0141(17.35) 0.0288(35.26) −0.0021(−13.72) 0.0147(14.68) 1632 0.0111(13.85) 0.0204(24.46) −0.0007(−7.51) 0.0093(8.17) 2119 0.0050(4.55) 0.0084(6.29) −0.0013(−17.60) 0.0034(0.02) MODIS-Aqua N=18

466 0.0318(13.73) 0.0365(15.78) 0.0007(0.52) 0.0046(1.87) 553 0.0313(17.16) 0.0393(21.67) 0.0003(0.34) 0.0081(3.93) 644 0.0244(16.29) 0.0354(23.69) 0.0001(0.23) 0.0109(6.45) 855 0.0081(7.36) 0.0237(21.54) 0.0001(0.24) 0.0156(13.21) 1243 −0.0074(−8.96) 0.0118(14.49) 0.0001(0.38) 0.0193(25.40) 1632 −0.0136(−18.57) 0.0054(7.72) 0.0001(0.50) 0.0190(31.54) 2119 −0.0205(−29.83) −0.0035(−4.84) 0.0000(0.31) 0.0170(34.59)

Table 2. Comparison of MODIS C4 and C5. Column 2 and 3 are the same as column 4 and 5 of Table 1 and are given here for easy comparison to the results in columns 4 and 5, which show the results on the same days as the J31 flight days, but for the extended area of 18–23◦N and 93–100◦W, i.e., the area that is covered by the retrieval map in Fig. 1.

Wavelength 1ρ, C5-C4, 1AOD, C5-C4, 1ρ, C5-C4, 1AOD, C5-C4, [nm] along J31 track along J31 track extended region extended region

MODIS-Terra N=37 N=2997

466 0.0031(2.00) 0.0181(10.96) 0.0030(1.97) 0.0230(9.33) 553 0.0016(1.77) 0.0201(13.46) 0.0015(1.67) 0.0267(11.94) 644 0.0002(0.38) 0.0206(15.29) 0.0003(0.45) 0.0288(14.22) 855 0.0003(1.28) 0.0196(17.53) 0.0005(1.49) 0.0318(18.82) 1243 −0.0021(−13.72) 0.0147(14.68) −0.0019(−9.50) 0.0316(22.19) 1632 −0.0007(−7.51) 0.0093(8.17) −0.0005(−3.86) 0.0272(19.88) 2119 −0.0013(−17.60) 0.0034(0.02) −0.0012(−11.77) 0.0203(14.80)

MODIS-Aqua N=18 N=2155

466 0.0007(0.52) 0.0046(1.87) 0.0008(0.53) −0.0045(−1.12) 553 0.0003(0.34) 0.0081(3.93) 0.0003(0.37) 0.0015(0.93) 644 0.0001(0.23) 0.0109(6.45) 0.0001(0.22) 0.0067(3.46) 855 0.0001(0.24) 0.0156(13.21) 0.0001(0.30) 0.0156(10.43) 1243 0.0001(0.38) 0.0193(25.40) 0.0001(0.55) 0.0227(21.76) 1632 0.0001(0.50) 0.0190(31.54) 0.0001(0.70) 0.0236(27.64) 2119 0.0000(0.31) 0.0170(34.59) 0.0001(0.68) 0.0214(30.42)

the total AOD, between C4 and C5 shown in Fig. 7d, also discussed below. Investigating possible reasons for the dif-ferences in the input reflectances to the MODIS aerosol re-trievals, we looked for differences in the cloud fractions as derived within the context of the aerosol retrievals for C4 and C5. While we found significant differences in the cloud

frac-tions between C4 and C5, we found no correlation between the differences in cloud fractions and the differences in the input reflectances.

(8)

0 0.02 0.04 0.06 0.08 0.1 0.12 0.14 0.16 0.18 -0.04

-0.02 0 0.02 0.04 0.06 0.08 0.1

Terra

AATS

-14 AOD

466nm, C004 553nm, C004 644nm, C004 855nm, C004 1243nm, C004 1632nm, C004 2119nm, C004

0 0.02 0.04 0.06 0.08 0.1 0.12 0.14 0.16 0.18

-50 0 50 100

Terra C004 reflectance

Terra

AATS

-14 AOD [%]

466nm, C005 553nm, C005 644nm, C005 855nm, C005 1243nm, C005 1632nm, C005 2119nm, C005

0 0.02 0.04 0.06 0.08 0.1 0.12 0.14 0.16 0.18

-0.04 -0.02 0 0.02 0.04 0.06 0.08 0.1

Aqua

AATS

14

AOD

466nm, C004 553nm, C004 644nm, C004 855nm, C004 1243nm, C004 1632nm, C004 2119nm, C004

0 0.02 0.04 0.06 0.08 0.1 0.12 0.14 0.16 0.18

-50 0 50 100

Aqua C004 reflectance

Aqua

AATS

-14 AOD [%]

466nm, C005 553nm, C005 644nm, C005 855nm, C005 1243nm, C005 1632nm, C005 2119nm, C005

(d) (a)

(b)

(c)

Fig. 3. (a)Absolute difference in spectral AOD between MODIS-Terra C4 and 14 (solid circles) and MODIS-Terra C5 and AATS-14 (open squares) as a function of mean reflectance at 553nm. (b)same as a), but given as a relative difference. (c)same as (a) but for MODIS-Aqua.(d)same as (b), but for MODIS-Aqua.

traceable validation instrument (AATS) over dark ocean wa-ter, arguably the easiest background for satellite aerosol re-trievals. To increase our confidence in the C4-C5 comparison results summarized in Table 1, we extended the comparisons to the entire region bounded by 18–23◦N and 93–100◦W (i.e., the area that is covered by the retrieval map in Fig. 1) on each of the five study days (three for Terra and two for Aqua) under the assumption that cross-validation with AATS in the entire area would result in the same results as it did in the limited number of case studies along the J31 flight track. In Table 2, columns 2 and 3, we reproduced the results of Ta-ble 1, columns 4 and 5, for comparison to the results for the entire region, which covers a total of 2997 valid MOD04 L2

(9)

0 0.02 0.04 0.06 0.08 0.1 0.12 0.14 0.16 0.18 -0.01

0 0.01 0.02 0.03 0.04 0.05 0.06

Terra C005 -

C004 AOD

466nm 553nm 644nm 855nm 1243nm 1632nm 2119nm

0 0.02 0.04 0.06 0.08 0.1 0.12 0.14 0.16 0.18

-30 -20 -10 0 10 20 30 40 50 60 70 80

Terra C004 reflectance

Terra C005 -

C004 AOD [%]

466nm 553nm 644nm 855nm 1243nm 1632nm 2119nm

0 0.02 0.04 0.06 0.08 0.1 0.12 0.14 0.16 0.18

-0.01 0 0.01 0.02 0.03 0.04 0.05 0.06

Aqua C005 -

C004 AOD

466nm 553nm 644nm 855nm 1243nm 1632nm 2119nm

0 0.02 0.04 0.06 0.08 0.1 0.12 0.14 0.16 0.18

-30 -20 -10 0 10 20 30 40 50 60 70 80

Aqua C004 reflectance

Aqua C005 -

C004 AOD [%]

466nm 553nm 644nm 855nm 1243nm 1632nm 2119nm (a)

(b)

(c)

(d)

Fig. 4. (a)Absolute difference in spectral AOD between C4 and C5 for MODIS-Terra as a function of mean reflectance at 553 nm.(b)same as (a), but given as a relative difference.(c)same as (a) but for MODIS-Aqua.(d)same as (b), but for MODIS-Aqua.

between C4 and C5 in closer proximity to clouds. In gen-eral, our extension of the C4-C5 comparisons from the area along the J31 flight track to the larger study region supports the findings of significant differences between MODIS C4 and C5, with the differences resulting in worse agreement with AATS for MODIS-Terra and better agreement in SWIR AOD for MODIS-Aqua.

3.2 MODIS FMF versus suborbital SMF observations

Similar to the analysis by Anderson et al. (2005), we at-tempt here to test the MODIS retrievals of aerosol fine mode fraction, FMF, using a combination of AATS measurements of the aerosol Angstrom exponent with in situ

(10)

0 0.02 0.04 0.06 0.08 0.1 0.12 0.14 0.16 0.18 -5

-2.5 0 2.5

5x 10

-3

Terra C005 -

C004 reflectance

466nm 553nm 644nm 855nm 1243nm 1632nm 2119nm

0 0.02 0.04 0.06 0.08 0.1 0.12 0.14 0.16 0.18

-40 -30 -20 -10 0 10

Terra C004 reflectance

Terra C005 -

C004 reflectance [%]

466nm 553nm 644nm 855nm 1243nm 1632nm 2119nm

0 0.02 0.04 0.06 0.08 0.1 0.12 0.14 0.16 0.18

-5 -2.5 0 2.5

5x 10

-3

Aqua C005

C004 reflectance

466nm 553nm 644nm 855nm 1243nm 1632nm 2119nm

0 0.02 0.04 0.06 0.08 0.1 0.12 0.14 0.16 0.18

-40 -30 -20 -10 0 10

Aqua C004 reflectance

Aqua C005

C004 reflectance [%]

466nm 553nm 644nm 855nm 1243nm 1632nm 2119nm (a)

(b)

(c)

(d)

Fig. 5. (a)Absolute difference in spectral mean reflectances between C4 and C5 used as input for MODIS-Terra aerosol retrievals, as a function of mean reflectance at 553 nm.(b)same as (a), but given as a relative difference.(c)same as (a) but for MODIS-Aqua.(d)same as (b), but for MODIS-Aqua.

Using the INTEX-B in situ observations aboard the DC-8 in the Gulf of Mexico described in Sect. 2.3, we found the functional relationship shown as a solid red line in Fig. 6b between SMFE and the aerosol extinction Angstrom expo-nent,α:

SMFE=0.0075α2+0.3106α+0.2244 (4) We found further that one standard deviation of all SMFE/αpairs were bounded by the range given by

SMFElow=0.0075α2+0.3106α+0.1524 (5a)

SMFEhigh=0.0075α2+0.3106α+0.2827 (5b)

effectively providing an uncertainty in SMFE of the order of 0.065. For comparison, the functional relationship found by

Anderson et al. [2005] in ACE-Asia plotted as green lines in Fig. 6a and 6b was:

SMFE= −0.0512α2+0.5089α+0.02 (6) A comparison of Eq. (4) and Eq. (6) reveals that for Angstrom exponents greater than 0.9, the fits agree with each other within the uncertainty range established by Eq. (5).

(11)

ACE−Asia Fit (Anderson et al.)

Ambient RH (%)

0 20 40 60 80 100

−0.50 0 0.5 1 1.5 2 0.2

0.4 0.6 0.8 1

SMFE

INTEX−B

Extinction Angstrom Exponent

−0.50 0 0.5 1 1.5 2 0.2

0.4 0.6 0.8 1

SMFE

INTEX−B Gulf of Mexico

Extinction Angstrom Exponent

Fig. 6. In situ observations of SMFE and extinction Angstrom exponent from all INTEX-B observations (left plot) and only for the flight segments over the Gulf of Mexico (right plot). The functional relationship given in Eq. (4) is shown as a solid red line, and the one-sigma standard deviation of all observations is shown by the red dashed lines. For comparison, the fit derived by Anderson et al. (2005) for data collected in ACE-Asia is shown as a green solid line.

0.5 1 1.5

0.5 1 1.5

C004

r2 = 0.083

rms = 0.118, 11.4 %

C005 r2 = 0.000

rms = 0.218, 21.1 %

AATS

α

MODIS - Terra

α

C004 α (553 - 855nm) C005 α (553 - 855nm)

0.4 0.5 0.6 0.7 0.8 0.9

0.4 0.5 0.6 0.7 0.8 0.9

MODIS

-Terra FMF

AATS+in situ SMF

C004

r2 = 0.177

rms = 0.168, 30.3 %

C005 r2 = 0.020

rms = 0.185, 33.3 % C004 FMF C005 FMF

0.5 1 1.5

0.5 1 1.5

C004

r2 = 0.630

rms = 0.191, 16.6 %

C005 r2 = 0.396

rms = 0.119, 10.3 %

AATS

α

MODIS - Aqua

α

0.4 0.5 0.6 0.7 0.8 0.9

0.4 0.5 0.6 0.7 0.8 0.9

MODIS

-Aqua FMF

AATS+in situ SMF

C004

r2 = 0.573

rms = 0.232, 39.2 %

C005 r2 = 0.126

rms = 0.160, 27.0 % C004 FMF C005 FMF

(a) (b)

(c) (d)

C004 α (553 - 855nm) C005 α (553 - 855nm)

Fig. 7. (a)Comparison of MODIS-Terra and AATS-14 derived AOD Angstrom exponent for C4 (blue circles) and C5 (red circles).(b)Same as (a), but for the MODIS-Terra derived fine mode fraction, FMF, versus the AATS + in situ derived sub-micron fraction of AOD (see text).

(c)(d)same as (a)–(b), but for MODIS-Aqua.

MODIS-Terra (Fig. 7a) and MODIS-Aqua (Fig. 7c), respec-tively. In the case of MODIS-Terra, the rms-difference to the AATS retrievals increased between C4 and C5, while in the case of MODIS-Aqua, the rms-difference to the AATS

results decreased, indicating again an improvement between C4 and C5 for MODIS-Aqua.

(12)

SMF values plotted as ordinates in Fig. 7b and 7d for MODIS-Terra and MODIS-Aqua, respectively. In the case of MODIS-Terra, the rms-difference between MODIS FMF and suborbital SMF shows no significant change between C4 and C5. Similar to the Angstrom exponent analysis, for MODIS-Aqua, the FMF/SMF comparison shows significant improve-ment in going from C4 to C5, with the rms-difference re-duced from 0.23 to 0.16. However, both the Terra and Aqua C5 retrievals of FMF show a consistent high-bias when com-pared to the suborbital SMF results.

4 Conclusions

In this paper we compare AATS retrievals of spectral aerosol optical depth (AOD) and derived aerosol properties with corresponding spatially coincident and temporally near-coincident measurements acquired by the MODIS-Aqua and MODIS-Terra satellite sensors. These comparisons are car-ried out for the older MODIS Collection 4 (C4) and the new Collection 5 (C5) data set, the latter representing a re-processing of the entire MODIS data set completed during 2006. They allow us a direct, validated assessment of the differences between select MODIS C4 and C5 aerosol re-trievals. Our analyses indicate notable differences between MODIS C4 and C5. For MODIS-Terra, we find an average increase in AOD of 0.02 at 553 nm and 0.01 or less at the SWIR wavelengths. The change from C4 to C5 results in less good agreement to the AATS derived visible AOD, with average differences at 553 nm increasing from 0.03 to 0.05. For MODIS-Aqua, we find an average increase in AOD of 0.008 at 553 nm, but an increase of nearly 0.02 at the SWIR wavelengths. The change from C4 to C5 results in slightly less good agreement with the AATS derived spectral AOD, with average differences at 553 nm increasing from 0.03 to 0.04. However, at SWIR wavelengths, the changes from C4 to C5 result in improved agreement between MODIS and AATS, with the average differences at 2119 nm decreasing from−0.02 to −0.003. Our findings generally agree with the results presented by Remer et al. (2008), who found a mean increase in MODIS-Terra over-ocean AOD at 550 nm of 0.015 between C4 and C5 and no significant differences for MODIS-Aqua over-ocean AOD, although our results in-dicate even larger differences between MODIS-Terra C4 and C5 AOD.

We note that our previous work (Redemann et al., 2006) with MODIS-Aqua AOD retrievals at SWIR wavelengths had indicated notable underestimates of MODIS AOD when compared to AATS measurements and that the increase in AOD between C4 and C5 found here would have improved the comparisons between AATS and MODIS-Aqua consid-ered in that paper.

Comparing the Angstrom exponents calculated from AOD at 553 nm and 855 nm, we find an increased rms difference from AATS derived Angstrom exponents in going from C4 to

C5 for MODIS-Terra. Conversely, we find a decrease in rms difference and hence an improvement for the transition from C4 to C5 in MODIS-Aqua. Combining the AATS retrievals with in situ measurements of size-dependent aerosol extinc-tion, we derive a suborbital measure of the aerosol submicron fraction (SMF) of AOD and compare it to MODIS retrievals of aerosol fine mode fraction (FMF). Our analysis indicates a significant rms-difference between the MODIS-Terra FMF and AATS-derived SMF of 0.17 for both C4 and C5. For MODIS-Aqua, there is a slight improvement in the transition from C4 to C5, with the rms-difference to AATS dropping from 0.23 to 0.16.

The differences in MODIS C4 and C5 AOD in this limited data set can be traced to changes in the mean reflectances that serve as input to the MODIS aerosol retrievals. We in-vestigated possible reasons for these differences by looking for differences in the cloud fractions as derived within the context of the aerosol retrievals for MODIS C4 and C5. Al-though we found significant differences in the cloud fractions between C4 and C5, we found no correlation between the differences in cloud fractions and the differences in the input reflectances. An extension of the C4-C5 comparisons from the region along the J31 flight track to a larger study region between 18–23◦N and 93–100◦W on each of the J31 flight days supports the findings of significant differences between MODIS C4 and C5, both in terms of reflectances as well as spectral AOD.

Acknowledgements. The MILAGRO/INTEX-B Campaign is a

col-laborative effort of a large number of participants with the support of multi-national agencies. The MILAGRO/INTEX-B participants would like to thank the governments of the Federal District, the States of Mexico, Hidalgo and Veracruz, the Mexican Ministries of the Environment, Foreign Relations, Defense and Finance for their logistical support; IMP, U-Tec´amac, and Rancho La Bisnega for hosting the supersites as well as many other Mexican institutions for their support. We thank all INTEX-B/MILAGRO participants and sponsoring agencies for making this research possible. J31 measurements were supported by the NASA Radiation Science Program.

Edited by: S. Madronich

References

Ackerman, A. S., Toon, O. B., Stevens, D. E., Heyms-field, A. J., Ramanathan, V., and Welton, E. J.: Reduc-tion of tropical cloudiness by soot, Science, 288, 1042–1047, doi:10.1126/science.288.5468.1042, 2000.

Albrecht, B. A.: Aerosols, cloud microphysics, and fractional cloudiness, Science, 245, 1227–1230, 1989.

Anderson, T. L., Wu, Y., Chu, D. A., Schmid, B., Redemann, J., and Dubovik, O.: Testing the MODIS satellite retrieval of aerosol fine-mode fraction, J. Geophys. Res., 110, D18204, doi:10.1029/2005JD005978, 2005.

(13)

Kleidman, R. G., O’Neill, N. T., Remer, L. A., Kaufman, Y. J., Eck, T. F., Tanre’, D., Dubovik, O., and Holben, B. N.: Comparison of Moderate Resolution Imaging Spectroradiometer (MODIS) and Aerosol Robotic Network (AERONET) remote-sensing re-trievals of aerosol fine mode fraction over ocean, J. Geophys. Res., 110, D22205, doi:10.1029/2005JD005760, 2005.

Li, R.-R., Kaufman, Y. J., Gao, B.-C., and Davis, C. O.: Re-mote sensing of suspended sediments and shallow coastal waters, IEEE T. Geosci. Remote Sens., 41, 559–566, 2003.

Livingston, J., Schmid, B., Russell, P. B., Eilers, J. A., Kolyer, R. W., Redemann, J., Ramirez, S. A., Yee, J.-H., Swartz, W. H., Trepte, C. R., Thomason, L. W., Pitts, M. C., Avery, M. A., Randall, C. E., Lumpe, J. D., Bevilacqua, R. M., Bittner, M., Erbertseder, T., McPeters, R. D., Shetter, R. E., Browell, E. V., Kerr, J. B., and Lamb, K.: Retrieval of ozone column content from airborne Sun photometer measurements during SOLVE II: Comparison with coincident satellite and aircraft measurements, Atmos. Chem. Phys., 5, 2035–2054, 2005,

http://www.atmos-chem-phys.net/5/2035/2005/.

Livingston, J. M., Schmid, B., Redemann, J., Russell, P. B., Ramirez, S. A., Eilers, J., Gore, W., Howard, S., Pommier, J., Fetzer, E. J., Seemann, S. W., Borbas, E., Wolfe, D. E., and Thompson, A. M.: Comparison of water vapor measurements by airborne Sun photometer and near-coincident in situ and satel-lite sensors during INTEX/ITCT 2004, J. Geophys. Res., 112, D12S16, doi:10.1029/2006JD007733, 2007.

ivingston, J. M., Redemann, J., Russell, P. B., Torres, O., Vei-helmann, B., Veefkind, P., Braak, R., Smirnov, A., Remer, L., Bergstrom, R. W., Coddington, O., Schmidt, K. S., Pilewskie, P., Johnson, R., and Zhang, Q.: Comparison of aerosol op-tical depths from the Ozone Monitoring Instrument (OMI) on Aura with results from airborne sunphotometry, other space and ground measurements during MILAGRO/INTEX-B, Atmos. Chem. Phys., 9, 6743–6765, 2009,

http://www.atmos-chem-phys.net/9/6743/2009/.

Martins, J. V., Tanr´e, D., Remer, L., Kaufman, Y., Mattoo, S., and Levy, R.: MODIS cloud screening for remote sensing of aerosols over oceans using spatial variability, Geophys. Res. Lett., 29 (12), 8009, doi:10.1029/2001GL013252, 2002.

McComiskey, A., Schwartz, S. E., Schmid, B., Guan, H., Lewis, E. R., Ricchiazzi, P., and Ogren, J. A.: Direct aerosol forcing: Cal-culation from observables and sensitivities to inputs, J. Geophys. Res., 113, D09202, doi:10.1029/2007JD009170, 2008.

McNaughton, C. S., Clarke, A. D., Kapustin, V., et al.: Observa-tions of heterogeneous reacObserva-tions between Asian pollution and mineral dust over the Eastern North Pacific during INTEX-B, Atmos. Chem. Phys. Discuss., 9, 8469–8539, 2009,

http://www.atmos-chem-phys-discuss.net/9/8469/2009/. Michalsky, J. J., Liljegren, J. C., and Harrison, L. C.: A

compar-ison of Sun photometer derivations of total column water va-por and ozone to standard measures of same at the Southern Great Plains Atmospheric Radiation site, J. Geophys. Res., 100, 25 995–26 003, 1995.

Mishchenko, M. I., Geogdzhayev, I. V., Rossow, W. B., Cairns, B., Carlson, B. E., Lacis, A. A., Liu, L., and Travis, L. D.: Long-term satellite record reveals likely recent aerosol trend, Science, 315, 1543, doi:10.1126/science.1136709, 2007.

Molina, L. T., Madronich, S., Gaffney, J., et al.: An Overview of MILAGRO 2006 Campaign: Mexico City Emissions and its

Transport and Transformation, Atmos. Chem. Phys. Discuss., to be submitted, 2009.

O’Neill, N. T., Eck, T. F., Smirnov, A., Holben, B. N., and Thulasiraman, S.: Spectral discrimination of coarse and fine mode optical depth, J. Geophys. Res., 108(D17), 4559, doi:10.1029/2002JD002975, 2003.

Reagan, J., Thome, K., Herman, B., Stone, R., Deluisi, J., and Snider, J.: A comparison of columnar water-vapor retrievals ob-tained with near-IR solar radiometer and microwave radiometer measurements, J. Appl. Meteorol., 34, 1384–1391, 1995. Redemann, J., Zhang, Q., Schmid, B., Russell, P. B., Livingston,

J. M., Jonsson, H., and Remer, L. A.: Assessment of MODIS-derived visible and near-IR aerosol optical properties and their spatial variability in the presence of mineral dust, Geophys. Res. Lett., 33, L18814, doi:10.1029/2006GL026626, 2006.

Remer, L., Kaufman, Y. J., Tanr´e, D., Mattoo, S., Chu, D. A., Mar-tins, J. V., Li, R.-R., Ichoku, C., Levy, R. C., Kleidman, R. G., Eck, T. F., Vermote, E., and Holben, B. N.: The MODIS aerosol algorithm, products and validation, J. Atmos. Sci., 62, 947–973, 2005.

Remer, L. A., Kleidman, R. G., Levy, R. C., et al.: Global aerosol climatology from the MODIS satellite sensors, J. Geophys. Res., 113, D14S07, doi:10.1029/2007JD009661, 2008.

Rosenfeld, D.: TRMM Observed First Direct Evidence of Smoke from Forest Fires Inhibiting Rainfall, Geophys. Res. Lett., 26(20), 3105–3108, 1999.

Russell, P. B., Livingston, J. M., Dutton, E. G., Pueschel, R. F., Rea-gan, J. A., DeFoor, T. E., Box, M. A., Allen, D., Pilewskie, P., Herman, B. M., Kinne, S. A., and Hofmann, D. J.: Pinatubo and pre-Pinatubo optical-depth spectra: Mauna Loa measure-ments, comparisons, inferred particle size distributions, radia-tive effects, and relationship to lidar data, J. Geophys. Res., 98, 22 969–22 985, 1993a.

Russell, P. B., Livingston, J. M., Pueschel, R. F., Reagan, J. A., Browell, E. V., Toon, G. C., Newman, P. A., Schoeberl, M. R., Lait, L. R., Pfister, L., Gao, Q., and Herman, B. M.: Post-Pinatubo optical depth spectra vs. latitude and vortex structure: Airborne tracking sunphotometer measurements in AASE II, Geophys. Res. Lett., 20, 2571–2574, 1993b.

Russell, P. B., Livingston, J. M., Schmid, B., Eilers, J., Kolyer, R., Redemann, J., Ramirez, S., Yee, J-H., Swartz, W., Shetter, R., Trepte, C., Thomason, L., Risley Jr., A., Wenny, B., Zawodny, J., Chu, W., Pitts, M., Lumpe, J., Randall, C., and Bevilacqua, R.: Aerosol optical depth measurements by airborne sun pho-tometer in SOLVE II: Comparison to SAGE III, POAM III and airborne spectrometer measurements, Atmos. Chem. Phys., 5, 1311–1339, 2005,

http://www.atmos-chem-phys.net/5/1311/2005/.

Russell, P. B., Livingston, J. M., Redemann, J., Schmid, B., Ramirez, S. A., Eilers, J., Kahn, R., Chu, A., Remer, L., Quinn, P. K., Rood, M. J., and Wang, W.: Multi-grid-cell validation of satellite aerosol property retrievals in IN-TEX/ITCT/ICARTT 2004, J. Geophys. Res., 112, D12S09, doi:10.1029/2006JD007606, 2007.

Schmid, B. and Wehrli, C.: Comparison of sun photometer calibra-tion by Langley technique and standard lamp, Appl. Optics, 34, 4500–4512, 1995.

(14)

retrieving columnar water vapor from solar transmittance mea-surements in the 0.94-µm region, J. Geophys. Res., 101, 9345– 9358, 1996.

Schmid, B., Michalsky, J. J., Slater, D. W., Barnard, J. C., Halthore, R. N., Liljegren, J. C., Holben, B. N., Eck, T. F., Livingston, J. M., Russell, P. B., Ingold, T., and Slutsker, I.: Comparison of columnar water-vapor measurements from solar transmittance methods, Appl. Opt., 40, 1886–1896, 2001.

Schmid, B., Hegg, D. A., Wang, J., Bates, D., Redemann, J., Rus-sell, P. B., Livingston, J. M., Jonsson, H. H., Welton, E. J., Se-infeld, J. H., Flagan, R. C., Covert, D. S., Dubovik, O., and Jef-ferson, A.: Column closure studies of lower tropospheric aerosol and water vapor during ACE-Asia using airborne sunphotometer, airborne in-situ and ship-based lidar measurements, J. Geophys. Res., 108(D23), 8656, doi:10.10292002JD003361, 2003.

Smirnov, A., Holben, B. N., Eck, T. F., Dubovik, O., and Slutsker, I.: Cloud screening and quality control algorithms for the AERONET data base, Remote Sens. Environ., 73(3), 337–349, 2000.

Imagem

Fig. 1. Example of a J31 flight track on 10 March 2006, that was overlain on a MODIS 553nm AOD retrieval map
Table 1. Comparison of MODIS Collection 4 and Collection 5 AOD retrievals to AATS measurements (columns 2 and 3) and to each other (column 5)
Fig. 3. (a) Absolute difference in spectral AOD between MODIS-Terra C4 and AATS-14 (solid circles) and MODIS-Terra C5 and AATS- AATS-14 (open squares) as a function of mean reflectance at 553nm
Fig. 4. (a) Absolute difference in spectral AOD between C4 and C5 for MODIS-Terra as a function of mean reflectance at 553 nm
+3

Referências

Documentos relacionados

aerosol optical depth (AOD) of the atmosphere, acoustic sounding of the boundary layer, laser sensing of the aerosol content in the troposphere and stratosphere, mea- surement of

The spatial distribution of aerosol chemical com- position and the evolution of the Organic Aerosol (OA) fraction is investigated based upon airborne measurements of aerosol

Measurements of aerosol chemical composition and aerosol optical depth in the Nepal Himalaya have clearly shown the build up of aerosols in the pre-monsoon season during the winter

The atmospheric visibility was dependent on aerosol number size distribution and its impairment during the hazy episodes was mostly caused by the enhancement of aerosol concentration

In this paper we report the first direct measurements of the reactive uptake coefficient of N2O5 onto submicron aerosols of NaCl and natural sea salt, using an aerosol flow

The results for the spectral single scattering albedo and absorption optical depth for the Mexico City area show a great deal of variability most likely due to aerosol mixtures

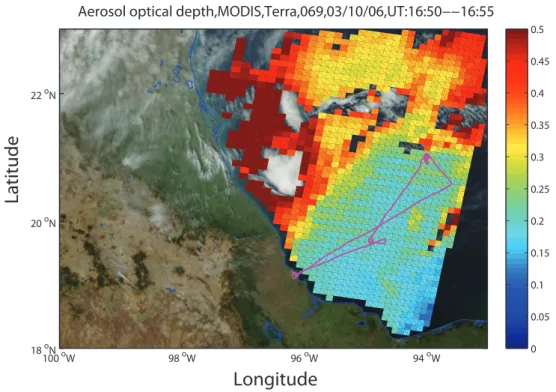
The comparison of aerosol optical depth (AOD) from HAC against MODIS shows larger HAC AOD values over regions with higher aerosol loads and smaller HAC AOD values than MODIS for

The larger averaged extinction coefficient and higher AOD of the aerosol layer in UTLS over Shanghai demonstrate that the enhanced tropopause aerosol was dominated by the Nabro