www.scielo.br/rbg
INTERPRETATION OF THE GEOMAGNETIC ANOMALIES IN THE
S ˜AO FRANCISCO CRATON REGION BASED ON CHAMP MISSION DATA
Nat´alia Valadares de Oliveira
1, Issamu Endo
2and Wladimir Shukowsky
3Recebido em 26 maio, 2011 / Aceito em 12 dezembro, 2011 Received on May 26, 2011 / Accepted on December 12, 2011
ABSTRACT.This paper presents the results of the analysis of magnetic data from the CHAMP mission (CHAllenging Mini-satellite Payload), based on the MF4 (Magnetic Field) magnetic model of the lithosphere aiming at a better understanding of the lithospheric structure of the S˜ao Francisco Craton region. Geophysical studies have been conducted in this area since the 1970s, providing information on the crust and on the lithospheric/asthenospheric mantle with a reasonable degree of detail and reliability. Magnetometric maps constructed from the model discussed here show satisfactory results that allowed for the association of different tectonic events (orogeny, continental passive margins) that occurred during the geodynamic evolution of the lithospheric area in question.
Keywords: magnetometry, CHAMP mission, cratonic lithosphere, S˜ao Francisco Craton.
RESUMO.O presente trabalho apresenta as discuss˜oes dos resultados da an´alise de dados magnetom´etricos provenientes da miss˜ao CHAMP (CHAllenging Mini-satellite Payload), que constituem o modelo geomagn´etico da litosfera MF4 (Magnetic Field), visando o avanc¸o no conhecimento da estruturac¸˜ao litosf´erica da regi˜ao do Cr´aton S˜ao Francisco. Estudos geof´ısicos nesta ´area tˆem sido realizados desde a d´ecada de 1970, fornecendo um conhecimento da crosta e do manto litosf´erico/astenos-f´erico com um razo´avel grau de detalhamento e confiabilidade. Os mapas magnetom´etricos baseados no modelo MF4 apresentaram resultados satisfat´orios que pos-sibilitaram associar as estruturac¸˜oes resultantes de alguns eventos tectˆonicos distintos de orogenias de n´ucleos continentais e para margens passivas, envolvidos na geodinˆamica da porc¸˜ao litosf´erica em quest˜ao.
Palavras-chave: magnetometria, miss˜ao CHAMP, litosfera cratˆonica, Cr´aton S˜ao Francisco.
1Natural Sciences Department, Universidade Federal do Esp´ırito Santo, BR-101Norte, km 60, Bairro Litorˆaneo, 29932-540 S˜ao Mateus, ES. Post-Graduation Program ‘Crustal Evolution and Natural Resources’/Universidade Federal de Ouro Preto, Geology Department, Av. Morro do Cruzeiro, s/n, Morro do Cruzeiro, 35400-000 Ouro
Preto, MG, Brazil. Phone: +55 (27) 3312-1650 – E-mail: [email protected]
2Geology Department, School of Mines, Universidade Federal de Ouro Preto, Av. Morro do Cruzeiro, s/n, Morro do Cruzeiro, 35400-000 Ouro Preto, MG, Brazil. Phone: +55 (31) 3559-1853 – E-mail: [email protected]
INTRODUCTION
The geophysical studies performed in the S˜ao Francisco Craton region have been carried out since the 70’s under the Gravimetric Survey Program of the Bahia State (DNPM/CPRM Agreement).
Airborne geophysical surveys were conducted over extensive areas of the craton with simultaneous recording of magnetic and scintillometric data (K, Th, U and CT). Data from some of such sur-veys, investigated in greater detail, allowed for better understand-ing of the region’s crust. In recent decades, geophysical investi-gations have been systematically conducted aiming at unveiling the structure and evolution of the Earth’s lithosphere.
Data obtained with the use of potential methods (Gravime-try and Magnetome(Gravime-try) increase our knowledge of the crust and of the lithospheric/asthenospheric mantle of a certain region with a reasonable degree of detail and reliability, allowing both better knowledge of the crustal structure of the region in several scales and the determination of specific parameters of the rheology of the lithosphere, including its isostatic condition (eg. Blitzkow et al., 1979; Haralyi & Hasui, 1985; Ussami, 1986, Molina & Ussami, 1999; Oliveira, 2005, 2009).
Other studies involving seismology, magnetotelluric surveys and geothermal studies were performed on the craton, both in lo-cal and in regional slo-cale (e.g. Assumpc¸˜ao et al., 2002; P´adua, 2005; Alexandrino & Hamza, 2008), adding to the knowledge of the region’s crust and mantle.
In this context, it is here proposed to present and discuss the results of the geomagnetic mapping of the S˜ao Francisco Craton region derived from data obtained during the CHAMP – MF4 space mission (CHAllenging Mini-satellite Payload – Mag-netic Field, Reigber et al., 2002) aiming at understanding the lithospheric structure and geodynamic evolution of the area. In addition to a short explanation of the magnetometry by satel-lite methodology, a geological interpretation of thematic maps will be presented, trying to correlate the patterns of geomagnetic anomalies with the main tectonic-structural features of this important segment.
GEOLOGIC CONTEXT
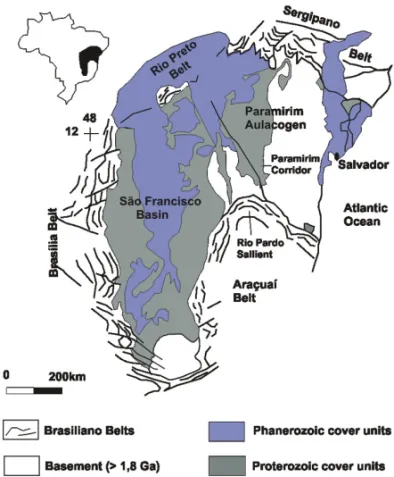
The S˜ao Francisco Craton region is a geotectonic entity of higher order of the pre-Brasiliano (Pan African) consolidation, which comprises almost the entire state of Bahia and extends to the neighboring regions of Minas Gerais, Sergipe, Pernambuco and Goi´as (Almeida, 1977) (Fig. 1).
Initially, the limits of the S˜ao Francisco Craton region were defined by Almeida (1977), according to craton delimitation
cri-teria of the Russian-European school, classifying them into two categories: conventional and arbitrary.
The conventional limits were defined by the relevant struc-tural discontinuities such as the more external faults of the fold-ing belts. The arbitrary limits were identified on shield regions, on areas with Phanerozoic or Proterozoic cover without signifi-cant discontinuities, in areas of reworked basement, in segments of continuous folding within the belts and discontinuous folding within the cratonic area (Almeida, 1981).
In the inner portion of the craton, in most of its extension, Precambrian and Phanerozoic covers prevail, constituting three major morphotectonic units: S˜ao Francisco Basin, Paramirim Aulacogen and a great portion of the Recˆoncavo-Tucano-Jatob´a Rift. Differently, both in the extreme southern and in the eastern portions, the basement outcrops. The protoliths of the Espinhac¸o (Mesoproterozoic) and S˜ao Francisco (Neoproterozoic) Super Groups were deposited on an aborted rift delineated by trunca-tions in the N/S direction (Alkmim et al., 2003).
The tectonic evolution of the S˜ao Francisco Craton region features five stages of deforming events (Alkmim, 2004), where stage I is the Rio das Velhas/Jequi´e event (2.9–2.7 Ga) derived from distinct orogenic events of continental nuclei, aggregated by means of diachronic collisions, together with the juvenile arches and post-tectonic magmatic episodes. Later, once the continent was consolidated, the Craton region evolved towards the Minas passive margin, individualizing the Paramirim region (2.5 Ga) and making evident stage II of the Paramirim continent individ-ualization. Stage III is marked by the Trans-Amazon event, where the Paramirim continent (Gavi˜ao block) collides with the Gabon continent as part of the Paleoproterozoic orogeny (2.1–1.9 Ga).
It is likely that those collisions lead to the formation of a supercontinent, on which the Staterian period developed. Stage IV is evidenced by the Staterian taphrogenesis (1.75 Ga), during which the development of continental sedimentary rifts occurred, interspersed with acid lava, capped by marine deposits from the Espinhac¸o Super Group. The Staterian rifts were reactivated, some evolved to passive margins and a new taphrogenesis occurred in the Maca´ubas region, followed by glaciation in stage V, defined as the Tonian Taphrogenesis (950 Ma). During that period, the S˜ao Francisco – Congo Plate was individualized, outlining traces of the future S˜ao Francisco Craton.
METHODOLOGY
(Reigber et al., 2002). Recently, two models were incorporated to the new CHAMP datum: i) the Comprehensive Model (Sabaka et al., 2002), that includes geomagnetic field parameters taking into account the sources from the nucleus to the magnetosphere and, ii) the MF (Magnetic Field) models, focused strictly on the lithospheric magnetic field.
Figure 1– Simplified geologic map of the S˜ao Francisco Craton region (Cruz & Alkmim, 2006).
The initial model MF1 was determined based on scalar data (total intensity) surveyed in the first year of the CHAMP mis-sion (Maus et al., 2002). Presently, the fourth generation model (MF4) is under development using improvements in the process-ing methodology, includprocess-ing correction for polar electrojet (PEJ) effects.
The MF4 field model represents part of the crustal geomag-netic field, derived from the scalar and vector data acquired during five years, between August 20, 2000 and April 2005. Data were acquired using an absolute Overhauser scalar magnetometer (OVM) with a 1 Hz sampling rate and a triaxial fluxgate magne-tometer (FGM) with a 50 Hz sampling rate. CHAMP spatial ori-entation was based on an optical camera system that allowed the measurement of the vector field with an accuracy of a few seconds. The model is obtained by the expansion of spherical har-monics (SH) for the grade 90 potential magnetic field and coef-ficients from 1 to 15. Input data were measured by the CHAMP satellite in an Earth orbit with an inclination of 87.3◦and an initial
altitude of 456 km. In five years the altitude decreased to 360 km, requiring two orbital maneuvers to increase the altitude and ex-tending the mission’s useful life.
In order to assess a model for the lithospheric geomagnetic field, it is necessary to consider some of its possible applications:
a) Subtract the lithospheric model from the measurements obtained by the satellite, to be able to study phenomena such as ionospheric currents (Ritter et al., 2004), pulsa-tions (Sutcliffe & L¨uhr, 2003) and magnetic signals caused by ocean flow (Tyler et al., 2003);
b) Direct use of the model in geologic and geophysical inter-pretation (Hemant et al., 2004; Hemant & Maus, 2005);
c) Construction of a long wavelength lithospheric model, to be used in large-scale compilations of marine magnetic data and of data acquired in airborne surveys.
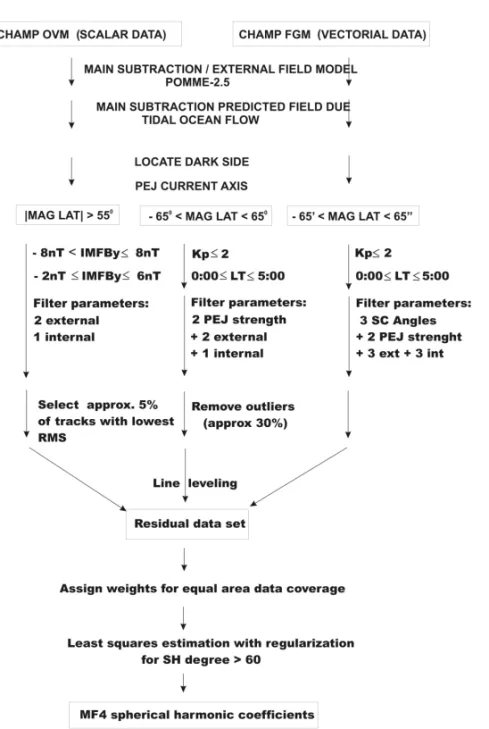
Processing also includes the subtraction of the values related to the main field, to the magnetospheric field and to corrections for effects arising from ocean tides. Magnetospheric fields still present, after this phase, are removed by adjustment, using a low-grade spherical harmonic function (Fig. 2).
The magnetometric maps of the S˜ao Francisco Craton region were generated via GMT – Generic Mapping Tools (Wessel & Smith, 1991, 1998), using data from the CHAMP – MF4 mis-sion (Maus et al., 2006) with altitudes of 400, 100 and 50 km, to emphasize anomalies at lithospheric levels. The interpolation technique applied was the minimum curvature with a five-minute grid interval.
RESULTS
Over the S˜ao Francisco Craton region, the total geomagnetic map at 400 km altitude allowed for the identification of the magnetic amplitude domains in different areas. The intermediate magnetic values appear associated to the Trans-Brazilian Lineament. Those of low magnetic amplitude are represented by the Rio Escuro Lineament with a preferential NE 45◦direction. The higher
val-ues, also in the NE 45◦direction, are related to the Serra do Mar
mountain range (Fig. 3).
Figure 2– CHAMP – MF4 satellite data processing scheme. POMME-2.5: Potsdam Magnetic Model of the Earth; OVM: Overhauser scalar magnetometer; FGM: fluxgate magnetometer; PEJ: Polar Electrojets; SH: Spherical Harmonics; IMF: Interplanetary Magnetic Field; RMS: Root Mean Square; Kp: magnetic activity index (Maus et al., 2006).
in the Alto Janu´aria, Serra do Mar and in the Tocantins Province, all of which are probably associated to orthognaisses related to the magmatic arch and ophiolitic m´elange of the internal zone of the Bras´ılia Belt. In the volcanic cones of the Cabo Frio High the higher anomalies and linear structures are, in general, oriented in the NE 45◦direction (Fig. 4).
In the derivative Z at 100 km altitude map the low magnetic amplitudes associated with the internal zone of the Bras´ılia, Alto Janu´aria, Rio Escuro Lineament, Quadril´atero Ferr´ıfero and Cabo Frio High are clearly shown. The high magnetic amplitudes are related to the Serra do Mar range, to the Tocantins Province mag-matic arch and to intermediate amplitudes covering the remaining cratonic regions (Fig. 5).
The regions of the Cabo Frio High, Quadril´atero Ferr´ıfero and Rio Escuro Lineament stand out by their lower magnetic values in the total field map at 50 km altitude, while those in the higher magnetic value domain are associated with the Serra do Mar range (Fig. 6). The magnetic domains are similar to those of the deriva-tive Z at 100 km altitude map (Fig. 5).
by intermediate magnetic amplitudes in the total field at 50 km altitude map (Fig. 7).
Figure 3– Geomagnetic anomalies map of the total field at 400 km altitude of the cratonic region and vicinities. 1 – Trans-Brazilian Lineament; 2 – Rio Escuro Lineament; 3 – Serra do Mar.
The Trans-Brazilian Lineament is composed of fragile tran-scurrent faults along the NE 30◦direction and extends for more
than 400 km to the African continent (Cordani et al., 2003). The Trans-Brazilian Lineament is the main regional feature present in the central portion of the Tocantins Province in Central Brazil and was highlighted in the total magnetic field at 400 km and 50 km altitude maps (Figs. 3, 6), and in the 100 km and 50 km Z derivate maps (Figs. 6, 7).
The cratonic lithosphere can be seen in the crust/mantle in-terface map (Oliveira, 2009) indicating a crustal thickening in the S˜ao Francisco Craton and in the Tocantins Province, mainly in the Bras´ılia Belt, while the crust becomes thinner in the Quadril´atero Ferr´ıfero region. In the northern craton portion, a crustal thinning in the East-West direction shows depths between 37 and 43 km. As to the southern region, it has a thickness between 35 and 40 km (Fig. 8). In the Bras´ılia Belt and in the S˜ao Francisco Basin it is around 45 km, in agreement with the results obtained by Giese & Schutte (1975), Blitzkow et al. (1979), Ussami (1986), Soares (2005) and Oliveira (2009).
Figure 4– 100 km amplitude analytic signal of the cratonic region and envi-rons. 1 – Paramirim Aulacogen; 2 – Salvador Fault Zone; 3 – Candeias Linea-ment – Vit´oria – Trindade; 4 – Alto de Sete Lagoas; 5 – Alto Parna´ıba; 6 – Alto de Janu´aria; 7 – Tocantins Province; 8 – Alto Cabo Frio.
Figure 6– 50 km altitude total field geomagnetic anomalies map of the cra-tonic region and environs. 1 – Trans-Brazilian Lineament; 2 – Cabo Frio High; 3 – Quadril´atero Ferr´ıfero; 4 – Rio Escuro Lineament; 5 – Serra do Mar.
Figure 7– 50 km altitude vertical Z component geomagnetic anomalies map of the cratonic region and environs. 1 – Quadril´atero Ferr´ıfero; 2 – Arax´a Complex; 3 – Alto Janu´aria; 4 – Cabo Frio High; 5 – Borborema Province; 6 – Tocantins Province; 7 – Riacho do Pontal Belt.
Figure 8– Moho map of the S˜ao Francisco Craton and environs. 1 – S˜ao Fran-cisco Craton; 2 – Tocantins Province; 3 – Bras´ılia Belt; 4 – Quadril´atero Ferr´ıfero; 5 – S˜ao Francisco Basin (Oliveira, 2009).
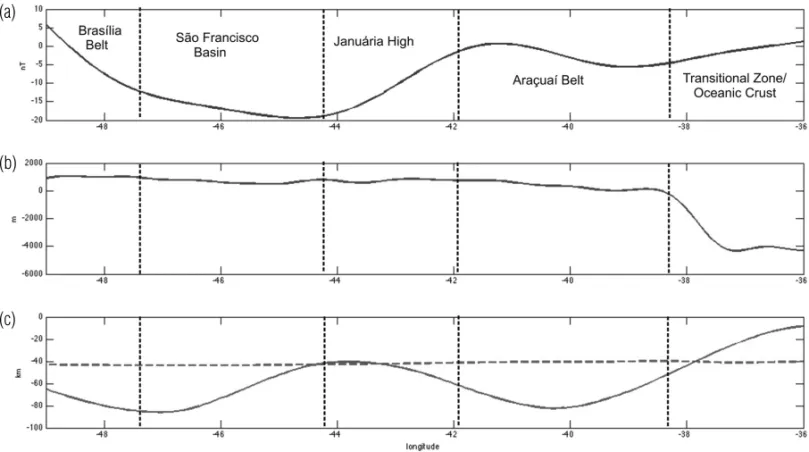
Complementarily, the magnetic profile of the vertical Z com-ponent, together with the topographic profile, the crust/mantle interface and the thickness of the magnetic lithosphere (Fig. 9), supplied satisfactory information in relation to the magnetic litho-spheric behavior of the craton region and its environs. To obtain this integrated profile, a compilation was conducted with data from the vertical Z component at 50 km altitude, from the topographic profile obtained from the digital landscape model DTM2006 (Oliveira, 2009), from the crust/mantle interface (Oliveira, 2009) and from the thickness of the magnetic lithosphere, obtained by 2D inversion of the vertical Z component, based on the method-ology detailed in Dyment & Arkani–Hamed (1998) and Maule et al. (2005), where the top of the magnetic lithosphere is repre-sented by the region’s topography and its base by theCuriedepth,
where minerals lose their magnetic properties at a temperature of approximately 580◦–600◦C (Blakely, 1995). The variation of the
magnetic lithosphere can be perceived in the S˜ao Francisco Cra-ton region, where the base coincides with theCurie surface.
(a)
(b)
(c)
Figure 9– AA’ profile representing 50 km altitude geomagnetic curves (a); topography (b); Moho: interface crust/mantle (dashed line in c); magnetic lithosphere from theCuriesurface (continuous line in c).
90 km. The Arac¸ua´ı Belt presents a variety of altitude values and intermediate amplitudes; the crust/mantle interface is at around 38 km and a magnetic lithosphere thickness of 80 km. The tran-sitional zone and the oceanic crust present intermediate ampli-tudes, with the bathymetry reaching 4,000 m below sea level, the crust/mantle interface reaching 37 km and the magnetic litho-sphere thickness reaching 10 km (Fig. 9).
In the S˜ao Francisco Craton region, the S˜ao Francisco Basin presents intermediate amplitudes, a crust/mantle interface at 45 km and a magnetic lithosphere thickness of around 90 km. In the Alto Janu´aria region, amplitude values are high, with a crust/mantle interface at 37 km and a magnetic lithosphere thick-ness of 40 km.
CONCLUSIONS
The analysis of the geomagnetic anomalies of the S˜ao Francisco Craton region and vicinities, obtained by processing data acquired by the CHAMP – MF4 mission, allowed for its association with formations that probably resulted from major tectonic events, in-volving the lithosphere at the S˜ao Francisco Craton region.
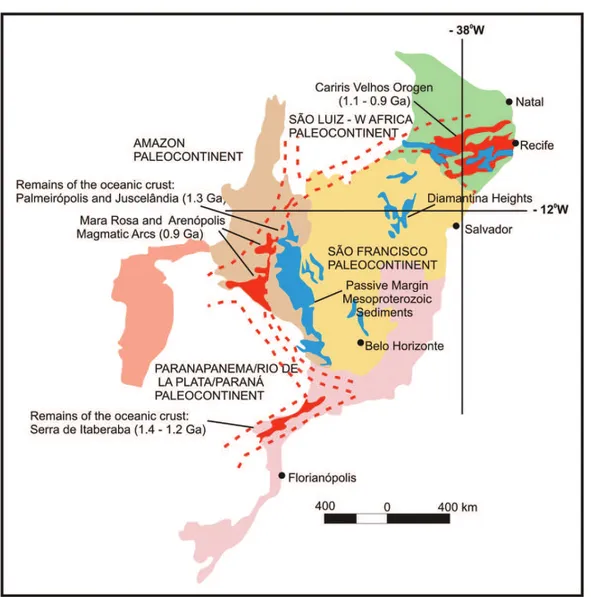
The paleogeographic configuration of the Ectasian – Estenian ocean and the extensional phase, recorded by the remnants of the oceanic crust in the tectonic formations of the Brasiliano, around the S˜ao Francisco Province (Fig. 10), are evidenced in the total
magnetic field maps at 400 and 50 km altitudes (Figs. 3, 6) and in the 100 km altitude vertical Z component maps (Fig. 5).
The magnetic lithosphere thickness of the cratonic region highlighted in profile AA’ (Fig. 9), ranges between 40 and 90 km. That variation may be associated to the thermal contributions in the mantle, both by thermal flow and by the distribution of HPEs (Radiogenic Heat Producing Elements), to theCurie
sur-face and to the chemical impoverishment of the mantle combined to the floatability effect of the cratonic lithospheric mantle, caused by its tendency to become chemically differentiated during geo-logical times, with less Fe and Mg contents, due to successive magmatic episodes (Oliveira, 2009), can also account for the observed thickness variations.
ACKNOWLEDGMENTS
The authors thank GFZ-Potsdam for the supply of CHAMP mis-sion satellite magnetometry data and to the reviewers for correc-tions and suggescorrec-tions.
REFERENCES
Figure 10– Paleogeographic reconstitution of the Ectasian – Estenian Ocean and their records during its expansion phase: remains of the oceanic crust, passive margins; compression phase: magmatic arches (Delgado et al., 2003).
ALMEIDA FFM. 1977. O Cr´aton do S˜ao Francisco. Revista Brasileira de Geociˆencias, 7(4): 349–364.
ALMEIDA FFM. 1981. O Cr´aton do Paramirim e suas relac¸˜oes com o do S˜ao Francisco. In: SBG, II Simp´osio Cr´aton S˜ao Francisco e suas faixas marginais. Publicac¸˜ao Especial, Atas, 1–10.
ALKMIM FF. 2004. O que faz de um cr´aton um cr´aton? O cr´aton do S˜ao Francisco e as Revelac¸˜oes Almeidianas ao Delimit´a-lo. In: MANTESSO-NETO V, BARTORELLI A, CARNEIRO CDR & BRITO NEVES BB (Org.). Geologia do Continente Sul-Americano: Evoluc¸˜ao da Obra de Fernando Marques de Almeida. Beca, S˜ao Paulo, 17–35.
ALKMIM FF, MARSHAK S, PEDROSA-SOARES AC, CRUZ SCP, PERES GG & WHITTINGTON AG. 2003. Tectˆonica Quebra-Nozes e a Gˆenese do Or´ogeno Arac¸ua´ı-Congo Ocidental. In: Simp´osio Nacional de Estudos Tectˆonicos, 9., B´uzios. SBG-RJ, Boletim de Resumos, p. 40–43.
ASSUMPC¸˜AO M, JAMES D & SNOKE A. 2002. Crustal thickness in SE Brazilian Shield by receiver function analysis: implications for isostatic compensation. Journal of Geophysical Research, 107: 1–14.
BLAKELY RJ. 1995. Potential Theory in Gravity and Magnetic Applica-tions. Cambridge, Cambridge University Press. 464 pp.
BLITZKOW D, GASPARINI P, MANTOVANI MSM & S´A NC. 1979. Crustal structures of SE Minas Gerais, Brazil deduced from gravity mea-surements. Revista Brasileira de Geociˆencias, 9(1): 39–43.
CORDANI UG, BRITO NEVES BB, D’AGRELLA MS & TRINDADE RIF. 2003. Tearing-up Rodinia: the Neoproterozoic paleogeography of South American cratonic fragments. Terra Nova, 15: 343–349.
CRUZ SCP & ALKMIM FF. 2006. The tectonic interaction between the Paramirim Aulacogen and Arac¸ua´ı Belt, S˜ao Francisco craton region, eastern Brazil. Anais da Academia Brasileira de Ciˆencias, 78(1): 151– 173.
DELGADO IM, SOUZA JD, SILVA LC, SILVEIRA FILHO NC, SANTOS RA, PEDREIRA AJ, GUIMAR˜AES JT, ANGELIM LAA, VASCONCELOS AM, GOMES IP, LACERDA FILHO JV, VALENTE CR, PERROTTA MM & HEINECK CA. 2003. Geotectˆonica do Escudo Atlˆantico. In: BIZZI LA, SCHOBBENHAUS C, VIDOTTI RM & GONC¸ALVES JH (Eds.). Geologia, Tectˆonica e Recursos Minerais do Brasil. Bras´ılia, CPRM, 227–334.
GIESE P & SCHUTTE J. 1975. Preliminary results of seismic measure-ments in the Brazilian coastal mountains. Univ. Freiburg, 11 pp. Internal Report (unpublished).
HARALYI NLE & HASUI Y. 1985. Interpretation of gravity and magnetic data, central and eastern Brazil. In: HINZE WJ (Ed.). The utility of regional gravity and anomaly maps. Tulsa, Oklahoma, Society of Exploration Geo-physicists, p. 124–131.
HEMANT K & MAUS S. 2005. Geological modeling of the new CHAMP magnetic anomaly maps using a geographical information system tech-nique. Journal of Geophysical Research, 110: 1–23.
HEMANT K, MAUS S & HAAK V. 2004. Interpretation of CHAMP crustal field anomaly maps using geographical information system (GIS) technique. In: REIGBER C, L ¨UHR H, SCHWINTZER P & WICKERT J (Eds.). Earth Observation with CHAMP: Results from Three Years in Orbit. Springer, Berlin. p. 249–254.
MAULE CF, PURUCKER ME, OLSEN N & MOSEGAARD K. 2005. Heat Flux Anomalies in Antarctica Revealed by Satellite Magnetic Data. Sci-ence, 309: 464–467.
MAUS S, ROTHER M, HOLME R, L ¨UHR H, OLSEN N & HAAK V. 2002. First scalar magnetic anomaly map from CHAMP satellite data indicates weak lithospheric field. Geoph. Res. Lett., 29(14): 1–5.
MAUS S, L ¨UHR H, ROTHER M, HEMANT K, BALASIS G, RITTER P & STOLLE C. 2006. Lithospheric magnetic field modeling from CHAMP satellite measurements. In: Proceedings of the Geomagnetism Work-shop. Braunschweig, Germany, 269–274.
MOLINA EC & USSAMI N. 1999. The geoid in southeastern Brazil and adjacent regions: new constraints on density distribution and thermal state of the lithosphere. Journal of Geodynamics, 28: 357–374.
OLIVEIRA NV. 2005. Modelagem e Invers˜ao 2D de dados magneto-m´etricos aplicados na caracterizac¸˜ao geom´etrica do sinclinal Gandarela e Homoclinal Curral, Quadril´atero Ferr´ıfero, MG. M.Sc. Dissertation, Geology Department, School of Mines, Universidade Federal de Ouro Preto, 124 pp.
OLIVEIRA LGS. 2009. A Miss˜ao GRACE e a Estrutura da Litosfera na Regi˜ao do Cr´aton S˜ao Francisco. Doctorate Thesis, Universidade Federal de Ouro Preto, 173 pp.
P´ADUA MB. 2005. Estudo da Induc¸˜ao Eletromagn´etica na Caracterizac¸˜ao de estruturas profundas sob a borda sul do Cr´aton S˜ao Francisco. Doctorate Thesis, INPE, 162 pp.
REIGBER CH, L ¨UHR H & SCHWINTZER P. 2002. CHAMP mission status. Adv. Space Res., 30: 129–134.
RITTER P, L ¨UHR H, VILJANEN A, AMM O, PULKKINEN A & SILLANPAA I. 2004. Ionospheric currents estimated simultaneously from CHAMP satellite and IMAGE ground-based magnetic field measurements: A sta-tistical study at auroral latitudes. Ann. Geophys., 22: 417–430.
SABAKA TJ, OLSEN N & LANGEL RA. 2002. A comprehensive model of the quiet-time, near-Earth magnetic field: phase 3. Geophys. J. Int., 151: 32–68.
SOARES JEP. 2005. Estudos de Refrac¸˜ao S´ısmica Profunda, Func¸˜ao do Receptor e Gravimetria na Prov´ıncia Tocantins, Brasil Central. Doctorate Thesis, Universidade de Bras´ılia, 125 pp.
SUTCLIFFE PR & L ¨UHR H. 2003. A comparison of Pi2 pulsations ob-served by CHAMP in low Earth orbit and on the ground at low latitudes. Geophys. Res. Lett., 30: 2105–2109.
TYLER R, MAUS S & L ¨UHR H. 2003. Satellite observations of magnetic fields due to ocean tidal flow. Science, 299: 239–241.
USSAMI N. 1986. Interpretation of gravity anomalies of Bahia State, Brazil. Universidade de Durham, Doctorate Thesis, 130 pp.
WESSEL P & SMITH WHF. 1991. Free software helps map and display data. Eos Trans. AGU, 72: 441.
WESSEL P & SMITH WHF. 1998. New improved version of the Generic Mapping Tools Released. Eos Trans. AGU, 79: 579.
NOTES ABOUT THE AUTHORS
Nat´alia Valadares de Oliveiragraduated in Geological Engineering (2002), Master’s Degree in Earth Sciences (2005) with emphasis in Geophysics, Universidade Federal de Ouro Preto (UFOP). Working on a Ph.D. in Structural/Tectonic Geology at UFOP. Presently works as Assistant Professor at the Northern Esp´ırito Santo State, Natural Sciences Department, Centro Universit´ario do Esp´ırito Santo, Universidade Federal do Esp´ırito Santo. Areas of interest: Potential Methods, Applied Geophysics and Geotectonic.
Issamu Endograduated in Geological Engineering (1980), Master’s Degree in Structural and Tectonic Geology (1988), Universidade Federal de Ouro Preto. Ph.D. in Geotectonics, Institute of Geosciences, Universidade de S˜ao Paulo (1997). Professor at the Geology Department of School of Mines (UFOP) since 1997, teaching graduation and post-graduation courses on Structural Geology, Structural Analysis and Geological Movements. Areas of interest: Stratigraphy and Pre-Cambrian Belt Tectonics.