39
Monika Hofmann
Doutoranda TU-Darmstadt
Institut für Angewandte Geowissenschaften Schnittspahnstr - Darmstadt - Germany [email protected]
Andreas Hoppe
Professor TU-Darmstadt
Institut für Angewandte Geowissenschaften Schnittspahnstr - Darmstadt - Germany [email protected]
Joachim Karfunkel
Professor Associado
Universidade Federal de Minas Gerais - UFMG Departamento de Geologia
Belo Horizonte - Minas Gerais - Brasil [email protected]
Allan Büchi
Mestrando
Universidade Federal de Minas Gerais - UFMG Departamento de Geologia
Belo Horizonte - Minas Gerais - Brasil [email protected]
GIS-based analysis of
geo-resources and geo-hazards
for urban areas – the example
of the northern periphery of
Belo Horizonte (capital of
Minas Gerais, Brazil)
Abstract
Easily understandable thematic maps of geo-scientiic parameters are important for land use decision making. If several parameters are relevant and have to be com-pared, it is important that they are consistent with each other, available at the same spatial range and detail and normed to a common data range. In the current study, geological and topographical data have been used to derive a set of 90 geo-scientiic maps for an area of 400 km² in the northern part of the metropolitan area of Belo Horizonte. Each parameter has been transferred to a common data range between 0 and 1 using a Semantic Import Model strategy and afterwards combined to derive new parameters for soil hydrology and hydrogeology. From these, many intermediate geo-scientiic parameters, maps of geo-resources (sand/gravel, carbonates, fertile soils) and geo-hazards (erosion, groundwater pollution) have been derived that they can be used as base information for a participatory and sustainable land use planning. The worklow is transparently stored in GIS-tools and can be modiied and updated if new information is available.
Keywords: spatial analysis, multi-criteria decision making, soil properties, predic-tive mapping, geo-resources, geo-hazards, spatial decision support system, GIS, groundwater vulnerability.
Geosciences
Geociências
http://dx.doi.org/10.1590/0370-44672015700135
1. Introduction
Easily understandable spatial infor-mation is essential for stakeholder par-ticipation in land use decisions. Maps of geo-potentials – i.e. resources and hazards related to geology - visualize knowledge that is otherwise difficult to describe and compare (Lehné et al. 2013). Spatial
Decision Support Systems (SDSS) use this information by showing the best location according to different stakeholder groups’ priorities. Hoppe et al. (2006), Marinoni
and Hoppe (2006) and Lamelas et al.
(2012) give examples of this concept for densely populated areas in Spain and Ger-many. In the current study, this concept is applied to a rapidly developing region in Brazil.
A typical worklow converts base information regarding geology and topog-raphy into normed thematic maps of risks and resources. These maps are multiplied by a weight factor depending on their
es-timated importance and then combined to a map showing the most suitable locations (Figure 1). The aim of the current project is to combine available information until the irst result in Figure 1, i.e. normed factor maps of geo-resources and geo-hazards that can be the input for a SDSS.
The following requirements must be met for the maps:
• Consistent: input data needs to be
scale and amount of detail
• Spatially continuous: parameters avail -able only as point information need to be regionalized
• Comparable: transferred to a normed
data range e.g. from 0 – 1
• Transparently documented and possible
to update.
Taking into account the existing compendia of thematic maps for the area, translation and interpretation of already available data could not be the only focus of the project. Instead, a complete work-low from the analysis and enlargement of
the existing database until the regionaliza-tion of new parameters was created. The result comprises over 90 thematic maps that have been published in a PhD thesis (Hofmann 2014) and can be downloaded including the GIS tools at http://tuprints. ulb.tu-darmstadt.de/4152/.
Figure 1
Principle of the weighted overlay for the generation of a suitability map. The weights can be generated using a ranking method (e.g. Saaty 1977) and add up to 1.
2. Materials and method
The study area comprises 400 km² in the northern periphery of Belo Horizonte, where urbanization proceeds rapidly follow-ing the construction of the highway MG 10 (Figure 2). The geological underground is composed of lat lying sequences of Late Pro-terozoic limestone – marl - pelite alternations of the Bambuí Group above Precambrian crystalline basement. The following units of the Bambuí Group can be found in the
study area (from bottom to top): Carrancas
Formation, Sete Lagoas Formation and Serra de Santa Helena Formation. The diamictites
of the Carrancas Formation are documented
only at a single outcrop, their spatial extent is not known. The base of the Sete Lagoas Formation consists of impure limestones (Pedro-Leopoldo Facies), which are overlain or interdigitated with pure, finely lami-nated limestone of the Lagoa Santa Facies
(Schöll 1972, 1973). The meta-pelites of the Serra de Santa Helena Formation cover these limestones in large parts of the study area. Except for the Lagoa Santa Karst area (Kohler 1989, Kohler and Karfunkel 2002), the hilly landscape is covered by deep saprolites of weathered meta-pelites of the Serra de Santa Helena Formation and in the southern part also of weathered gneiss-granite basement. The city of Lagoa Santa
Figure 2
Location of the study
41
is built on meta-pelites around a triangular lake that is not connected to the karst system (Parizzi et al. 1998). The climate is tropical
at high altitudes (650 – 920 m.a.s.l.) with humid warm summers, dry cool winters and an annual precipitation around 1300 mm. In this area, the following geo-poten-tials play an important role for land use plan-ning: In karstiied terrain, a large unconined groundwater reservoir exists that is highly vulnerable to pollution, especially since the most fertile soils are near doline bottoms. Limestone outcrops are potential locations for cement quarries and compete with the protection of the sensitive karst environ-ment, which also hosts many archeological sites. Increased sealing following urbaniza-tion quickly changes the catchment hydrol-ogy and leads to a higher risk of inundation and linear erosion. Especially the deeply weathered hills on meta-pelites or granite basement are often cut by deep gullies. Since the urban area is only partly connected to
sanitation systems, pollution of surface and subsurface water is a large issue. Exploita-tion of sand and gravel resources have left a very irregular relief in alluvial plains that restrict its further use.
Throughout the workflow of the project, the rate of data aggregation and thus the directly accessible information for non-experts rises from the base data and continues until the inal thematic maps (Figure 3). Altogether, four levels (steps) of data and knowledge aggregation can be distinguished:
In Step 1, the available primary input data is collected and integrated into a digital spatial database. The most central informa-tion involves geological architecture, relief and hydrological soil properties. The input data with highest spatial detail is the topo-graphic map 1 : 25 000.
In Step 2, a geology – soil – landscape model is developed. Geological maps are checked for consistency with relief features
and updated to a scale of 1 : 25 000. Also the information about geomorphology and soil is updated using ield studies and remote sensing data. The result is used to derive a conceptual model from geological architec-ture to landscape evolution and the typical distribution of hydrological soil properties. In Step 3, information about the geological architecture from Step 2 is used to interpolate the thickness of each strata including an estimation of the weathering depth and the existence of covered karst fea-tures. The descriptive geology-soil-landscape model is transferred into regionalization rules for hydrologically relevant soil proper-ties using a Semantic Import Model strategy (Figure 4, Hofmann et al. 2013). The output
parameters comprise an estimation of the highly permeable red topsoil layer depth, hydrological soil class, degree of lateral low, hydromorphic soils, effective ield capacity, base saturation, soil erodibility, risk of near surface epikarst and weathering depth.
In Step 4, the parameters derived in Step 3 are aggregated into thematic maps for decision makers regarding geo-hazards and geo-resources. These maps comprise groundwater vulner-ability, gully erosion hazard, risk of
contamination of surface water, agri-cultural value and the accessibility of mass resources.
Land use information, which is quickly changing, is incorporated at the latest possible stage in the
work-low, especially during assessment of groundwater vulnerability and erosion hazard. In most other thematic maps, such as agricultural value or availability of limestone resources, land use is not included at all.
Figure 4
General workflow for regionalizing hydro-logical soil properties (step 3 in Figure 3).
A short overview of the meth-odology for Step 4 is given below, a detailed description can be found in Hofmann (2014):
• Limestone resources and their
accessibility are estimated by the inter-polated thickness of overburden and interpolated thickness of limestone layers above groundwater surface.
• Sand resources in the area are es -timated based on sedimentary structures and a GIS-based volume calculation of the Quaternary sediments (Hofmann et al. 2009).
• Agricultural value is primarily
related to parent material and relief posi-tion and restricted by erosion hazard along
steep slopes.
• Groundwater vulnerability is
estimated based on of the protection by overlying strata combined with the risk of bypassing these layers by lateral low into karst ponors. This method has been spe-ciically developed for a mix of a karst and non-karst environments (Goldscheider 2002, Goldscheider et al. 2000).
• The risk of gully erosion is divided
into two processes: The irst sub-process focuses on concentrated surface low or small landslides that can remove the protecting topsoil cover and may act as trigger. The second sub-process is gully propagation, for which the workflow is displayed in Figure 5. Here, the most
important parameters are concentration of subsurface low, depth of saprolite, location inside a headwater hollow and the existence of a temporary aquifer (Bacellar et al. 2005). For the inal gully
erosion hazard map (Figure 6), both sub-processes are combined. The effect of concentrated surface and subsurface low is derived using a modiied topographic threshold method based on drainage area and slope.
• The risk of surface water contami -nation by rain-wash is derived from the hydrological closeness to water courses. A precipitation-distribution map was not available for this assessment but could eas-ily be integrated into the GIS-worklow.
Figure 5 Sub-workflow
43
3. Results and discussion
The maps of hydrological soil properties include relief information from the topographic map 1 : 25.000. Thus, they display a higher spatial detail than the previously available soil maps
1 : 50 000 (CPRM 1994, Shinzato and
Lumbreras 1998). Although a high spatial resolution suggests higher accu-racy, it has to be remembered that the rules of the worklow are necessarily general and do not comprehend local special situations. It is very dificult to compare the existing maps or use them for validation since the mapping units are different and often combine several soil types. Still, similar approaches have shown better results for mapping con-tinuous soil parameters than extracting them from classical soil maps (Qi et al. 2006). One of the most often used
intermediate parameters is the risk of near surface epikarst. This parameter is very dificult to estimate but central for the assessment of groundwater vul-nerability, mass resources and erosion. Following the methodology of Gold-scheider et al. (2000), subsoil and saprolite
are considered the most important
pro-tecting layers for the groundwater in this area. The assessment quality of their thick-ness depends largely on the correctthick-ness of the interpolated geological architecture, weathering depth and groundwater level. The degree of bypassing protective layers by lateral low into karst ponors is highly sensitive to the correct identiication of urban features generating surface runoff. The inal groundwater vulnerability map shows highest vulnerability around karst outcrops. Also sealed areas in the catch-ment of sinking streams are assigned a high groundwater vulnerability class due to the risk of bypassing protecting layers via surface runoff into karst sinks. A better identiication of areas with high surface runoff using current and high resolution land use data will probably increase the mapped groundwater vulnerability for the karst area.
Since the input parameters for the estimation of mass resources are associ-ated with high insecurity, the resulting op-timality values “thickness of overburden”, “resource thickness” and “accessibility of limestone resources” also have to be interpreted with care. Nevertheless, it is
dificult to achieve a higher data qual-ity. The necessary effort is very high and requires many and well distributed drill-holes in the study area.
The agricultural value shows soils with highest natural fertility in the karst area, especially near doline bottoms. Thus, the most favorable areas for agriculture are lat lowlands on carbonates.
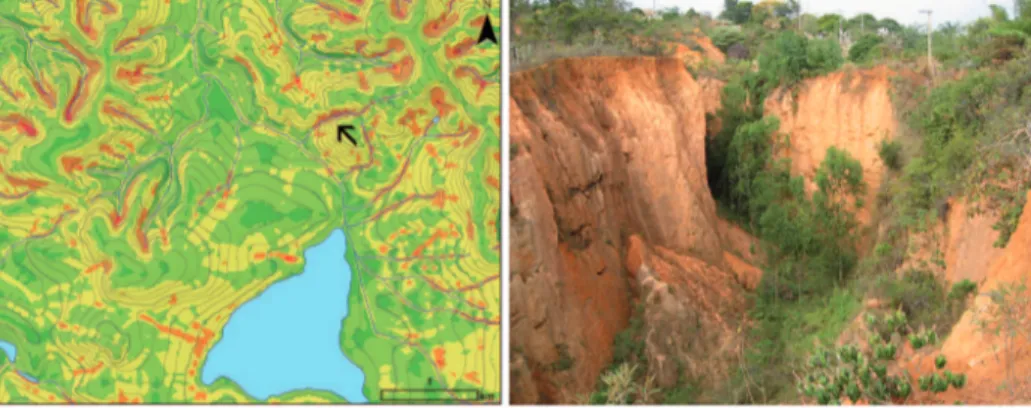
The resulting gully erosion hazard map correctly identiies existing erosion features (Figure 6) but also shows areas that are probably vulnerable to gully propagation if concentrated overland low is generated, e.g., by inadequate urban-ization structures. Still, for a statistically sound evaluation of the method, more ield studies are needed.
Risk of surface water contamina -tion by rain-wash is only estimated by the downhill-distance to the next water course, independent of possible polluting sources. If a polluting source is identiied, this map, together with a map of rainfall intensity distribution, yields information how quickly the pollutant can reach the next water course.
Figure 6 Detail of the gully erosion hazard map near Lagoa Santa (Hofmann 2014). The scale ranges from 0 (low risk) to 1 (very high risk). The arrow indicates the location of one of the largest gullies in the region (photo on the right).
4. Conclusion
For the current project, a structured worklow has been created, which resulted in over 90 consistent thematic maps out of a very heterogeneous database. These maps can be interpreted as a digital atlas of geo-potentials for the region around La-goa Santa. They represent visualizations of complex topics that are understandable as single maps but yield more comprehensive information as a set. The relatively high number is due to the fact that most inter-mediate results of long worklows are also displayed as maps. This offers the possibil-ity for a visual check of the integrpossibil-ity and plausibility of the calculations.
One of the major problems in the project was the scarce database that often required rough assumptions for the region-alization of parameters. Next to a ield vali-dation that checks the regionalization rules by systematic analysis, a classiication of recent high resolution land use data would be an ideal supplement to the current work.
When accepting these uncertainties, the gain of information availability and its spatial display in the form of maps make this knowledge accessible to a larger group of stakeholders and thus favor its active incorporation in land use planning.
Using this atlas, new combinations
of geo-scientiic parameters can be created for speciic projects. This overlay is done most easily in a GIS environment but it is also possible using the analogous print version of the maps, for example for a irst overview or in discussion groups.
References
BACELLAR, L. D. A. P., COELHO NETTO, A. L., LACERDA, W. A. Con
-trolling factors of gullying in the Maracujá Catchment, Southeastern Brazil.
Earth Surface Processes and Landforms, v. 30, n. 11, p. 1369-1385, 2005.
DOI: 10.1002/esp.1193.
CPRM Caracterizacão pedológica. Informações básicas para a gestão territorial: Região de Sete Lagoas – Lagoa Santa. Belo Horizonte: CPRM/CETEC, 1994.
(Série Projeto VIDA).
GOLDSCHEIDER, N. Hydrogeology and vulnerability of karst systems –
examples from the northern Alps and Swabian Alb. Karlsruhe: Fakultät für
Bio- und Geowissenschaften, Universität Karlsruhe KIT, 236 p, 2002. (PhD Thesis). http://nbn-resolving.org/urn:nbn:de:swb:90-AAA18120022 .
GOLDSCHEIDER, N., KLUTE, M., STURM, S., HÖTZL, H. The Pi method–a
GIS-based approach to mapping groundwater vulnerability with special con-sideration of karst aquifers. Zeitschrift für angewandte Geologie, v. 46, n. 3, p. 157-166, 2000.
HOFMANN, M. GIS-based analysis of geo-potentials for a tropical metropo-litan area: the northern periphery of Belo Horizonte (Minas Gerais, Brazil).
Darmstadt: Institut für Angewandte Geowissenschaften, TU Darmstadt, 465 p., 2014. (PhD Thesis). http://tuprints.ulb.tu-darmstadt.de/4152.
HOFMANN, M., BÜCHI, A., HOPPE, A., HORNUNG, J., KARFUNKEL, J., PAGUNG, R. Resources for a growing city - sand extraction north of Belo
Horizonte (Brazil). Neues Jahrbuch für Geologie und Paläontologie -
Abhan-dlungen, v. 253, n. 1, p. 61-78, 2009. DOI:
10.1127/0077-7749/2009/0253-0061.
HOFMANN, M., HOPPE, A., KARFUNKEL, J., BÜCHI, A. Regionalizing hydrological soil properties in the Brazilian Cerrado region using a semantic import model approach. In: LANNON E. C.(Ed.). Catchments:
Classiica-tion, modelling and environmental assessment. New York: Nova Publishers,
2013. p. 59-108. Available online: https://www.novapublishers.com/catalog/ product_info.php?products_id=44565.
HOPPE, A., LANG, S., LERCH, C., MARINONI, O. Geology and a spatial
decision support system for the surroundings of urban areas: an example from Southern Hesse (Germany). Zeitschrift der Deutschen Gesellschaft
für Geowissenschaften, v. 157, n. 1, p. 135-145, 2006. DOI:
10.1127/1860-1804/2006/0157-0135.
KOHLER, H. C. Geomorfologia cárstica na região de Lagoa Santa, MG. São
Paulo: Universidade de São Paulo, 1989. 113 p. (PhD Thesis).
KOHLER, H. C., KARFUNKEL, J. The Quartenary morphogenesis of the Lagoa
Santa tropical karst, Minas Gerais State, SE Brazil. Theoretical and
Ap-plied Karstology, v. 15, n. p. 93-99, 2002.
LAMELAS, M. T., MARINONI, O., HOPPE, A., RIVA, J. Comparison of mul -ticriteria analysis techniques for environmental decision making on industrial
location. In: JAO E. C. (Ed.). Decision Support Systems. Rijeka: InTech, 2012.
p. 197-222. DOI: 10.5772/51222. Available online: http://www.intechopen. com/books/decision-support-systems_2012/comparison-of-multicriteria--analysis-techniques-for-environmental-decision-making-on-industrial-loca .
LEHNÉ, R. J., HOSELMANN, C., HEGGEMANN, H., BUDDE, H., HOPPE,
A. Geological 3D modelling in the densely populated metropolitan area
Frank-furt/Rhine-Main. Zeitschrift der Deutschen Gesellschaft für
Geowissens-chaften, v. 164, n. 4, p. 591-603, 2013. DOI: 10.1127/1860-1804/2013/0051.
MARINONI, O., HOPPE, A. Using the analytical hierarchy process to sup -port sustainable use of geo-resources in metropolitan areas. Journal of
Sys-tems Science and SysSys-tems Engineering, v. 15, n. 2, p. 154-164, 2006. DOI:
10.1007/s11518-006-5004-8.
PARIZZI, M. G., SALGADO-LABOURIAU, M. L., KOHLER, H. C. Genesis
and environmental history of Lagoa Santa, Southeastern Brazil. The Holoce-ne, v. 8, n. 3, p. 311-321, 1998. DOI: 10.1191/095968398670195708.
QI, F., ZHU, A., HARROWER, M., BURT, J.E. Fuzzy soil mapping ba sed
45
DOI: 10.1016/j.geoderma.2006.06.001
SAATY, T. L. A scaling method for priorities in hierarchical structures. Journal of
Mathematical Psychology, v. 15, n. 3, p. 234-281, 1977. DOI:
10.1016/0022-2496(77)90033-5.
SCHÖLL, W.U. Der südwestliche Randbereich der Espinhaço-Zone, Minas Ge -rais, Brasilien. Geologische Rundschau, v.61, n.1, p. 201-216, 1972.
SCHÖLL W.U. Sedimentologie der Bambuí-Gruppe im SE-Teil des São Francisco
Beckens (Minas Gerais, Brasilien). Münster. Forsch. Geol. Paläont, n.31/32, p.71-91, 1973.
SHINZATO, E., LUMBRERAS, F. Caracterização pedológica e mapa
semi-detalhado de solos da Apa Carste de Lagoa Santa – MG. Belo Horizonte: