Lucas Roquete
Professor Assistente
Universidade Federal de São João del-Rei – UFSJ Departamento de Tecnologia em Engenharia Civil, Computação e Humanidades
Ouro Branco – Minas Gerais – Brasil [email protected]
Arlene Maria Cunha Sarmanho
Professora Titular
Universidade Federal de Ouro Preto – UFOP Escola de Minas
Departamento de Engenharia Civil Ouro Preto - Minas Gerais – Brasil [email protected]
Ana Amélia Oliveira Mazon
Professora
Universidade Federal de São João del-Rei – UFSJ Departamento de Tecnologia em Engenharia Civil, Computação e Humanidades
Ouro Branco – Minas Gerais – Brasil [email protected]
João Alberto Venegas Requena
Professor
Universidade de Campinas – Unicamp
Faculdade de Engenharia Civil, Arquitetura e Urbanismo Departamento de Estruturas
Campinas – São Paulo – Brasil [email protected]
Influence of shear lag
coefficienton circular
hollow sections with
bolted sleeve connections
Abstract
The circular hollow sections (CHS) are being widely employed in steel struc-tures around the world, increasing the development of new researches. This article proposes an innovative connection model for circular hollow sections that facilitates and reduces the assembly cost of hollow section structures. The proposed connection is a tube sleeve, used to splice two tubes, composed of an inner tube with a diameter smaller than the connecting tubes, which is connected to the outer tubes by bolts passing through both tubes. This connection can be a cheaper and easier alternative to lange connections, which are widely used in large span tubular trusses. The con-nection was tested in laboratory under tension loading. The tests made it possible to identify the inluence of stress distribution on tubes and the need for the use of a shear lag coeficient. The results of the ultimate load capacity demonstrated the viability of the tube sleeve connection use.
Keywords: steel structures, circular hollow sections, connections and bolt connection.
http://dx.doi.org/10.1590/0370-44672014700220
Civil Engineering
Engenharia Civil
1. Introduction
Steel tubular structural sections allow a higher load capacity for axial force, and torsion as well as for com-bined effects. Recommendations for the use of circular hollow sections are generally based on CIDECT (2008). Many researches have been performed in order to develop new techniques and propose solutions for the proper use of these sections as seen in works done by Munse and Chesson (1963), Beke and
Kvocak (2008), Martinez-Saucedo and Packer (2009), Freitas and Requena (2009), and others.
Square hollow sections (SHS), rectangular hollow sections (RHS), and circular hollow sections (CHS) are the tubular sections found in the mar-ket. This article deals with steel CHS submitted to tensile force with bolted connections. The connection is studied for use in a truss system. Differently
from the tubular sections with lange studied by McGuire (1968), shown in Figure 1(a), the continuity of the proile is by a sleeve connection, which pres-ents a much more elegant appearance and allows the use of standardized elements, as shown in Figure 1 (b). This new type of connection has been studied by Vieira et al. (2011), Silva
(2012) and Amparo (2014), Amparo
394
Figure 1
Tubular connections.
The sleeve connection is consti-tuted by two tubes of the same diame-ter (oudiame-ter tubes) connected by another tube with smaller diameter and bolts (inner tube), Figure 1 (c). This type
of connections transfers the loading from the tube by its contact with the bolt. This characteristic shows the presence of the shear lag coeficient indicated by the high stress
concentra-tion on the region of the cross-secconcentra-tion area with holes. This work shows one study about the inluence of the shear lag coefficient in CHS with sleeve connection.
(a) (b) (c)
2. Materials and methods
To represent the connection, the prototypes are formed by an outer tube and an inner tube (sleeve) with aligned and crossed bolts. The prototypes were
tested under tension in a controlled servo-hydraulic press with 200kN of capacity. An LVDT (Linear Variational Displacement Transducer) and strain
gauges were used for the test instrumen-tation. Figure 2 shows the general scheme of the experiment.The displacement rate used was set to 0.4 mm/min.
Figure 2
Scheme of the prototypes and the experi-ment: (a) aligned bolts; (b) crossed bolts; (c) prototype in the servo-hydraulic press.
(a)
(b)
(c)
The prototypes have geometric property variations: thickness and diam-eter. Therefore they were separated into 3
groups, as shown in Table 1. Each group had a variation in the number of bolts. Group A has prototypes with staggered
bolts and groups B and C are prototypes with crossed bolts. X and Y is the steel resis-tance of outer and inner tube, respectively.
Gr
oup Prototypes
identification
Pr
ototypes Number
s
Bolts Number
s
Outer tube Inner tube
Diamet
er (mm)
Thickness (mm)
Steel Resistance
Diamet
er (mm)
Thickness (mm)
Steel Resistance yielding ultimate yielding ultimate
fy (MPa)
fu (MPa)
fy (MPa)
fu (MPa) A LA-3-X3Y2 1 3 73.0 5.5 399.5 539.5 60.3 5.5 381.0 479.0 LA-4-X3Y2 2 4 73.0 5.5 399.5 539.5 60.3 5.5 381.0 479.0 B CB-3-X2Y3 4 3 76.1 3.6 386.0 545.0 60.3 3.6 424.0 535.0 CB-4-X2Y3 3 4 76.1 3.6 386.0 545.0 60.3 3.6 424.0 535.0
C CC-5-X2Y3 2 5 88.9 5.5 375.0 474.0 73.0 5.5 399.5 539.5 Table 1Identification of the groupof prototypes.
After experimental analysis, it was observed that in some prototypes, the bolts showed a lexural mode. In some cases the limit state of bolt bending is dominant, and not the yielding of the gross section nor the fracture through the effective net area, group A. More details
are shown in Amparo et al. (2014) and
Amparo (2014), including one expression for the bolt bending failure.
The gross area and net area were calculated considering the tubular section as a rectangular prismatic bar (rectangular plate). The net area is
(a) (b)
Figure 3 Configurations used to calculate
the gross area and the net area, (a) aligned bolts and (b) crossed bolts.
The effective net area (Ae) is calculated according to Equation 1:
A
e=C
tA
n (1)The value considered for the shear lag coeficient(Ct) was equal to 1.0 for the
calculation of theoretical values.
Table 2 shows the expressions used
to calculate the failure modes and the theoretical values adapted according to Brazilian code ABNT NBR:2008, using Ae as shown in Equation 1. The failure
modes werethe yielding of the gross sec-tion (Y.G.S. - Nt), the fracture through the
effective net area (F.N.A. - Nt), and the
shear failure of bolt (S.B. - Fv).
Table 2 Equations of modes of failure and theoretical values according to ABNT (2008).
Modes of failure Equation
Prototype
Modes of failure Y.G.S. Nt=Ag fy Y.G.S. F.N.A. S.B. F.N.A. Nt=Ae fu
Nt (kN) Nt(kN) Fs (kN) S.B. Fv=0,4 Abfub
Ag is the gross area; fy is the yielding resistance; LA-3-X3Y2 360.8 378.2 313.5
Ae is the effective net area; LA-4-X3Y2 360.8 378.2 418.0
An is the net area; fu is the ultimate resistance; CB-3-X2Y3 271.9 259.3 313.5
Ab is the bolt gross area; CB-4-X2Y3 271.9 259.3 418.0
fub is the ultimate resistance of the bolt. CC-5-X2Y3 466.0 498.0 522.5
3. Results and discussion
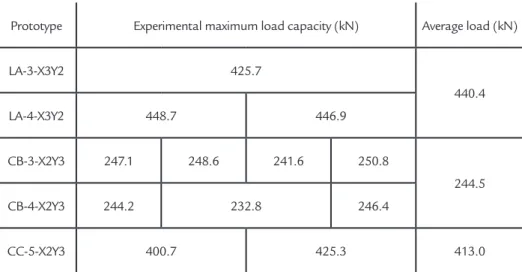
Table 3 shows the experimental maxi-mum load capacity and the average load of
the experimental maximum load capacity for all of the prototypes of each group.
Prototype Experimental maximum load capacity (kN) Average load (kN) LA-3-X3Y2 425.7
440.4 LA-4-X3Y2 448.7 446.9
CB-3-X2Y3 247.1 248.6 241.6 250.8
244.5 CB-4-X2Y3 244.2 232.8 246.4
CC-5-X2Y3 400.7 425.3 413.0
Table 3 Experimental maximum load capacity.
The Figure 4 shows the curves of tension load (P) versus displacement for
3 prototypes of the group A. It was
pos-sible to observe that the load capacity of these prototypes was above the theoretical yielding gross section and the fracture
396
Figure 4
Curves of tension load (P) versus displacement, prototypes of group A.
The average load correspond-ing to the fracture of the prototypes of the group A was 440.4kN (Table 3), 16.45% higher than the expected theoretical value (Table 2). Changes in the experimental curve slopes
char-acterize the different failure modes. In this group, the bending in bolts was the irst failure mode of the connection, observed experimentally.
In the prototypes of the groups B and C, which have a sleeve connection with
crossed bolts, the experimental load failure mode in the net area had a lower value than the theoretical load, as shown in Figure 5(a) and (b). Figure 5 shows the curves of tension load (P) versus displacement for the prototypes of groups B and C, respectively.
Figure 5
Curves of tension load (P)
versus displacement: (a) prototypes of group B;(b)prototypes of group C.
(a)
The prototypes of the group B had the average load value correspond-ing to the fracture equal to 244.5kN (Table 3). This value is 10.08% lower than the expected theoretical value (Table 2). Meanwhile, for the prototypes of group C, the average load value corresponding to the fracture was equal to 413.0kN (Table 3), 17.07% lower than the expected theoretical value.
The prototypes of groups B and C
had a different behaviour compared with the prototypes of group A; all experi-mental curves of tension load (P) versus
displacement were below the theoretical values. In these prototypes, the value 1.0 was used as the shear lag coeficient. So, it is necessary to adopt a value that reduces the net area of the effective net area, im-proving the results.
The international standards do not provide a shear lag coeficient for this
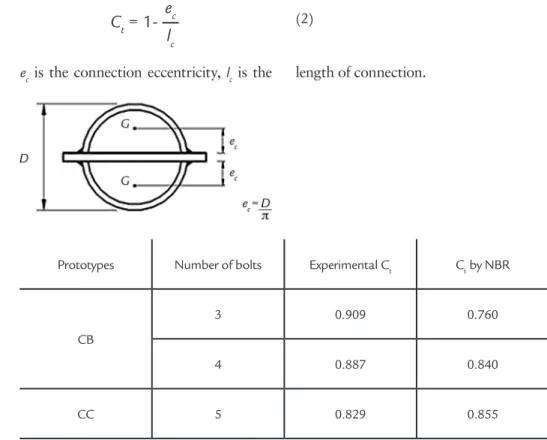
type of connection given by the eq. (2). This equation was proposed by AISC (2005) and ABNT NBR 8800:2008 for a slotted tube connected to a gusset plate, (Figure 6), adapted to sleeve connections. Table 4 shows the experimental shear lag coeficient determined by dividing the average value for the experimental load corresponding to the fracture by the net area and the ultimate stress of the inner tube (tube where the fracture occurred).
C
t= 1-
e
cl
c(2)
where: Ct is the shear lag coeficient, ec is the connection eccentricity, lc is the length of connection.
Figure 6 Representation of
value ec in tubular section.
Table 4
Shear lag coefficients (Ct).
Prototypes Number of bolts Experimental Ct Ct by NBR CB
3 0.909 0.760 4 0.887 0.840 CC 5 0.829 0.855
The prototypes with crossed bolts do not have a geometric coniguration equal to the model presented by ABNT NBR 8800:2008 (Figure 3 (b) and Figure 6).
Consequently, the stress distribution is dif-ferent in these prototypes. This fact could explain the differences shown in Table 4 between the experimental Ct and the Ct by
NBR. However, the use of the equation proposed by AISC (2005) and ABNT NBR 8800 (2008) provides conservative results and therefore is reliable.
4. Conclusions
The goal of this work was perform theoretical and experimental evaluations of the inluence of the shear lag coeficient on the new connection known as sleeve connection. This connection is constituted by steel hollow sections, and the proto-types were formed by two tubes, the outer tube and the inner tube, connected with aligned bolts or crossed bolts in 90º. The inner tube represented the sleeve.
The theoretical analysis of the modes of failure was based according to ABNT NBR 8800:2008, and the
consideration of the shear lag coeficient (Ct) was based on the equation proposed
by AISC (2005) and NBR.
The methodology used in the ex-periments was adequate to evaluate the new connection. For group A, the ex-perimental results were good and showed high capacity load resistance, while the lexural failure mode was dominant, and the Ct=1.0. It was observed that the
fracture through the net area, in the prototypes with crossed bolts, needs to consider a coeficient that reduces this
net area to an effective net area, since the fractures occurred at levels below the load stipulated as standard.
The international and national standards do not yet include the sleeve connections. The results and the analy-ses proved the need and suitability of a formulation for the calculation of the shear lag coeficient for crossed bolts. Thus, an equation based in AISC/NBR to calculate the Ct, was proposed. The
results showed good correlation with the experimental results.
Acknowledgments
398
References
ABNT NBR 8800/2008: Projeto de Estrutura de Aço e de Estrutura Mista de Aço e Concreto de Edifícios. Associação Brasileira de Normas Técnicas, Rio de Janeiro, 2008.
AMERICAN INSTITUE OF STEEL CONSTRUCTION – AISC. Speciication for
Structural Steel Buildings. Manualof Steel Construction, Chicago, 2005.
AMPARO, L. R. Análise teórico-experimental de ligações tipo luva em peris tubula-res com parafusos em linha e cruzados. Ouro Preto: Universidade Federal de Ouro Preto, 2014. (Dissertação de Mestrado).
AMPARO, L. R., FREITAS, A. M. S., REQUENA, J. A. V., ARAÚJO, A. H. M. The-oretical and experimental analysis of bolted sleeve connections for circular hollow sections. Napoles, Italy, Eurosteel, 2014.
BEKE, P., KVOCAK V. Analysis of joints created from various types of sections. Graz, Autria, Eurosteel, 2008.
CIDECT, Design Guide for Circular Hollow Section (CHS) Joints Under
Predominantly Static Loading. Köln:Verl. TÜV Rheinland, 2008.
FREITAS, A. M. S., REQUENA, J. A. V. LIGAÇÕES EM ESTRUTURAS ME-TÁLICAS TUBULARES. In: KRIPKA, M., CHAMBERLAIN, Z.M (ORG.). UPF Editora, 2009, 221p. cap. 1, p. 7-29. (Novos Estudos e pesquisas em construção metálica).
MARTINEZ-SAUCEDO, G. E PACKER, J.A. Static design recomendations for slotted end HSS connections in tension. Journal of Constructional Steel
Research, v. 135, n. 7, p. 797-805, 2009.
MCGUIRE,W. Prentice-Hall International Series in theoretical and applied M mechanics, Englewood Cliffs, N.J.: Prentice-Hall, 1968.
MUNSE, W. H., CHESSON, E. Jr. Riveted and bolted joints: net section design.
Journal of Structural Division, ASCE, v. 89, p. 107-126, 1963.
SILVA, J. M. Análise teórica-experimental de ligações tipo tubulares tipo "luva".
Ouro Preto: Universidade Federal de Ouro Preto, 2012. (Dissertação de Mestrado). VIEIRA, R. C., VIEIRA, R. F., REQUENA, J. A. V., ARAÚJO, A. H.M.
Numerical analysis of CHS bolted sleeve connections. Budapest, Hungary,
Eurosteel, 2011.