67
Abstract
It is well known that the culture conditions of microorganisms may affect their sur-face properties, zeta potential and hydrophobicity via the modiication of the cell wall functional groups or metabolic products. The R. opacus bacteria strain was separately
adapted to the presence of apatite and quartz, after which a cellular adaptation procedure was developed by repeated sub-culturing with a successive increase in the mineral content. Zeta potential, surface tension, FTIR and microlotation studies were used to evaluate the behavior of the cells that were developed under deined culture conditions. The cellular ad-aptation induced a modiication of the bacterial surface charge. The FTIR results showed a modiication of its functional groups. The surface tension results suggested that longer growing time promoted a higher production of metabolites. The use of mineral-adapted cells promoted an improvement in the lotability of both minerals, but it was more signii-cant for apatite lotation. Additionally, the mineral lotability remained unchanged when the cells developed under a longer culture time. Nevertheless, there was a reduction in the surface tension.
Keywords: Rhodococcus opacus; biolotation; cellular adaptation; apatite; quartz.
Antonio Gutiérrez Merma
Pesquisador
Pontifícia Universidade Católica do Rio de Janeiro - PUC - RJ Departamento de Engenharia Química e de Materiais Rio de Janeiro - Rio de Janeiro - Brasil
Ronald Rojas Hacha
Doutorando
Pontifícia Universidade Católica do Rio de Janeiro - PUC - RJ Departamento de Engenharia Química e de Materiais Rio de Janeiro - Rio de Janeiro - Brasil
Maurício Leonardo Torem
Professor
Pontifícia Universidade Católica do Rio de Janeiro - PUC - RJ Departamento de Engenharia Química e de Materiais Rio de Janeiro - Rio de Janeiro - Brasil
Cellular Adaptation: Culture
conditions of
R. opacus
and
bioflotation of apatite and quartz
Mining
Mineração
http://dx.doi.org/10.1590/0370-446720167000063
1. Introduction
Studies on the application of biotechnology in mineral processing have intensiied in recent years. One of the principal motivations is to reduce the environmental impacts caused by the use of conventional lotation re-agents (Rao and Subramanian, 2007). The biolotation technique is in the fundamental stage, and considerable research is still necessary before its industrial application. A fundamental biolotation study should determine the response of each mineral that is present in an ore. Thus, considering that phosphate ores are associated with several gangue minerals, especially quartz, carbonates and silicates, then a detailed biolotation study of each component is necessary to establish the biolotation of phosphate ores. One bacteria, quite recently used in mineral
biolotation, is Rhodococcus opacus
(Botero et al., 2007; Mesquita et al.,
2003; Botero et al., 2008; Merma et
al., 2013). It is a Gram positive
bac-terium with different types of com-ponents on their cell-wall, which are primarily polysaccharides, carboxylic acids, lipid groups and mycolic acids, that result in amphoteric behavior (hydrophobic and/or hydrophilic prop-erties) of the bacteria (Mesquita et al.,
2003; Natarajan, 2006; Vilinska and Rao., 2008). According to Natarajan (2006), the presence of these compo-nents produces a selective behavior in the bacteria. Moreover, their produc-tion can be modiied, rendering some bacteria more hydrophobic or even more selective. This modiication can be performed through “cellular adap-tation” or via genetic modiications. Thus, cellular adaptation in mineral bioprocessing has been the focus of some studies (Sharma et al., 2001;
Sub-ramanian et al., 2003; Sarvamangala
and Natarajan, 2011; Sarvamangala et
al., 2012; Vasanthakumar et al., 2013;
Sarvamangala et al., 2013). However,
to our knowledge, there is no study on
the cellular adaptation of R. opacus
bacteria to a mineral substrate. In mineral bioprocessing, the “cellular adaptation” of a microor-ganism refers to the growing of its cells in the presence of a mineral substrate. Some authors
(Subrama-nian et al., 2003; Vasanthakumar et
al., 2013; Sarvamangala et al., 2013)
have suggested that cellular adapta-tion can produce changes in bacterial morphology, in addition to quantita-tive and qualitaquantita-tive modifications during the secretion of biopolymers, which primarily constitute proteins and polysaccharides, during their growth. Therefore, the objective of this work is to study the effect of the different culture conditions of the
Rhodococcus opacus in the
68
2. Material and methods
2.1 Sample preparation
This study used a pure quartz sample and a fluorapatite sample
(42.33% P2O5 and 54.39% CaO)
that were provided by a local supplier (Belo Horizonte, Minas Gerais State) to be used in this study. The samples were crushed and screened to -3 mm.
Then, the samples were dry-ground in a porcelain mortar and wet-screened. Afterwards, the desired size fractions (+20-38; +75-106) in µm were sepa-rated. Then, the quartz sample rested in a KOH (0.1 M) solution for 24 hours to remove the impurities present on the
surface. The samples were washed sev-eral times with double-distilled water and milli-Q water until the pH suspen-sion achieved the initial pH. Finally, the quartz and apatite samples dried at room temperature and were stored in a desiccator.
2.2 Microorganisms, media and growth
The Rhodococcus opacus strain
(CBMAI 812) was supplied by The Chemical, Biological and Agricultural Plu-ridisciplinary Research Center (CPQBA) and was developed in a YMG solid me-dium containing the following: 10.0 g L-1
glucose, 5.0 g L-1 peptone, 3.0 g L-1 malt
extract, 3.0 g L-1 yeast extract, and 12 g L-1
agar-agar. Stocks of the bacteria were pre-pared frequently using this medium in
Pe-tri plates and they were stored in a freezer at 12 °C. Then, the cells were sub-cultured in an YMG liquid medium containing 10.0 g L-1 glucose, 5.0 g L-1 peptone,
3.0 g L-1 malt extract and 3.0 g L-1 yeast
extract at pH 7.2. They were placed in a rotary shaker at 140 rpm and 28 °C for 48 h. Afterwards, the bacterial cells were separated from the culture by centrifug-ing at 3500 rpm for 8 min, followed
by re-suspending twice with deionized water. Then, the cells were re-suspended in a 10-3 M NaCl solution. Finally, the
bacterial concentrate was inactivated in an autoclave for 20 minutes to avoid further development of the bacteria. The bacte-rial concentration of the suspension was measured using a spectrophotometer (UV-1800, Shimatzu UV-spectrophotometer) at a wavelength of 620 nm.
2.3 Cellular adaptation
The adaptation of R. opacus was
performed via repeated sub-culturing, in which 10 mL of the strain was in-oculated into 190 mL of YMG liquid medium. This was in the presence of incremental increases in the mineral content (quartz or apatite), which was prepared in a 250-mL Erlenmeyer lask
and incubated at 28 °C on a rotary shaker at 140 rpm. Initially, the sub-culturing started with only 1% pulp density; then, the pulp density was suc-cessfully increased during subsequent sub-culturing until achieving 5 wt. % of the mineral. The cellular adapta-tion was considered achieved when the
growth curve of the adapted strain was identical to that of the control (grown curve of the unadapted bacteria). This adaptation procedure was performed in the presence of quartz and apatite separately. After this cellular adapta-tion, the adapted-cells were washed and concentrated as described in section 2.2.
2.4 Composition of bacterial cell wall
The bacterial cell wall components were extracted using the Cammarota method. The components associated with the cell wall were extracted with 0.01 M phosphate buffer solution at pH 7. A mixture of 50% bacterial suspension and
50% EDTA 2% was prepared. This solu-tion was refrigerated for 4 h at 4°C; then it was centrifuged and the supernatant was collected. This extraction method was applied in a previous work (Botero et al., 2008); however, the complete method
was described by Cammarota (1998). The cell wall-associated polysaccharides were measured using the Antrona method (Yemn and Willis, 1954), and the cell wall-associated proteins were measured using the Biureto method (Stickland, 1951).
2.5 Zeta potential studies
The Zeta potential measurements for the R. opacus cells were conducted in
a micro-electrophoresis apparatus, “Zeta-sizer Nano” - Malvern. The concentration
of the biomass suspension was 50 mg L-1,
and a NaCl 10-3 M solution was used as
an indifferent electrolyte. The pH was ad-justed using the HCl and NaOH solutions.
The evaluation of the zeta potential pro-iles for the R. opacus cells was conducted
before and after cellular adaptation to the mineral substrate.
2.6 Fourier Transform Infrared Spectroscopy (FTIR)
Infrared absorption spectra were recorded on a FTIR Thermo-Nicolet 6700 spectrophotometer. The data acquisition was conducted in trans-mission mode. The spectra of the
R. opacus bacteria before and after
cellular adaptation were evaluated. The cell suspension samples were washed and lyophilized. Then, the lyophilized sample was properly mixed with
spec-troscopic grade KBr (1:100) and pressed into pellets to record the spectra, which was collected after 120 scans
at 4 cm-1 in the frequency range of
4000 cm-1 – 400 cm-1.
2.7 Surface tension measurements
The surface tension measure-ments of the bacterial suspension were performed using the ring method in a Kruss K10 digital tensiometer with
an accuracy of ± 0.1 mN m-1. The
surface tension measurements were conducted during the bacterial devel-opment and at different times and as
69
2.8 Microflotation experiments
The flotability of the minerals
was evaluated in a modiied Hallimond
tube (Merma, 2012). Approximately 1.0 g of mineral was added to a 0.16 L total volume suspension of known bacterial concentration. The mineral
was conditioned with the bacterial suspension at a desired pH value inside the Hallimond tube under constant
stirring for 5 minutes. Finally, the mi-crolotation tests were conducted using air at a low rate of 15 ml min-1 for 2
min. The settled and loated fractions were carefully separated, washed, dried and weighed. The lotability was then calculated as the ratio of loated and non-loated mineral amounts to the total weighed sample.
3. Results and discussion
The microorganism culture condi-tions can affect the morphology, struc-ture and composition of the bacterial cell wall and of metabolic products and therefore affect their surface char-acteristic (Natarajan, 2006; Natarajan
and Deo, 2001; Amézcua-Vega et al.,
2007) as electrophoretic behavior, hy-drophobic properties and, consequently, their response to mineral lotation. The
cell shape is generally characteristic of each bacterial strain, but this can vary depending on the growth conditions. In previous studies (Mesquita et al., 2003;
Merma et al., 2013), it was observed
that the R. opacus cells had a “coccus”
shape at the lag phase and at the begin-ning of the exponential phase; how-ever, in the stationary phase, the cells presented a bacillus-shape. Although,
the modification of the morphology of the cells occurs along the culture, it was observed that their hydrophobicity did not present any signiicant change, preserving a contact angle value of ap-proximately 75°. This result could be an indication that the culture time does not affect the composition of the bacterial cell wall, even when their morphology is affected.
3.1 Zeta potential studies
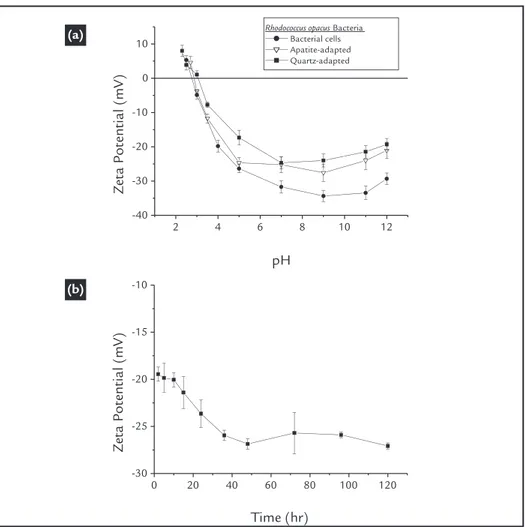
Any changes in the cell surface charge may be related to modiications in the bacterial cell wall functional groups. Fig. 1(a) shows the zeta potential of the microorganism at different pH values. Initially, we observed an isoelectric point (IEP) of approximately 2.8, as found in previous works (Botero et al., 2007,
2008; Mesquita et al., 2003; Merma et
al., 2013). According to several authors
(Rao and Subramanian, 2007; Natarajan, 2006; Vilinska and Rao., 2008; Faharat
et al., 2008; Van Der Wal et al., 1997),
this acidic value is related to the higher presence of anionic functional groups compared with cationic groups. We also observed a singular effect: above pH 9, the zeta potential values of the cells
system-atically shifts to more positive values (as the pH shifts to more basic values). This particularity is attributed to an increase in ionic strength due to the addition of NaOH, which was done to raise the pH above 9. That would cause a compression of the electrical double layer, and thus, a reduction of the absolute value of the zeta potential (Mozes et al., 1998).
Figure 1 Zeta potential of cells (a) before and (b) after adaptation as a function of the culture time.
(a)
70
Surface tension measurements that are associated with the bacterial growth curve can help elucidate any production of biosurfactants (Didyk and Sadowski, 2013) and/or metabo-lites or even any modiication of the bacterial surface. Initially, a reduction in the surface tension is related to an
increase in the bacterial concentration. When the stationary phase of growth is achieved, the surface tension val-ues should remain constant, and any reduction in the tension values may be related to metabolic production, as described by Didyk and Sadowski (2013). These results are observed in
Fig 2a, in which the surface tension of the culture broth (cells in the culture medium) and free-cells suspensions (cells separate from the culture) were measured. The irst could determine the metabolite production, and the second could elucidate any modiica-tion of the bacterial cell wall.
Figure 2
a) Growth curve and surface tension of the R. opacus bacteria as a function of time. b) Surface tension measurements of the R. opacus suspensions before and after adaptation to the mineral substrate.
A continuous reduction in the sur-face tension values of the culture broth after the stationary phase is achieved, may be considered an indicator of the production of metabolites that are able to reduce the surface tension, such as biosurfactants (Didyk and Sadowski, 2013). It is also observed that the surface
tension of the free-cells suspensions pre-sented a constant value (approximately 57 mN/m) as a function of time, sug-gesting that a longer culture time did not cause any modiication on the bac-terial surface, and if metabolites were produced, they probably were expelled to the medium.
Furthermore, a comparative analysis of the surface tension of the free-cell sus-pensions before and after cellular adapta-tion could reveal if “cellular adaptaadapta-tion” promoted any modiication on the bacte-rial cell wall. The surface tension proile of the bacterial cells as a function of pH is shown in Fig. 2b. The surface tension
0 20 40 60 80 100 120
45 50 55 60 65 70
Bacterial Conce
ntra
tion (
g L
-1 )
Surface te
nsion (
mN/m
)
Time (h)
Surface tension of bacteria during their growth Surface tension of bacterial suspension
0,0 0,5 1,0 1,5 2,0 2,5 3,0
Growth curve of R. opacus bacteria
2 4 6 8 10 12 50
52 54 56 58 60 62 64 66
Su
rf
ace
T
en
si
on
(
m
N
/m
)
pH
Unadapted Bacteria Quartz-adapted-bacteria Apatite-adapted-bacteria
3.2 Surface tension of
R. opacus
suspensions
As mentioned before, the micro-organism culture conditions affect their surface properties, and according to Natarajan (2006) the cellular adaptation may affect the surface properties of the bacterial cells, due to a modiication in the balance of anionic and cationic groups present in the cell wall components or in their metabolic products. In this work, no signiicant change in the bacterial IEP after cellular adaptation was observed (Fig.1a). However, a small change in
the zeta potential proile of the cells was observed; both mineral-adapted cells pre-sented less negative zeta potential values. These modiications may be attributed to a reduction of anionic groups or to an incre-ment of cationic groups, which could be a consequence of a lower polysaccharides production or a higher proteins produc-tion, during cellular adaptation.
Additionally, the zeta potential pro-ile of the bacteria as a function of culture time is shown in Fig. 1 (b). We observed
that the net charge exhibited a small decrease from approximately -20 mV to -27 mV during the irst 40 h. of culture, which corresponds to the beginning of the exponential phase of growth (See Fig. 2a), and then the bacterial net charge remained practically unchanged. These results sup-port the idea that the culture time may affect the morphology of the cells, but may not affect the surface properties of the cells under the conditions used in this work (see section 2.2).
(a)
71
Wave number (cm-1) Assigned functional group Reference
3500 – 3000 Hydroxyl groups (OH, NH):
polysaccharides, proteins
Schmitt et al., 1998; Deo &
Natarajan, 1988, Santhiya et
al., 2002; El-midany
Abdel-Khalek, 2014
2956 – 2850
C-H stretching mode of CH2 and
CH3: Lipids, proteins, carbohydrates,
nucleic acids
Schmitt et al., 1988; Deo &
Natarajan, 1988
1745 >C=O, ester stretching vibration Deo & Natarajan, 1988
1630, 1399 COO– Deo & Natarajan, 1988
1633 -CN3H5+, from arginine Venyaminov & Kalnin, 1990
1654 C=O from amide I: proteins Garip et al., 2009; Sharma et
al., 2001
1543 N-H, C-N from amide II: proteins Garip et al., 2009
1455 C-H from CH2 lipids El-midany & Abdel-Khalek,
2014; Garip et al., 2009
1237, 1150
P=O stretching from nucleic acid and phospholipids;
CO-O-C stretching from glycogen and nucleic acids.
Garip et al., 2009
1079
PO2– symmetric stretching in nucleic
acid and phospholipids; C-O
stretch-ing from glycogen; CH3 rocking and
CH2 wagging mode.
Garip et al., 2009; Sharma et
al., 2001
1051 C-O C-O-C from polysaccharides Garip et al., 2009
992, 801 P-O stretching : nucleic acids Garip et al., 2009
700 Dipicolinic acid (DPA),
COO– bending
Garip et al., 2009;
Deo & Natarajan 1997
600 – 800 Wagging N-H Deo & Natarajan, 1997
300 – 600 CH2 Rocking vibrations Deo & Natarajan, 1997
Table 1 Absorbance bands and the characteristic functional groups.
After the cellular adaptation, a change in the FTIR spectra of the bacterial cells was observed, which may imply that there was a modiication in the bacterial cell wall functional groups. The spectrum of the apatite-adapted bacterium is shown
in Fig. 3a. Slightly more intense bands are observed at 1455 cm-1 and at 1745 cm-1,
suggesting an increase in the content of the fatty acids and triglycerides. However, a higher intensity increment in the
spec-trum was observed between 2920 cm-1
and 2850 cm-1, suggesting an increase in
the content of lipids, proteins, fatty acids and polysaccharides; and also between 1150 and 990 cm-1, where higher signal
intensities were especially detected for the band at 1051 cm-1, which also moved to
3.3 Fourier Transform Infrared Spectroscopy (FTIR)
T h e F T I R s p e c t r a o f t h e
R. opacus cells exhibited many bands
between 400 and 4000 cm-1. The
principal bands and their respective functional groups are presented in
Table 1. The intensities of the higher bands correspond to the principal components of the bacterial wall cell, such as the proteins, fatty acids and polysaccharides. Thus, the cell surface
is partially hydrophobic and partially hydrophilic. This is a general represen-tative FTIR spectrum of the bacteria (Schmitt and Fleming, 1998; Deo and Natarajan., 1988).
of the unadapted bacterial cells decreased signiicantly below pH 7. The lowest value occurred at approximately the IEP of the microorganism (around pH 3)., where, ac-cording to Lambert et al. (2003), the best
condition to form foam using bacteria is at its IEP value, which is also important in lotation. However, above pH 7, higher surface tension values were observed,
which are not beneicial for lotation. Thus, from the results, a similar behavior could be observed for both mineral-adapted cells; an increase in the surface tension values in the acidic region and a decrease in the alkaline region. The quartz-adapted cells presented sur-face tension values between 58 and 60 mN/m for the pH scale studied, whereas
72
4000 3500 3000 2500 2000 1500 1000 500
0,0 0,5 1,0 1,5 2,0 2,5
533 573 602
698
801 1079
1043
1153 1236 1401 1454 1544 1658
1634
1742 2956 2852
2922 3298
Ab
so
rban
ce
un
it
s
Wavenumber (cm-1)
4000 3500 3000 2500 2000 1500 1000 500
0,0 0,5 1,0 1,5 2,0 2,5
450
516 609 697 718 779
799 1235 1399
14571151
1081 1544 1631 1658
1745 2853
2958 2920 3280
Ab
so
rban
ce
un
it
s
Wavenumber (cm-1)
1043 cm-1. This indicated a higher content
of phospholipids and polysaccharides. Ad-ditionally, the glycogen band (1150 cm-1)
was slightly more intense, and the weak band at 992 cm-1 was no observed after
the cellular adaptation. Finally, the bands between 609 and 573 cm-1 are relatively
weak in intensity.
Additionally, the spectrum of the quartz-adapted cells is shown in Fig. 3b.
A more intense band at 2920 cm-1 was
observed, corresponding to CH2
asym-metric stretching from lipids. Additionally, a higher intensity of the band correspond-ing to the triglycerides (1745 cm-1) was
ob-served. However, the bands corresponding to amide I (proteins) and carboxylate ions (1658 cm-1, 1633 cm-1 and 1400 cm-1)
were signiicantly reduced in intensity. Again, a higher intensity spectrum after cellular adaptation was observed for the
bands between 1150 and 990 cm-1. The
bands corresponding to nucleic acid and/ or glycogen (1151 cm-1 and 1081 cm-1)
in-creased in intensity. Finally, slightly higher intensities of several bands between 800 and 700 cm-1 were observed due to amide
IV and C=O bending in proteins (Schmitt and Fleming., 1998).
The literature review showed that
there is a lack in the characterization of mineral-adapted cells; however, Sharma
et al. (2001) studied the characterization
of P. polymyxa before and after adapta-tion to sulide minerals. According to the authors, the adaptation process caused a higher secretion of metabolites (proteins and polysaccharides), but the galena-adapted cells produced the highest amount of secretions. The FTIR spectra of the bacteria after adaptation presented some changes, and in general, higher bands were present for 3053 (amide B vibrations) 2958, and 2922 cm-1
(charac-teristic of hydrocarbon chains).
Figure 3
a) FTIR spectrum of the R. opacus bacteria adapted to apatite; b) FTIR spectrum of the R. opacus bacteria adapted to quartz.
Therefore, in our study, the cellular adaptation promoted a higher content of fatty acids, proteins, phospholipids and polysaccharides in the structure of the mineral-adapted bacteria, whereas a
lower content of proteins was observed in the quartz-adapted bacteria. This higher production of biopolymers is also shown in Table 2, and this is in accordance with related works (Botero et al., 2008;
Natarajan, 2006; Sharma et al., 2001).
Consequently, the presence of these com-ponents in the mineral-adapted bacteria will promote a higher hydrophobic and partially hydrophilic character.
(a)
(b)
Table 2
Rhodococcus opacus cell wall composition before and after cellular adaptation. Component
Concentration (µg/µL)
Before adaptation Quartz-adapted cells Apatite-adapted cells
Proteins 0.51± 0.1 0.57 ± 0.2 0.73 ± 0.1
Carbohydrates 1.45 ± 0.3 1.54± 0.14 1.60 ± 0.22
73
3.4 Microflotation experiments
The lotability of apatite and quartz (highly hydrophilic minerals) as a func-tion of pH value, using the bacterial cells and mineral-adapted cells, are presented in Fig. 4a and 4b, respectively. Before cellular adaptation, we observed that the highest lotability of both minerals was attained at pH 5. We achieved values of approximately 45% and 14% for apatite and quartz, respectively, after 2 min of lotation. Additionally, we observed that apatite can be loated at a pH range be-tween 3 and 7. However, the lotability of quartz was insigniicant for other values of pH. The use of the apatite-adapted
cells during the biolotation of apatite pro-moted a higher lotability in the pH range between 3 and 9 (Fig. 4.a). Nevertheless, a signiicant increment was only observed at pH 3, where the lotability increases from approximately 10% to 55%. However, when the quartz-adapted cells were used, the lotability of apatite only improved at pH 3 to a value of 45%. A similar behav-ior was observed during the biolotation of quartz (See Fig. 4b) in which a higher lotability of quartz was observed when the quartz-adapted cells were used. This is in accordance with lotation studies us-ing mineral-adapted bacteria (Natarajan,
2006) in which the lotability of quartz was enhanced after cellular adaptation. The improvement presented in quartz lotability was not as signiicant as in the biolotation of apatite. Additionally, the lotability of quartz was not affected when the apatite-adapted bacterium was used. This conclusion demonstrates the generation of a mineral-speciic biore-agent, which can increase the selectivity of the lotation process (Natarajan, 2006). Lastly, it is possible to identify a selectivity window to separate apatite from quartz in the pH 3, by using the apatite-adapted bacteria as collector.
Figure 4 a) Flotability of apatite using the adapted and unadapted R.opacus bacteria as a bioreagent. Bacterial concentration 0.15 g L-1. Flotation time: 2 min. b) Flotability of quartz using the adapted and unadapted R.opacus bacteria as a bioreagent. Bacterial concentration 0.15 g L-1. Flotation time: 2 min.
2 4 6 8 10 12
0 10 20 30 40 50 60
Flotab
ility (%)
pH
R. opacus cells unadapted Adapted to apatite Adapted to quartz No reagent
2 4 6 8 10 12
0 10 20 30
Flo
tab
ility
(%)
pH
R. opacus cells Unadapted Adapted to apatite Adapted to quartz No reagent (a)
(b)
Finally, the lotability of either min-eral was unaffected when the bacterial cells grown under different culture times were used. As example the lotability of apatite and quartz was around 46% and 12%, respectively, when the culture time of the bacteria was 96 h. Thus, if the metabolic products were excreted to the medium and the lotability of the minerals was not affected, the wall cell of the bacteria was not affected by the longer culture times.
Our results may suggest that higher culture times did not affect the cell
wall of the bacteria; however, a higher metabolic production into the suspension was detected, as supported by the zeta potential, surface tension and microlo-tation results. This effect was also con-irmed by Didyk and Sadoswski (2013) for the culture of Bacillus circulans and Streptomyces sp. However, the results
also showed that the cellular adaptation caused a modiication in the bacterial cell wall. A more detailed explanation of these behaviors can be found in other works (Natarajan, 2006; Sarvamangala and Natarajan, 2011; Sarvamangala et
74
a higher production of proteins on the bacterial cell wall, which will adsorb on the mineral surface, rendering it more
hydrophobic. Furthermore, this effect was more relevant during the cellular adaptation to apatite, and the proteins
produced may have a higher selectivity for the apatite surface, which will explain the microlotation results.
4. Conclusions
The zeta potential evaluation of the R. opacus before and after
adapta-tion to the presence of a mineral sub-strate showed that the bacterial cells modiied its zeta potential proiles; how-ever, no signiicant change was observed with higher culture times. Additionally, the surface tension measurements asso-ciated with the bacterial growth curve showed that higher culture times caused a higher production of metabolites, whereas the cellular adaptation may promote a modiication in the bacte-rial cell surface. Additionally, the FTIR results showed that the cellular
adapta-tion caused a modiicaadapta-tion in the bacte-rial spectra. The adaptation to apatite promoted a slight increase in the fatty acids, proteins, phospholipids and poly-saccharides. Meanwhile, the adaptation to quartz had a slightly similar effect; however, a lower content of proteins was observed. Finally, the use of min-eral-adapted bacteria as biocollectors produced an increase in the lotability of both minerals. The lotability of apatite achieved values of approximately 55% and 45% for a pH of 3 and 5, respec-tively, when apatite-adapted bacterium was used, whereas the flotability of
quartz attained an improvement only at pH 3 when the quartz-adapted bac-terium was used. However, we did not observe any change in the lotability of both minerals when the microorganism that was developed under a higher cul-ture time was used. Thus, this suggests that the lotability of both minerals can be enhanced if the microorganism is developed in a culture medium that con-tains the same mineral as the substrate. Moreover, it is possible to increase the ability of the R. opacus bacteria to act
as a biocollector of apatite due to the cellular adaptation process.
Acknowledgments
The authors acknowledge CNPq (Conselho Nacional de Desenvolvim-ento Cientíico e Tecnológico),
ITV-VA LE , CA PE S (Coordenação de Aperfeiçoamento de Pessoal de Nível Superior) and FAPERJ (Fundação
Car-los Chagas Filho de Amparo à Pesquisa do Estado do Rio de Janeiro) for their inancial support.
References
AMÉZCUA-VEGA, C., POGGI-VARALDO, H.M., ESPARZA-GARCÍA, F., RÍOS--LEAL, E., AND RODRÍGUEZ-VÁZQUEZ, R. Effect of culture conditions on fatty acids composition of a biosurfactant produced by Candida ingens and chan-ges of surface tension of culture media. Bioresource Technology, v. 98, n. 1, p. 237- 240, 2007.
BOTERO, A.E.C., TOREM, M.L., MESQUITA, L.M.S. Fundamental studies of Rhodococcus opacus as a biocollector of calcite and magnesite. Minerals Engine-ering, v. 20, n. 10, p. 1026-1032, 2007.
BOTERO, A.E.C., TOREM, M.L., MESQUITA, L.M.S. Surface chemistry funda-mentals of biosorption of Rhodococcus opacus and its effect in calcite and magne-site lotation. Minerals Engineering, v. 21, n. 1, p. 83-92, 2008.
CAMMAROTA, M.C. Exopolysaccharides production and microbial adhesion.
Rio de Janeiro: Departamento de Bioquímica, Univerdidade Federal do Rio de Ja-neiro, 1998. (Tese de Doutorado).
DEO, N., NATARAJAN, K.A. Studies on interaction of Paenibacillus polymyxa with iron ore minerals in relation to beneiciation. International Journal of Mineral Processing, v. 55, n. 1, p. 41-60, 1988.
DEO, N., NATARAJAN, K.A. Interaction of Bacillus polymyxa with some oxide mi-nerals with reference to mineral beneiciation and environmental control. Minerals Engineering. v. 10, n. 12, p. 1339-1354, 1997.
DIDYK, A.M., SADOWSKI, Z. Flotation of serpentinite and quartz using biosurfac-tans. Physicochemical Problems of Mineral Processing, v. 48, n. 2, p. 607-618, 2013.
EL-MIDANY, A.A., ABDEL-KHALEK, M.A. Reducing sulfur and ash from coal using Bacillus subtilis and Paenibacillus polymyxa. Fuel, v. 115, p. 589-595, 2014. FAHARAT, M., HIRAJIMA, T., SASAKI, K., AIBA, Y., DOI, K. Adsorption of SIP
E. coli onto quartz and its applications in froth lotation. Minerals Engineering, v. 21, p. 389-395, 2008.
75
LAMBERT, W.,D., DU, L., MA, Y., LOHA, V., BURAPATANA, V., PROKOP, A., TANNER, R., D., PAMMENT, N.B. The effect of pH on the foam fractionation of β-glucosidase and cellulase. Bioresource Technology, v. 87, p. 247-253, 2003.
MERMA, A.G. Fundamental aspects in the apatite–quartz biolotation system
usingthe R. opacus bacteria as bioreagent. Rio de Janeiro: Departamento de En-genharia Química e de Materiais, Pontifícia Universidade Católica do Rio de Janei-ro, 2012. (Tese de Doutorado).
MERMA, A.G., TOREM, M.L., MORAN, J.V., MONTE, M.B.M. On the funda-mental aspects of apatite and quartz lotation using a gran positive strain as a bio-reagent. Minerals Engineering, v., 48, p. 61-67, 2013.
MESQUITA, L.M.S., LINS, F.A.F., TOREM, M.L. Interaction of a hydrophobic bacterium strain in a hematite-quartz lotation system. International Journal of Mineral Processing, v. 71, p. 31-44, 2003.
MOZES, N., LÉONARD, A.J., ROUXHET, P.G. On the relations between the ele-mental surface compositions of yeasts and bacteria and their charge and hydropho-bicity. Biochimica et Biophysica Acta, v. 945, p. 324-334, 1988
NATARAJAN, K.A., DEO, N. Role of bacterial interaction and bioreagents in iron ore lotation. International Journal of Minerals Processing, v. 62, p. 62: 143-147, 2001.
NATARAJAN, K.A., Microbially-induced mineral lotation and locculation:
pros-pects and challenges. Proceedings of XXIII International Mineral Processing
Congress, p. 487–498, 2006.
OLIVEIRA, J.A. Saponiication degree of vegetable oils at selective lotation of apa-tite from carbonates ore. Ouro Preto: Departamento de Engenharia de Minas, Universidade Federal de Ouro Preto, 2005. (Dissertação de Mestrado).
RAO, K.H., SUBRAMANIAN, S. Biolotation and Biolocculation of relevance to
minerals bioprocessing. IN: Donati, R. E., SAND, W. Microbial processing of
metal sulides. 2007. p. 267-286.
SANTHIYA, D., SUBRAMANIAN`S., NATARAJAN, K.A. Surface chemical stu-dies on sphalerite and galena using extracellular Polysaccharides isolated from Ba-cillus polymyxa. Journal of Colloid and Interface Science, v. 256, n. 2, p. 237-248, 2002.
SARVAMANGALA, H., NATARAJAN, K.A., GIRISHA, S.T. Microbially-induced pyrite removal from galena using Bacillus subtilis. International Journal of Mine-rals Processing, v. 120, p. 15-21, 2013.
SARVAMANGALA, H., NATARAJAN, K.A. Microbially induced lotation of alu-mina, silica/calcite from haematite. International Journal of Minerals processing, v. 99, p. 70-77, 2011.
SARVAMANGALA, H., NATARAJAN, K.A., GIRISHA, S.T. Biobeneiciation of iron ores. International Journal of Mining Engineering and Mineral Processing, v. 1, v. 2, p. 21-30, 2012.
SCHMITT, J., FLEMING, HANS-CURT. FTIR-spectroscopy in microbial and ma-terial analysis. International Biodeterioration & Biodegradation, v. 41, p. 1-11, 1998.
SHARMA, P.K., RAO, K.H., FORSSBERG, K.S.E., NATARAJAN, K.A., Surface chemical characterisation of Paenibacillus polymyxa before and after adaptation to sulide minerals. International Journal of Minerals Processing, v. 62, p. 3-25, 2001.
STICKLAND, L. H. The determination of small quantities of bactéria by means of biuret reaction. J. Gen. Microbiol, v. 5, p. 698-703, 1951.
SUBRAMANIAN, S., SANTHIYA, D., NATARAJAN, K.A. Surface modiication studies on sulphide minerals using bioreagents. International Journal of Mineral Processing, v. 72, p. 175-188, 2003.
VAN DER WAL, A., NORDE, A.A.J.B., ZEHNDER, B., LYKLEMA, J. A determi-nation of the total charge in the cell walls of gram-positive bacteria. Colloids and SurfacesB: Biointerfaces, v. 9, p. 81-100, 1997.
VASANTHAKUMAR, B., RAVISHANKAR, H., SUBRAMANIAN, S. Microbially induced selective lotation of sphalerite from galena using mineral-adapted strains of Bacillus megaterium. Colloids and Surfaces B: Biointerfaces, v. 112, p. 279-286, 2013.
pep-76
tide compounds in water (H2O) solutions. I. spectral parameters of Amino Acid Residue Absorption Bands. Biopolymers, v. 30, p. 1243-1257, 1990.
VILINSKA, A., RAO, K.H. Leptosririllum ferrooxidans-sulide mineral interactions
with reference to biolotation and biolocculation. Trans. Nonferrous Met. Soc.
China, v. 18, p. 1403-409, 2008.
YEMN, E.W. WILLIS, A.J. The estimation of carbohydrate in plant extracts by an-throne. The Biochemical Journal, v. 57, p. 508-514, 1954.