59 Liliane Aparecida Silva et al.
REM: Int. Eng. J., Ouro Preto, 70(1),59-62, jan. mar. | 2017
Metallurgy and materials
Metalurgia e materiais
Abstract
The oxygen-uranium (O-U) system has various oxides, such as UO2, U4O9, U3O8, and UO3. Uranium dioxide is the most important one because it is used as nuclear fuel in nuclear power plants. UO2 can have a wide stoichiometric variation due to excess or deiciency of oxygen in its crystal lattice, which can cause signiicant modiications of its proprieties. O/U relation determination by gravimetry cannot differentiate a stoi-chiometric deviation from contents of other uranium oxides in UO2. The presence of other oxides in the manufacturing of UO2 powder or sintered pellets is a critical factor. Fourier Transform Infrared Spectroscopy (FTIR) was used to identify U3O8 in samples of UO2 powder. UO2 can be identiied by bands at 340 cm-1 and 470 cm-1, and U
3O8
and UO3 by bands at 735 cm-1, 910 cm-1, respectively. The methodology for sample
preparation for FTIR spectra acquisition is presented, as well as the calibration for quantitative measurement of U3O8 in UO2. The content of U3O8 in partially calcined samples of UO2 powder was measured by FTIR with good agreement with X-rays dif-fractometry (XRD).
Keywords: FTIR, uranium dioxide, triuranium octoxide. Liliane Aparecida Silva
Mestranda
Centro de Desenvolvimento da Tecnologia Nuclear – CDTN/CNEN Belo Horizonte - Minas Gerais – Brasil [email protected]
Fernando Soares Lameiras
Pesquisador Titular
Centro de Desenvolvimento da Tecnologia Nuclear – CDTN/CNEN Belo Horizonte - Minas Gerais – Brasil [email protected]
Ana Maria Matildes dos Santos
Pesquisadora Titular
Centro de Desenvolvimento da Tecnologia Nuclear – CDTN/CNEN Belo Horizonte – Minas Gerais – Brasil [email protected]
Wilmar Barbosa Ferraz
Pesquisador Titular
Centro de Desenvolvimento da Tecnologia Nuclear – CDTN/CNEN Belo Horizonte – Minas Gerais - Brasil [email protected]
João Batista Santos Barbosa
Pesquisador Titular
Centro de Desenvolvimento da Tecnologia Nuclear - CDTN/CNEN Belo Horizonte – Minas Gerais – Brasil [email protected]
Determination of U
3
O
8
in UO
2
by infrared spectroscopy
http://dx.doi.org/10.1590/0370-44672016700069
1. Introduction
UO2 is the most used nuclear fuel in nuclear power plants. It is manufactured in the form of sintered cylindrical pellets by powder metallurgy processes. It has been very well studied because it shows changes in its properties due to excess or deiciency of oxygen in wide stoichiometric ranges (O/U relation). O-U system presents various ox-ides, which have good dimensional stability under radiation and are chemically stable in a nuclear reactor environment.
The stoichiometry is very important for UO2 performance as nuclear fuel. Fuel oxygen potential and O/U ratio have
inlu-ence on mechanisms controlled by diffusion, such as grain growth, creep, release of ission gases, and thermal conductivity, in addition to chemical state and behavior of ission products. The O/U ratio increases with fuel burnup. Moreover, the sintering kinetics of UO2 pellets is controlled by diffusion processes. Thus, the inal characteristics of manufactured UO2 pellets, which must be kept within very narrow limits, also depend on the O/U ratio of UO2 powder. The O/U relation is an important parameter to be controlled, both in UO2 powder and sintered pellets.
The chemical and physical proper-ties of uranium oxides have been studied for many years using various techniques (Guéneau et al., 2002). Small changes in
60
Determination of U3O8 in UO2 by infrared spectroscopy
REM: Int. Eng. J., Ouro Preto, 70(1),59-62, jan. mar. | 2017 Measurement of the O/U ratio is usu-ally performed by gravimetric methods, which give partial information on UO2 composition. It must be complemented by measures that identify the presence of other phases. X-rays diffraction is usually employed for phase identiication and quan-tiication. Nevertheless, it is hard to differen-tiate the uranium oxide patterns for angles between 20 and 40 degrees, especially at low levels. Thus, the use of X-ray diffraction to control the presence of other phases in UO2 becomes impractical in an industrial process. There are indications that infrared spectroscopy is very sensitive to the pres-ence of phases in the O-U system, even at low levels. This technique is little explored for this purpose in the case of O-U system. The objective of this work was to exploit it in order to complement measurements of the O/U ratios. Since this technique is rapid and inexpensive, it has the potential to be used in the line production of UO2 powder and pellets.
Allen et al., (1976), noticed that
infrared spectroscopy may be used to iden-tify phases in O-U system based on bands
observed between 1000 and 200 cm-1. The
conclusions of these authors were:
• The UO2 infrared spectrum has a composite absorption of two components: a transverse optical phonon absorption, TO, at 340 cm-1 and a longitudinal optical
absorption, LO, which causes a shoulder at 470 cm-1;
• When oxygen is incorporated into
UO2 crystalline lattice, the intensity TO/LO ratio increases;
• A solid solution of oxygen in UO2
can be distinguished from a mixture of U4O9 and UO2 by infrared spectroscopy;
• U4O9 has a weak band at 740 cm-1.
This band may be assigned to asymmetric stretching of continuous chains of uranium and oxygen atoms with the same -O-U-O-U- bond length. These strings do not exist in UO2 luorite lattice, such that no band is ob-served in this region. α-UO3 and U3O8, which contain these chains, have intense bands at 740 cm-1. U
4O9 has a faint band, possibly due
to early formation of these chains.
Axe and Pettit, (1966), measured infrared relectivity of UO2 single crystals. They notice a big difference in the region
be-low 700 cm-1 compared to spectra obtained
with UO2 powder dispersed in the polymer matrix. This difference was attributed to the effect of dispersion of the infrared beam by particles of UO2, which have diameters comparable to the wavelengths of incident infrared radiation.
In order to improve the visualization of UO2 infrared spectrum, Allen et al., (1976),
acquired spectra at 5 K. No improvement was observed, thus showing that the bands are not due to thermodynamic effects. To visualize the band at 500 cm-1 of U
4O9,
Allen and Holmes, (1994), had dispersed 3 parts of oxide in 100 parts of KBr. In other oxides samples the dispersion was 1 part of oxide in 100 parts of KBr. The band at 450 cm-1 in U
4O9 spectrum was attributed to the
fact this oxide is the only one to show mixed valences. The bands at 425 cm-1 and 510 cm-1
were assigned to U3O7, respectively β-U3O7 and γ-U3O7. Ohwada and Soga, (1973), reported a strong band of α-U3O8 at 735 cm-1. Hoekstra and Siegel, (1973), attributed
this band to possible hydration of the oxide, which would have the kind of deformation U-O-H chain.
2. Materials and methods
UO2 powder was provided by IPEN - Institute of Energy and Nuclear Research. U3O8 powder was obtained at CDTN by calcining UO2 powder in air for 3 hours at 400oC. Fourier Transform infrared
spectroscopy (FTIR) was performed with a BOMEM spectrometer, model MB102, in the 7000-400 cm-1 range with resolution
of 8 cm-1 and 64 scans, at absorbance mode.
Due to the intense absorption of infrared radiation by the uranium oxides, it was
nec-essary to disperse the samples in KBr pow-der (Sigma Aldrich, spectroscopic grade, 99.99% purity). For a given KBr mass 1% mass of uranium oxide was diluted.
The mixtures of UO2 and U3O8 pow-ders shown in Table 1 were prepared to calibrate the FTIR spectra and to be used as reference for the quantitative analysis with XRD. Figure 1 shows the FTIR spectra of pure UO2 and pure U3O8. The band at 735 cm-1 is related only to U
3O8. The intensity
of this band in the spectra of UO2/U3O8 mixtures was used to estimate the content of U3O8. The regression of the calibration curve was performed with Minitab 17.
The XRD diffractograms were obtained with a RIGAKU X-ray diffrac-tometer, model D/MAX-ULTIMA and the quantitative analysis of the UO2 and U3O8 mixtures was carried out considering (001) peak by the RIR (reference intensity ratio) method using JADE 9.0 software.
UO2 (w/o) 99 97 95 93 90 80 60 40 20
U3O8 (w/o) 1 3 5 7 10 20 40 60 80
Table 1
Mixtures of UO2 and U3O8 used to calibrate the FTIR spectra.
Figure 1
61 Liliane Aparecida Silva et al.
REM: Int. Eng. J., Ouro Preto, 70(1),59-62, jan. mar. | 2017 To obtain an unknown mixture
of UO2 and U3O8 powders, 7.0 g of UO2 powder samples were partially calcined in
air at 300, 310, 320, 330 and 340 °C for two hours with a 10 °C/min heating rate in a mufle furnace. The calibrated FTIR
and RIR method using JADE 9.0 software were used to estimate the U3O8 content in these calcined UO2 samples.
3. Results and discussion
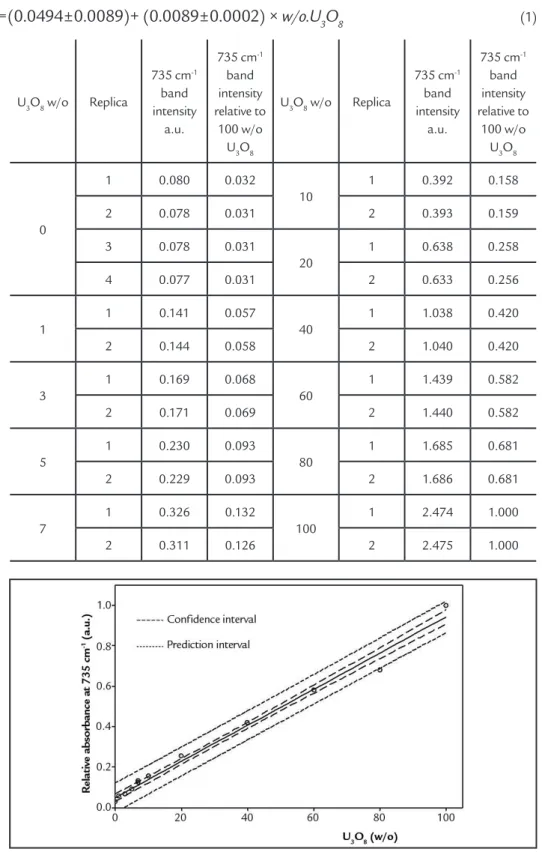
Table 2 shows values (absolute and relative to 100% U3O8) of intensity of the band at 735 cm-1 of known UO
2
and U3O8 mixtures as a function of U3O8 concentration.
Figure 2 shows the linear regression
correlating U3O8 content with relative ab-sorbance at 735 cm-1 (conidence level of
95%). The linear model can be expressed by:
rel.abs.
735=(0.0494±0.0089)+ (0.0089±0.0002) ×
w/o.U
3O
8 (1)U3O8 w/o Replica
735 cm-1
band intensity
a.u.
735 cm-1
band intensity relative to
100 w/o U3O8
U3O8 w/o Replica
735 cm-1
band intensity
a.u.
735 cm-1
band intensity relative to
100 w/o U3O8
0
1 0.080 0.032
10
1 0.392 0.158
2 0.078 0.031 2 0.393 0.159
3 0.078 0.031
20
1 0.638 0.258
4 0.077 0.031 2 0.633 0.256
1
1 0.141 0.057
40
1 1.038 0.420
2 0.144 0.058 2 1.040 0.420
3
1 0.169 0.068
60
1 1.439 0.582
2 0.171 0.069 2 1.440 0.582
5
1 0.230 0.093
80
1 1.685 0.681
2 0.229 0.093 2 1.686 0.681
7
1 0.326 0.132
100
1 2.474 1.000
2 0.311 0.126 2 2.475 1.000
Table 2 Intensity of the band at 735 cm-1
of mixtures of UO2 and U3O8 powders.
Figure 2 Linear correlation model for the relative absorbance at 735 cm-1
and the content of U3O8 (α = 0.95).
U3O8 content in partially calcined UO2 powder was estimated by FTIR using Equation 1. The results are shown in Table
3 compared with determinations obtained by X-rays diffractometry (DRX). Figure 3 shows that the agreement is quite good.
This method can also be extended to other oxides of the O-U systems, like UO3 (band at 910 cm-1) or U
62
Determination of U3O8 in UO2 by infrared spectroscopy
REM: Int. Eng. J., Ouro Preto, 70(1),59-62, jan. mar. | 2017
Calcining temperature (oC)
Relative absorbance at 735 cm-1
Estimated U3O8 content (w/o)
FTIR DRX
300 0.365 35.46±2.07 43.6
310 0.543 55.46±2.52 57.2
320 0.697 72.76±2.91 80.3
330 0.826 87.26±3.24 93.1
340 0.923 98.16±3.48 99.3
Table 3
Estimation of U3O8 in partially
calcined UO2 powder (FTIR versus DRX).
Figure 3
Comparison of measurement of U3O8 concentration in partially calcined UO2 powder (DRX versus FTIR).
4. Conclusion
Fourier Transform Infrared Spec-troscopy (FTIR) was used to measure contents of U3O8 in partially calcined UO2 powders with good agreement with X-rays diffratometry
measure-ments. A methodology for preparing uranium oxide samples for FTIR and XRD measurement was presented. Due to its low cost, simplicity, and rapidity, FTIR may be considered to complement
O/U ratio measurements by gravimet-ric methods in UO2 powder and pellet manufacturing. This technique may also be extended to other uranium oxides, like UO3 or U4O9.
Acknowledgments
To CDTN/CNEN, CAPES, CNPq, and National Institute of Science and Technology on Innovative Nuclear Reactors.
References
ALLEN, G. C., CROFTS, J. A., GRIFFITHS, A. J. Infrared spectroscopy of the ura-nium/oxygen system. Journal of Nuclear Materials, v. 62, n. 2-3, p. 273-281, 1976.
ALLEN, G. C., HOLMES, N. R. Characterization of binary uranium oxides by infra-red spectroscopy. Applied Spectroscopy, v. 48, n. 4, p. 525-530, 1994.
AXE, J. D., PETTIT, G. D. Infrared dielectric dispersion and lattice dynamics of ura-nium dioxide and thorium dioxide. Physical Review, v. 151, n. 2, p. 676-680,
1966.
GUÉNEAU, C., BAICHI, M., LABROCHE, D., CHATILLON, C., SUNDMAN, B. Thermodynamics assessment of uranium-oxygen system. Journal of Nuclear Materials, v. 304, n. 2-3, p. 161-175, 2002.
HOEKSTRA, H. R., SIEGEL, S. The uranium trioxide-water system. Journal of Inor-ganic and Nuclear Chemistry, v. 35, n. 3, p. 761-779, 1973.
OHWADA, K., SOGA, T. Uranium-oxygen lattice vibrations of triuranium octoxi -de. Spectrochimica Acta Part A: Molecular Spectroscopy, v. 29, n. 5, p. 843-850,
1973.