Compressive strength values dispersion of side-mixed
and ready-mixed concretes
Dispersão dos valores de resistência a compressão de
concretos fabricados in situ e em central
Abstract
Resumo
Compressive strength testing method has been widely used as indirect way for evaluate the concrete quality, due to it simplest execution, reliability of the results achieved and low cost of execution. Independently, if the concrete was side or ready-mixed, it is necessary to achieve the compres-sive strength requirements stated during structure design, essentially because this parameter allows the obtainment of the average strength of the reinforced concrete structure analyzed. Following, as for ready-mixed, as for side-mixed concretes, it is need to ensure the correspondence between the concrete design parameters and the concrete mixed, namely these parameters are summarized in terms of the compressive strength and homogeneity in the different phases of the construction. This way, the present work aims to do the analysis of the dispersions of the
compres-sive strength of concretes mixtures (corresponding to comprescompres-sive strength classes of 20, 25, 30, 35 and 40 MPa), and identify some inluence factors, in this case, the inluence of the workers team variation. Two mixtures (35 MPa and 40 MPa) were ready-mixed, while ive of the concrete mixtures were side-mixed, by ive different worker's group with same time of experience on concrete’s manufacture. The results demonstrate that the variation of the workers team presents a high inluence for the homogeneity of the compressive strength of the concrete.
Keywords: compressive strength, quality of concrete, central concrete, concrete side-mixed.
O ensaio de resistência a compressão tem sido largamente utilizado como forma indireta para avaliação da qualidade do concreto, devido a
sua simplicidade na execução, iabilidade dos resultados e baixo custo. Independentemente do concreto ser fabricado in situ ou em central, é
imprescindível cumprir com os requisitos de resistência a compressão, especialmente porque este requisito permite a obtenção da capacidade resistente das estruturas de concreto armado. Neste seguimento, quer para concretos fabricados em central, quer para concretos fabricados in situ, há a necessidade de se garantir a adequada correspondência aos requisitos de projeto, nomeadamente resumidos em termos da resistência a compressão, e da homogeneidade entre os concretos utilizados nas diversas etapas da construção. Desse modo, este trabalho teve como objetivo analisar as dispersões dos resultados a compressão de sete misturas de concreto (correspondentes as classes de resistência de 20, 25,
30, 35 e 40 MPa), e identiicar eventuais fatores de inluência, como por exemplo o impacto na variação da equipe de execução. Duas misturas
(35 MPa e 40 MPa) correspondem a concretos dosados em central, enquanto cinco das misturas de concreto foram produzidas in situ, por cinco grupos de trabalhadores diferentes com o mesmo tempo de experiência na fabricação do concreto. Os resultados mostraram que a variação
dos grupos de trabalhadores apresenta uma elevada inluencia para a homogeneidade dos resultados de resistência a compressão do concreto.
Palavras-chave: resistência à compressão, qualidade do concreto, concreto dosado em central, concreto in situ.
a Grupo de Estudos em Estruturas e Materiais - GEM, Department of Civil Engineering, Universidade Estadual Vale do Acaraú, Campus da CIDAO, Sobral, CE, Brazil; b CONSTRUCT, Department of Civil Engineering, Faculty of Engineering of University of Porto, Porto, Portugal.
A. ALVES a
F. SANTOS a
A. DEOGENES a
K. MOREIRA a
E. MESQUITA b
1. Introduction
Concrete is the most employed building material applied
through-out the infrastructure of a nation’s construction, industry, transpor -tation, defense, utility, and residential sectors[1], and as a wide-ly used in the construction industry, concrete needs to keep its serviceability properties during the building service life. However, some external factors, as the environmental actions, and internal factors, as permeability, for instance, can reduced the concrete durability and consequently a reduction of the its service life [2]–[6]. Basically, concrete obtainment process starts with the material se-lection and the design method choice and it ends after the cure process. Nonetheless, between the material selection and the
concrete cure, other factors also have inluence on the concrete
quality, for example the mixture process, that depending on the workers training level or automation level can present as results a concrete with high or low dispersion between the compressive strength of the structural elements. This way, homogeneity of the
concrete has a direct inluence with its quality properties up to the
end of its service life, and can be affected not only by materials quality but mixture process, as well[7].
The concrete mixture needs to be systematically implemented in order of to avoid low durability or emergence of problematic issues after concreting. The general criteria for be considered in the mix design are: i) which aggregates are available; ii) which properties should concrete presents, and iii) what is the most economical way of providing these required properties[7]. In summary, the main goal of the concrete mix design is to select the appropriate com-ponents, considering the materials available and to determine the most economical way for to produce concrete with the desire char-acteristics [8]. In addition, the concrete mixture proportion is also an important component for the concrete structures strength and
durability, extremely inluenced by water/cement ratio (w/c) and
type and cement content. Furthermore, binder type in a concrete
mixture can inluences the durability against a severe environment
[9]. However, the use of materials with good quality and proper mixture proportioning will not ensure that the concrete will be dur-able[10], [11]. Good quality control and workmanship are also ab-solutely essential to the production of durable concrete[12], as well the attendance to the current codes[13].
Quality control can be understand as the analysis of the properties of concrete related with durability, since its process of obtainment [14]. This process covers the material selection, choice of the as-sessment methods, statistical analysis of the results and proced-ures of control. Nonetheless, when the concrete is side-mixed
(pro-duces in ield), additional careful is needed due to its production in
batches. In addition, the ready-mixed concrete also needs a good quality control, once variations can occur during transportation, placing, compacting, concreting and curing, as well. Variations in
the inal properties of the concrete may occur partly because of the
quality of the materials and its proportion, and partly because of the differences methodologies used for concrete production [15], but the main aim of the quality control is to reduce those variations and to ensure the concrete produced achieves the properties re-quested by owners.
As advantages of the quality control it can be mentioned the re-duction of the material costs, because quality control leads to a
rational use of the available resources; time reduction, because to check every stage of the production of the concrete can avoid inspected problems or solve its in early time; and consequent, pro-vide reduction of the maintenance costs[16].
Concrete properties must be analyzed either on fresh and hard-ened stage. The principal properties of the fresh concrete are: uniformity, stability, workability, pumpability, water demand and
water/cement ratio, rate of change of workability, and inishing.
For the hardened concrete, the main properties are connected to mechanical characteristics as strength and elasticity modulus, for instance[17]. It can also be mentioned the early-age properties of concrete are also important, as well the heat release, degree of hydration, mechanical short-term properties, viscoelastic behavior, thermal dilatation and autogenous shrinkage[18]. However, the durability characteristics of the concrete can be analyzed by the compressive strength of the concrete, since there is a good cor-relation between those two parameters[19].
In order to contribute for implementation of the state of knowledge on concrete quality control, the present work is focused on the as-sessment of the quality control of the ready-mixed and side-mixed concretes through analysis of the compressive strength (fck) dis-persion values. In this study, seven concrete mixtures were per-formed for different levels of fck, namely 20, 25, 30, 35 and 40 MPa. Two mixtures (35 MPa and 40 MPa) were ready-mixed, while
ive concrete mixtures were side-mixed, by 5 different workers
team with the same time of experience on concrete manufacture. The present work intents to answer the pertinent question if vari-ations in the concrete mixture method can presents considerable
inluence on compressive strength of concrete. Once this study
was done at North of Ceará State, it can be also understanding as a contribution to study of the methodologies of concrete production performed in North of Ceará.
2. Theoretical background
The concrete mix design is related with achievement of the opti-mized proportion of the concrete components (cement, water,
coarse and ine aggregates, and sometimes incorporation of
chemical admixtures and mineral additions) necessary for to ob-tain a concrete with good quality. Generally, these conditions are determined by structural project and the conditions of the construc-tion, and the guidelines considered, as for instance the Brazilian Standard ABNT NBR 12655: Portland cement concrete – Prepara-tion, control and acceptance – Procedure[20]. This code states that the composition of each concrete with class of resistance above
20 MPa (C20), should be deined by mix design, and must be re
-deined each time there is a change in the component materials
and in the construction conditions[20].
During the mixture design, the material proportioning is stated based on theoretical and experimental studies, that basically are
performed in order of to deine and to characterize the proper -ties of the desired concrete, following some steps such as:
char-acterization of the component of the concrete; irst mix design; adjustment and veriication of concrete mix and preparation of
the concrete properties are generally assessed following proced-ures as presented in [20], [21].
The obtainment of the mix design strength (
fcj
) considers the dominant variability conditions during construction, which leads tovariability of the inal properties of concrete, in the both fresh and hardened states. In general, the inal variations are due to vari -ability in the material components, equipment (mixing step) and the operation (transport, placing, compacting and curing). These conditions are measured by the standard deviation (
Sd
)that can be made smaller by making a good concrete quality control, since the variability of the concrete properties will be reduced.The standard deviation,
Sd
, is a function of the concrete prep-aration condition and can be known or unknown. TheSd
can be known when the concrete is always produced with the same ma-terials, and similar equipment under equivalent conditions. So, the numerical value ofSd
is set with a minimum of 20 consecutive samples results within 30 days and should never be lower than 2MPa. When the
Sd
is unknown, it adopts the value according to Table 1, that consider the preparation conditions. The value must be kept constantly equal during all stages. The Equation 1 shows the relation betweenSd
andfcj
, wherefcj
is the average com-pressive strength of concrete for the age of “j” days (MPa); fck is the real compressive strength of concrete (MPa) andSd
is the standard deviation of the mixture (MPa).(1)
Considering the Table 1, the condition A is applicable to classes of concrete from C10 to C100, where cement and aggregates are measured in mass, mixing water is measured by weight or by volume, using metering device. The amount of water is also a function of the humidity of the aggregates. Now, in the condition B, applicable to classes of concrete from C10 to C20, the cement is measured in mass, mixing water is measured in volume by metering device and the aggregates are meas-ured in combined mass with volume, with humidity control and swelling whenever necessary; and also applicable to concrete class C10 to C15, where the cement and the mixing water is measured in similar form with the previous condition A, but the aggregates are measured by volume. The humidity of the fine aggregate is determined at least three times during the same turn of pour, and the volume of fine aggregate is fixed by swell-ing curve, established specifically for the material used. In the condition C, only for classes C10 and C15 of concrete, the cement is measured in mass, aggregates and mixing water are
Table 1
Standard deviation to be used depending on the
concrete preparation condition [20]
Concrete preparation condition
Standard deviation (Sd)
A 4.0 MPa
B 5.5 MPa
C 7.0 MPa
Figure 1
measured in volume. The amount of water is also a function of the estimated humidity of the aggregates and determining the consistency of concrete, according to ABNT NBR NM 67 [22] or other standardized method. Also, for preparing in condition C, while the
Sd
is not known, it is required to C15 class a min-imum cement consumption of 350 kg per one thousand liters of concrete.Even with several concrete classes with different resistances, the ABNT NBR 6118 [23] states that for structural purposes the min-imum resistance must be 20 MPa.
3. Experimental
3.1 Materials and concrete mixtures
For the concrete mixtures, were used sand from the Acaráu
Riv-er (Sobral, Brazil), as ine aggregate and limestone aggregate as
ground aggregate. The curves of the particle size distribution for both aggregates are showed by Figure 1, where C1, C2, C3, C4, C5, C6 and C7 represents the correspondent mixtures and the
inal abbreviations “S” and “CA” represents sand (ine aggregate)
and coarse aggregate, respectively. Portland Cement type II was used as binder in the concrete mixtures, following the recommen-dation in ABNT NBR 11578 [24] and its chemical composition is presented by Table 2. The water used came from the water public service of Sobral city, in Brazil.
Seven concrete mixtures were performed and the details of each one of the seven composition can be seen by Table 3. Essentially, the ABCP (Cement Portland Brazilian Association) concrete mix design method was adopted and the concretes for strengths classes of 20 MPa (C4), 25 MPa (C2), 30 MPa (C3, C5 and C6), 35 MPa (C1) and 40 MPa (C7) were done. The
Sd
adopted for all mixtures was 4.0 MPa. The strength class of 30 MPa was studied for 3 different compositions due to the fact that it represents the compressive strength value most commonly adopted in Ceará State. The minimum mortar rate of the concrete mixtures was 45% while the maximum mortar rate was 60% and the water/cement ratio (w/c) used vary between 0.42 and 0.58.While C1 and C7 concrete mixtures correspond to ready-mixtures by mechanical automation, the compositions C2 until C6 repre-sents the side-mixture concretes. For the side-mixture concrete, were selected workers with correspondent experience time, name-ly between 5 and 10 years of experience on concrete mixtures performance. For each one of the concrete mixtures a different worker group was selected. In order to make clear the difference between the production process of ready-mixed concrete and the
side-mixed, a lowchart is presented in Figure 2.
Table 2
Particle size distribution of the aggregates
employed in the concrete mixtures
Cement chemical analyses %
Silicon dioxide (SiO2) 20.6
Aluminum oxide (Al2O3) 5.2
Ferric oxide (Fe2O3) 3.5
Calcium oxide (CaO) 65.0
Magnesium oxide(MgO) 2.74
Sodium oxide (Na2O) –
Potassium oxide (K2O) –
Equivalent alkali 1
Phosphorous oxide (P2O5) –
Titanium oxide (TiO2) –
Sulfur trioxide (SO3) 2.93
Loss in ignition 5.85
Bogue potential compound composition %
Tricalcium silicate (C3S) 67.0
Dicalcium silicate (C2S) 7.8
Tricalcium aluminate (C3A) 7.8
Tetra calcium aluminoferrite (C4AF) 10.5
Table 3
Concrete compositions)
Mixtures Proportion (binder, ine
aggregate, coarse aggregate) fck
Cement
consumption Mortar rate
water / cement ratio (w/c)
C1* 1.00 : 1.41 : 2.14 35 MPa 482.28 Kg/m³ 53% 0.42
C2 1.00 : 1.94 : 2.71 25 MPa 382.71 Kg/m³ 48% 0.53
C3 1.00 : 1.71 : 1.93 30 MPa 424.96 Kg/m³ 46% 0.44
C4 1.00 : 2.60 : 2.59 20 MPa 318.88 Kg/m³ 48% 0.58
C5 1.00 : 1.74 : 2.53 30 MPa 410.81 Kg/m³ 52% 0.47
C6 1.00 : 1.66 : 2.45 30 MPa 431.61 Kg/m³ 60% 0.47
C7* 1.00 : 1.40 : 2.22 40 MPa 465.40 Kg/m³ 52% 0.47
3.2 Specimens preparation
The number of specimens necessary for each mixture was stat-ed basstat-ed on ABNT NBR 12655 [20] recommendations, taking into account the quantity of concrete. This way, 343 specimens were produced to C1, 106 specimens to C2, 74 specimens to C3, 124 specimens to C4, 62 specimens to C5, 128 specimens to C6, and 284 specimens to C7. The specimens were produced according to ABNT NBR 5738 [25] and after 24 hours, the cylindrical samples (10 cm x 20 cm) were submitted to water immersion for concrete cure process, during 28 days.
3.3 Compressive strength testing
The compressive strength test was performed through the centralization of a cylindrical concrete specimen between a rigid plate and a load cell. The correct positioning is fundamental for
make the specimen axis coincides with the axis of the testing machine, making the resultant of the forces passes through the center of the sample. The apparatus applies load until the failure of the sample, which is then removed. The compressive strength value of the samples was obtained according to ABNT NBR 5739 [26]. For this procedure, an electrical Contenco® loading machine was used. It has a load range of 100.000 Kgf with subdivision of 10 Kgf.
4. Results
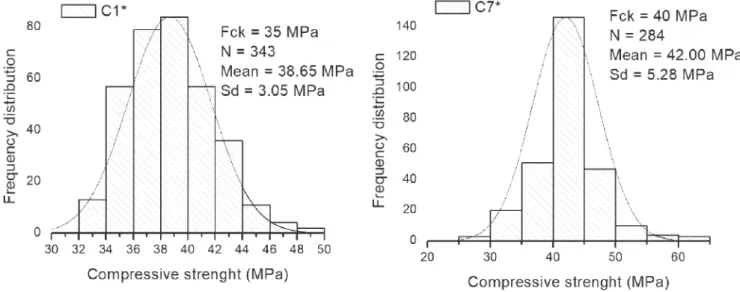
The graphs of the Figure 3 and 4 shown the frequency distribution of the axial compressive strength test results of the ready-mixed and side-mixed concretes, respectively. In addition, it also can be observed the normal distribution curve, fck values, mean and stan-dard deviation (Sd) of the samples.
Preliminarily, it can be seen by Figure 3 that the average of the
Figure 2
results is higher than the fck (the fck for C1 was 35 MPa, and the mean obtained was 38.7 MPa; for C7, the fck obtained was 40 MPa, and the mean obtained was of 42 MPa). Furthermore, for the side-mixed concretes (Figure 4) it can be observed that 3 of the 5 concretes have not reached the fck. C3, C5 and C6, has fck of 30 MPa, but they only reached the mean of 21.9 MPa, 26.1 MPa and 27.4 MPa, respectively. However, the discussion of these values is not the focus of this study.
As previously mentioned, a Sd of 4 MPa was used for the ready-mixed concretes. Since the average Sd for the 7 samples was 4.1 MPa, the value of 4 MPa is presented as a sensible value for an initial guess. However, it was noted in Figure 3 that the Sd of C1 (3.1 MPa) is smaller 23.75% than the value stablished and, in a critical situation, the C7 surpasses the value of 4 MPa in 32%, showing a Sd value of 5.3 MPa. Similarly, it can be observed in Figure 4 that the Sd of the values of C2 and C3 was 3.2 MPa and 3.9 MPa, respectively. Therefore, they are smaller in 20% and 4.25%. But, still in the Figure 4, it can be observed that C4 and C6 exceed this value, with a Sd of 4.8 MPa and 4.3 MPa, respectively. It can be said that only the concrete C5 obtained the Sd according with established.
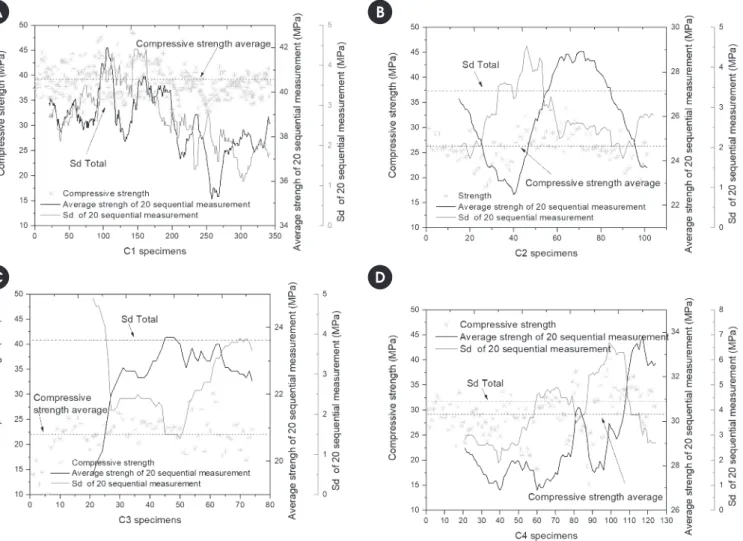
For obtainment of a most suitable Sd value in the concrete mix design, it must be used a Sd value of twenty sequential measure-ments (Sd20). In order to examine the reliability of these results, the individual results of all Sd20 and the compressive strength average of 20 sequential measurements (AS20) of all sets were plotted in the Figure 5 and Figure 6. Also, the compressive strength values of each measurement, the Sd of the total population (Sd-Total) and the total average strength (AS(Sd-Total) are there indicated. Figure 5.a shown C1 compressive strength results, where can be noted that the SdTotal is 3.1 MPa, and the Sd20 vary over this value, with the minimum value of 1.1 MPa and a peak of 4.4 MPa. Considering the total population of 343 samples, were formed 324 sets of 20 samples. Firstly, it was observed that AS20 is moving on the value of the total mean of 39 MPa for all
sam-ples. Additionally, was noted peaks and valleys along the entire sample, with the highest peak at 42.0 MPa, and the lowest valley at 35.2 MPa, which provide maximum amplitude of 6.8 MPa and the maximum difference between the total mean value and the further AS20 value of 3.8 MPa. This may indicate that the prepar-ation conditions were homogeneous throughout over 2720m³ of concrete in this construction.
Figure 5.b presents the results of samples relating to C2, with an average value of 3.4 MPa (SD20 oscillates about this value with a maximum and minimum value of 4.5 MPa and 1.7 MPa). C2 had 87 sets, with the mean 26 MPa and AS20 varies about this value. The curve for these values had a peak between two valleys (28.9 MPa and 22.5 MPa) for one and for the other a value of 23.7 MPa, and a maximum amplitude of 6.4 MPa and a maximum difference from the mean of 3.5 MPa. Note that the curve of AS20 and Sd20 presents a biased cyclical, also indicating similar preparation con-ditions throughout the work.
Similarly, to what occurs in C1 and C2 (Figure 5.a and b), the sensitivity analysis shows us reasonably homogeneous prepara-tion condiprepara-tions C3 (Figure 5.c), C4 (Figure 5.d), C5 (Figure 6.a) and C6 (Figure 6.b), where it was observed behaviors that tend to periodicity. Moreover, they had maximum amplitudes of 4.1 MPa, 6.9 MPa, 5.3 MPa and 7.5 MPa, respectively, and the greatest dif-ference in the total mean and AS20 was of 2.4 MPa, 4.7 MPa, 2.8 MPa and 4.8 MPa respectively. These data indicate a homogen-eous preparation conditions along the concrete production. In the sample C7 (Figure 6.c), the Sd20 curve had abrupt slope at several points together with a no behavior basis. This curve had a maximum peak of 7.1 MPa and a lower minimum value of 1.1 MPa. Moreover, the maximum peak and the valley were 49.7 MPa and 36.5 MPa, respectively, which generates high amplitude, with the maximum of 13.2 MPa, and the major difference between the mean of 42.0 MPa, with a sample average value of 7.7 MPa. This curve was not considered for further analysis in this work be-cause the results indicated that some change had occurred in the
Figure 3
Figure 4
preparation process, and it was not homogeneous throughout the analyzed period.
It can be observed in Figure 4 that some Sd20 values presented lower values than the SdTotal, however, the Brazilian Standard recommends that the value adopted from Sd must be multiplied by 1.65 (see Equation 1). The ratio between each Sd20 and SdTotal were calculated, which generated the a correction factors for each
set. The standard also speciies that in no case can adopt a Sd
lower than 2.0 MPa, consequently, in this analysis, all Sd below this value were replaced by 2.0 MPa.
Figure 7, 8 and Figure 9 shows the cumulative Gaussian distribu-tion curves and its complement together with the frequency distri-bution for the correction factors of the 7 samples.
Figure 7.a and b refer to concrete C1. It could be inferred by a Gaussian curve that the probability of a value of the correction factor be greater than 1.65 is equal to 3.6% and the actual fre-quency at which the correction factor is higher than 1.65 is equal to 0. Additionally, the Figure 7.c and d are the C7 values, but those values were not considered for this study because, as previously mentioned, these samples are not adequate for the analyses per-formed in this study.
Figure 8.a and b refer to concrete C3 and Figure 8.c and d to con-crete C4. It can be seen in the Gaussian curve that the probability of a correction factor to provide greater than 1.65 for C3 is 30% and that the actual frequency of these values is 31.7%. In addition, the probability of occurring a correction factor larger than 1.65 in C4 is 12.5% and that the actual frequency of these values is 16.3%. Figure 9 refers to concretes C2, C5 and C6. Through Gaussian curves is observed that the probability of occurrence of a correc-tion factor greater than 1.65 is 10.3% for C2, 0.5% for C5 and 1.8% for C6 and the frequency of these values for C2, C5 and C6 is 18.4%, 2.4 % and 4.7%, respectively.
In order to compare the ready-mixed and side-mixed concretes, all validated data were grouped and they are shown in the Figure 10. The probability of obtaining a correction factor equal to or less than 1.65 for the ready-mixed concrete was of 3.6%, while the probabil-ity of getting the same factor for the side-mixed concrete was of 9.6%. To achieve the same probability of 3.6% the correction factor of the side-mixed concrete should be 1.82.
Figure 5
Compressive strength results of C1, C2, C3 and C4 mixtures
B
B
A
B
B
B
5. Conclusions
The results for the seven concrete mixtures analyzed showed that only in one mixture was obtained the standard deviation (Sd) es-tablished previously, considering the average of all values. Also, the found results can be not directly related with the standard devi-ations and the compressive strength values obtained, because some concrete samples presented standard deviation values higher than that stated, but compressive strength values lower than the fck.
By the individual analysis of Sd and compressive strength for every mixture, only C7 mixture possibly does not kept homogen-eity during the production of the ready-mixed concrete. The re-maining mixtures indicate a existence of a linearity in the quality of concrete, regardless of production location.
The side-mixed concretes can have quality equivalent to the concrete produced in central when it is only analyzed the re-sistance capacity of the material. In general, in order to obtain a concrete side-mixed with the same quality of concrete ready-mixed, some steps must be performed: good material selection, mass measurement of the material and standardization of the manufacturing process of the concrete side-mixed. As well, in
order of to achieve better standardization of side-mixed
con-crete it is necessary to deine which workers will be responsible
for concrete manufacturing, and it is recommended to keep the same team as long than possible.
Finally, this work also demonstrates that worker’s variation can present signiicant inluence on the concrete properties, and that is a topic that need more attention by técno-scientiic ield,
in order of to provide new methodologies for side-mixed con-crete production.
6. Acknowledgements
All the authors acknowledge the Instituto de Estudos de Materi-ais de Construção - IEMAC. Esequiel Mesquita acknowledge the CAPES through the fellowship number 10023/13-5, Fundação
CAPES, Ministério da Educação do Brasil.
7. References
[1] R. Siddique, Y. Aggarwal, P. Aggarwal, E. H. Kadri, and R. Bennacer, “Strength, durability, and micro-structural prop-erties of concrete made with used-foundry sand (UFS),”
Figure 6
Compressive strength results of C5, C6 and C7 mixtures
B
B
A
B
Constr. Build. Mater., vol. 25, no. 4, pp. 1916–1925, 2011. [2] A. M. Neville, Properties of concrete. John Wiley & Sons,
1996.
[3] S. Keßler, J. Fischer, D. Straub, and C. Gehlen, “Updating of service-life prediction of reinforced concrete structures with potential mapping,” Cem. Concr. Compos., vol. 47, pp. 47–52, Mar. 2014.
[4] E. F. T. Mesquita, K. M. V Moreira, I. N. S. Montenegro, and F. C. A. Coelho, “Permeability of self-compacting concrete with
Coper-nícia prunifera’s wax,” World J. Eng. Phys. Sci., vol. xx, 2015. [5] E. Mesquita, P. Antunes, A. A. Henriques, A. Arêde, P. S.
André, and H. Varum, “Structural reliability assessment
based on optical monitoring system: case study,” IBRACON Struct. Mater. J., vol. 9, no. 2, pp. 297–305, 2016.
[6] T. Silva, H. D’Ambros, E. Mesquita, A. Milhomem, F. Santos,
A. Mendes, and F. Lelis, “A novel methodology for obtain-ment of compressive strength of concrete,” J. Build. Pathol. Rehabil., vol. 1, no. 1, p. 1, 2016.
[7] K. W. Day, Concrete Mix Design, Quality Control and
Speci-ication, (with CD ROM), Second Edition. Taylor & Francis,
1999.
[8] P. Mehta and P. J. M. Monteiro, Concrete: Microstructure, Properties, and Materials. McGraw-Hill Education, 2005. [9] M. S. Jung, M. C. Shin, and K. Y. Ann, “Fingerprinting of a
concrete mix proportion using the acid neutralisation cap-acity of concrete matrices,” Constr. Build. Mater., vol. 26, no. 1, pp. 65–71, 2012.
[10] O. E. Gjørv, “Durability and Service Life of Important Con-crete Infrastuctures,” in Congresso Internacional sobre Pa-tologia e Recuperaçao de Estruturas, 2011, pp. 1–16. [11] ABNT, NBR 6118: Projeto de Estruturas de Concreto -
Pro-cedimento. 2014, p. 238.
[12] R. L. Hill, A. J. Boyd, J. E. Dongell, G. Hichborn, R. E. Neal, C. K. Nmai, J. F. Lamond, and M. L. Leming, “Guide to Durable Concrete Reported by ACI Committee 201,” p. 53, 2008.
Figure 7
Cumulative Gaussian distribution curve and frequency distribution for the correction factors of
concretes C1 and C7
B
B
B
B
A
C
B
[13] A. Mosleh, H. Rodrigues, H. Varum, A. Costa, and A. Arêde, “Seismic behavior of rc building structures designed accord-ing to current codes,” Structures, vol. 7, pp. 1–13, 2016. [14] ABNT, “NBR 6118: Projeto de Estruturas de Concreto -
Pro-cedimento,” Rio de Janeiro, 2014.
[15] Ö. Ariöz, G. Arslan, M. Tuncan, and S. Kivrak, “Web-based
quality control of ready mixed concrete,” Build. Environ., vol. 42, no. 3, pp. 1465–1470, 2007.
[16] M. L. Gambhir, Concrete Technology: Theory and Practice. 2013.
[17] R. Anderson, R. Anderson, J. D. D. Consultancy, and J. D. Dewar, Manual of Ready-Mixed Concrete, Second Edition. CRC Press, 2003.
[18] A.-W. Gutsch, “Properties of early age concrete-Experiments
and modelling,” Mater. Struct., vol. 35, no. 2, pp. 76–79, 2002. [19] O. S. Baghabra Al-Amoudi, W. a. Al-Kutti, S. Ahmad, and M.
Maslehuddin, “Correlation between compressive strength and certain durability indices of plain and blended cement concretes,” Cem. Concr. Compos., vol. 31, no. 9, pp. 672–676, 2009.
[20] Associação Brasileira de Normas Técnicas, NBR 12655 - Portland cement concrete – Preparation, control and accept-ance – Procedure. 2015.
[21] ABNT, “NBR 5739: Concreto-Ensaios de compressão de cor-pos-de-prova cilindricos,” ABNT, Rio de Janeiro, Brasil, 2007.
[22] Associação Brasileira de Normas Técnicas, NBR NM 67 - Con-crete - Slump test for determination of the consistency. 1998.
[23] Associação Brasileira de Normas Técnicas, NBR 6118 - De-sign of concrete structures - Procedure. 2014.
Figure 8
Cumulative Gaussian distribution curve and frequency distribution for the correction factors of
concretes C3 and C4
B
B
B
B
A
C
B
Figure 9
Figure 10
Frequency distribution for the correction factors
of all ready-mixed and side-mixed concretes
[24] Associação Brasileira de Normas Técnicas, NBR 11578 -
Port-land composite cement - Speciication. Rio de Janeiro, 1991.
[25] Associação Brasileira de Normas técnicas, NBR 5738 - Concrete - Procedure for molding and curing concrete test specimens. 2015.