Concentrations
Moritz Holtappels1*, Laura Tiano2, Tim Kalvelage1,3, Gaute Lavik1, Niels Peter Revsbech2,
Marcel M. M. Kuypers1
1Department of Biogeochemistry, Max Planck Institute for Marine Microbiology, Bremen, Germany,2Department of Bioscience, Microbiology, Aarhus University, Aarhus, Denmark,3Department of Oceanography, Dalhousie University, Halifax, Nova Scotia, Canada
Abstract
Despite its huge ecological importance, microbial oxygen respiration in pelagic waters is little studied, primarily due to methodological difficulties. Respiration measurements are challenging because of the required high resolution of oxygen concentration measurements. Recent improvements in oxygen sensing techniques bear great potential to overcome these limitations. Here we compare 3 different methods to measure oxygen consumption rates at low oxygen concentrations, utilizing amperometric Clark type sensors (STOX), optical sensors (optodes), and mass spectrometry in combination with 18-18O
2labeling. Oxygen concentrations and consumption rates agreed well between the different methods when applied in
the same experimental setting. Oxygen consumption rates between 30 and 400 nmol L21h21were measured with high
precision and relative standard errors of less than 3%. Rate detection limits in the range of 1 nmol L21h21were suitable for
rate determinations in open ocean water and were lowest at the lowest applied O2concentration.
Citation:Holtappels M, Tiano L, Kalvelage T, Lavik G, Revsbech NP, et al. (2014) Aquatic Respiration Rate Measurements at Low Oxygen Concentrations. PLoS ONE 9(2): e89369. doi:10.1371/journal.pone.0089369
Editor:Zoran Ivanovic, French Blood Institute, France
ReceivedNovember 29, 2013;AcceptedJanuary 20, 2014;PublishedFebruary 19, 2014
Copyright:ß2014 Holtappels et al. This is an open-access article distributed under the terms of the Creative Commons Attribution License, which permits unrestricted use, distribution, and reproduction in any medium, provided the original author and source are credited.
Funding:The study was funded by the Max-Planck-Gesellschaft (www.mpg.de), the DFG-Research Center/Cluster of Excellence ‘‘The Ocean in the Earth System’’ at the University of Bremen (http://www.marum.de), the DFG-funded Sonderforschungsbereich 754 "Climate-Biogeochemistry Interactions in the Tropical Ocean" (www.sfb754.de), the European Union project ‘‘HYPOX - In situ monitoring of oxygen depletion in hypoxic ecosystems of coastal and open seas and land-locked water bodies’’, EC grant 226213 (http://ec.europa.eu/research/fp7), the European Research Council, grant 267233 (www.erc.europa.eu), and the Danish Council for Independent Research: Natural Sciences, grant 10-083140 (http://en.fi.dk/councils-commissions/the-danishcouncil-for-independent-research). The funders had no role in study design, data collection and analysis, decision to publish, or preparation of the manuscript.
Competing Interests:The authors have declared that no competing interests exist.
* E-mail: [email protected]
Introduction
The oxygen concentration in the ocean interior depends on a balance between oxygen consumption and oxygen transport from surface waters, where oxygen is produced and exchanged with the atmosphere. Hypoxic and anoxic zones appear usually where oxygen transport is reduced and/or oxygen consumption is increased. Reduced ventilation is the main cause for anoxia in semi enclosed seas such as the Baltic Sea [1] and the Black Sea [2], whereas a combination of sluggish ventilation of upwelling source waters and high organic matter input causes the development of oceanic oxygen minimum zones (OMZs) at the western continen-tal margins [3] and the Arabian Sea [4]. Severe oxygen depletion has serious consequences for aquatic ecosystems [5] and can cause massive mortality of benthic and pelagic macro-fauna. It is expected that OMZs will expand as anthropogenic pressure increases, and regions with already low oxygen will be most affected [6]. Many predictions are either based on historical data of OMZ volumes that are extrapolated into the future [7] or they are based on ocean circulation models that predict a decline in oxygen transport caused by lower oxygen solubility and increased stratification [8]. Since the transport of oxygen is directly linked to the advection and mixing of water masses well established oceanographic approaches can be applied to predict future changes of oxygen transport. Oxygen consumption – the sink term in the O2 balance - depends on biotic processes, such as
organic matter availability, the abundance and composition of heterotrophic communities, and oxidation rates of reduced compounds (e.g., NH4+
and optical sensors [12]. A low detection limit is particularly necessary to study (i) the kinetics of the various oxygen consuming processes such as heterotrophic respiration and ammonium and nitrite oxidation; (ii) the inhibitory thresholds of anoxic processes such as anammox and denitrification; (iii) and the interaction of these oxic and anoxic processes.
The recent development of the amperometric STOX sensor [13] lowered the detection limit to a few nmol O2L2
1
by applying frequent in situ zero calibrations of the sensing cathode. The STOX sensor was successfully applied to measure insitu oxygen concentrations in the OMZ off Chile and Peru [14–16], off Mexico (L. Tiano et al. unpubl. results), and in the Arabian Sea [17]. In parallel, the optical oxygen sensors (optodes) were recently improved with respect to precision and sensitivity by the development of special dyes for trace amounts of oxygen ranging from 0–50mmol L21. In general, the precision of optodes increases with decreasing oxygen O2concentrations [18], which makes them well suited for rate measurements at low concentra-tions. A third approach for highly sensitive and precise O2 measurements is the detection of the stable oxygen isotope18-18O2 by membrane inlet mass spectrometry (MIMS). The low natural abundance of18-18O2(0.2%) and the very low cross-sensitivity of mass 36 (18-18O2) with other dissolved gases allows to follow its consumption over time upon the initial addition to the incubated sample. To evaluate the applicability of all three approaches (STOX, optodes and18-18O2labeling), we performed combined incubation experiments measuring O2 consumption in water samples with low oxygen concentrations of 0.5–15mmol L21.
Methods
STOX Sensor
The electrochemical STOX sensor measures oxygen partial pressure. Different from conventional oxygen microsensors, the STOX sensor features a second cathode - a porous front guard cathode - that prevents O2to diffuse to the sensing cathode when polarized. Switching on and off the front guard cathode allows for in situ zero calibration of the sensor and thereby lowers the detection limit to less than 10 nmol L21 [13]. Electrochemical sensors consume oxygen at a rate proportional to the measured O2 concentration. At concentrations used in this study (1–15mmol L21) the O2consumption rate of the STOX sensor is between 0.012 to 0.18 nmol L21h21and can therefore be neglected. The microsensors for this study were built as described previously [13,19]. The sensor currents were measured with a PA8000 eight-channel picoammeter (Unisense A/S, Denmark), while the polarization and depolarization of the front guard were regulated by a custom-built timer-controlled switchbox with the timer set to 190–200 s intervals for front guard on and off, respectively. The signals were processed and recorded by a Unisense ADC816 16-bit A/D converter, connected to a portable PC using the program Sensortrace Basic (Unisense A/S).
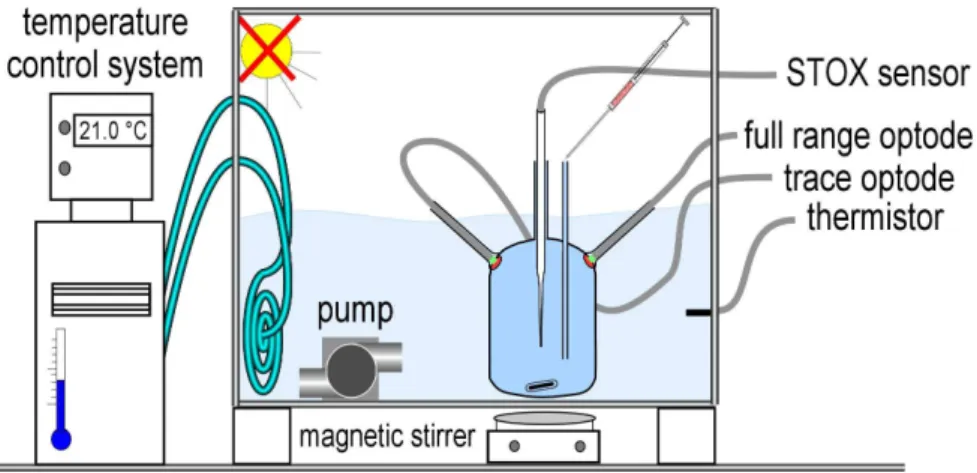
Incubation experiments using the STOX sensors have been carried out in modified Schott Duran glass bottles of 1160 ml volume (Fig. 1). The incubation bottle had two openings, one to insert the STOX sensor and another one to allow pressure compensation for temperature induced volume changes. Oxygen transport through both openings was limited to negligible amounts by diffusion through a narrow passage over a long distance. The pressure compensation port consisted of a 250 mm long glass tube penetrating the glass wall of the incubation bottle. Because of the small inner diameter (3 mm) the water inside remains stagnant and oxygen transport is possible only by means of molecular diffusion. However, the inner diameter was wide enough to allow
the injection of additives using a hypodermic needle. The STOX sensor was inserted through the second port consisting of a 30– 40 mm long glass tube. The distance between senor casing and the inner wall of the glass tube (I.D. 8 mm) was within 0.1 mm. During the incubations the bottles were kept in the dark and submersed in a temperature controlled water bath at ,21uC. Continuous stirring was applied using 2.5-cm long glass coated magnets (Fisher Scientific) at 30–60 rpm driven by magnetic stirrers (IKA) placed underneath the water bath. The stirring sensitivity of the STOX sensors was approximately 7% [13]. The stirring sensitivity is defined as the change of O2 reading in stagnant water versus vigorously stirred water. Considering that there is already a constant stirring in the incubation bottle a change of stirring speed would result in a concentration change much smaller than 7%.
Optode Spots
Optical oxygen sensors (optodes) are made of oxygen sensitive fluorescent dyes where fluorescence intensity and lifetime depends on oxygen partial pressure [18]. Optodes are widely used in aquatic research, often to monitor O2concentration over longer time periods, taking advantage of their mechanical stability and long lifetime [20,21]. In contrast to the electrochemical STOX sensor, optodes do not consume oxygen and are therefore not stirring sensitive. In this study we used non-invasive oxygen sensor spots for O2 concentrations ranging between 0–1400mmol L21 (full range spot, PST6) and 0–57mmol L21 (trace spot, PST3) together with the corresponding fiber optics and electronics from PreSens (Precision Sensing GmbH, Germany). The optode spots (diameter 4.5 mm, thickness 0.2 mm) were fixed to the inner surface of the STOX incubation bottle (Fig. 1) using acetic acid curing silicone rubber. The silicone was allowed to cure for 2 days at room temperature before the experiment. The fluorescent signal of the sensor spots was read from outside the bottle with optical fibers. The fibers were positioned within a plastic tube which was fixed perpendicularly to the outside surface of the bottle. The incubation bottle was placed in a water bath that was temperature controlled (21.1uC+/20.1) to minimize the influence of temper-ature changes on the optode readings. The water bath itself was placed inside a black plastic container to exclude light penetration. Magnetic stirring was applied as described above for the STOX sensor measurement. Oxygen concentrations were measured with both spots (full range and trace) every 5 s and recorded using the software OxyView 7.01, (ßPreSens GmbH).
18-18O
2-incubations
With this approach, O2consumption is measured as decrease of initially injected 18-18O2 over time. Due to the low natural abundance of the stable oxygen isotope 18-18O2 (,0.2%) compared to the most abundant oxygen isotope 16-16O2 (,99.8%), trace amounts of double-labelled 18-18O2 (mass 36) can be measured with high accuracy using mass spectrometry.
A saturated (,1.2 mmol L21) 18-18O2 stock solution was prepared at room temperatures (20uC) by filling a 12-mL Exetainer (Labco, UK) with He-purged, sterile seawater and replacing 1 mL of seawater with 2 mL of 99% enriched18-18O2 gas (Sigma-Aldrich, Germany). The Exetainer was shaken vigorously and stored for ,24h to ensure equilibration with respect to18-18O2.
18-18
18-18
O2concentration was measured afterwards for the entire time series at once, using membrane inlet mass spectrometry (MIMS). Another approach was used to directly compare 18-18O2 -incubations with STOX sensor measurements. In this so called direct approach, the decrease of18-18O2 and total O2over time was determined simultaneously in a single incubation bottle, using parallel STOX and MIMS measurements (see below).
The exetainer approach. Water samples were transferred into 250-mL serum bottles and purged with helium (He) for approximately 15 min to remove all O2. The headspace which develops during He-purging was removed by injecting water from a second serum bottle which was treated the same way. With a gas tight syringe, a defined volume of the18-18O2stock solution was added to the serum bottles. To ensure complete homogenization of the18-18O2a glass-coated magnet had been added to each bottle prior to sampling and the bottles were placed on a magnetic stirrer for ,10 min at ,450 rpm. From each serum bottle, 12 subsamples were transferred into 12 mL Exetainers using He-overpressure to avoid air contamination (see [22] for detailed description). The Exetainers were incubated in the dark at room temperature (,23uC). After 0, 1, 2, 4, 6 and 18 hours, biological activity was terminated in two replicate Exetainers by adding 100mL of saturated mercuric chloride. The concentration of 18-18
O2in the Exetainers was determined by membrane inlet mass spectrometry (MIMS; GAM200, IPI). The Exetainers were placed upside down and a short needle connected to the membrane inlet of the MS via a gas tight Tygon tubing was inserted into the Exetainers. Using a peristaltic pump, a sample volume of ,2.5 mL was withdrawn and replaced with He through a longer needle inserted into the Exetainers. The sample was pumped across a gas-permeable membrane with a constant vacuum on its outer side (membrane inlet of the MS). Oxygen consumption rates were calculated from simple linear regression of18-18O2decrease over time, and were corrected for the concentration of residual 16-16
O2measured in the T0 sample by the MIMS.
The direct approach. A STOX incubation bottle (Fig. 2) and a gas tight bag (,450 mL) made of plastic laminated aluminium foil were filled with the same degassed water.18-18O2 stock solution was added to the incubation bottle (kept dark) to a final concentration of 1mmol L21. A needle was inserted through the pressure compensation port into the bottle to draw subsamples for MIMS measurements (Fig. 2). The removed sampling volume
was replaced by degassed water out of the gastight bag which was transferred via a gastight Tygon tubing to the top of the pressure compensation port. Using a peristaltic pump, subsamples for the MIMS were pumped out of the incubation bottle and across a custom-built membrane inlet system with a flow rate of 0.7 mL/ min. On the vacuum side of the membrane a constant He flow ensured a stable and fast responding mass detection of the extracted gases. During the incubation, subsamples for the MIMS were pumped for 10 min every 30 minutes and continuously for the last 25 min of the incubation. Of the 10 minute intervals, only the last minute of 18-18O2 measurements was used for further processing. Concentrations from STOX and MIMS measurement were corrected for the dilution with non-labelled water from the bag.
Water Sampling and Treatment
Ethics statement. No special permission was required to access and sample the water at the following location, and no Figure 1. Incubation setup for Experiment 1.The incubation bottle was placed in a temperature controlled water bath. The 2 optodes (full range and trace) were placed on opposite sides in the upper half of the bottle. The STOX sensor was inserted through a glass tube in the center of the bottle. For calibration, known volumes of air saturated water were added through the pressure compensation port. A glass coated magnet was rotated by a magnetic stirrer below the container.
doi:10.1371/journal.pone.0089369.g001
Figure 2. Incubation setup for Experiment 2. Water in the incubation bottle was initially labeled with18-18O
2. The labeled water was pumped with a flow rate of 0.73 mL min21out of the bottle and across the membrane inlet of the mass-spectrometer. The water was replaced by degassed unlabeled water from a gas tight bag that was positioned at the upper edge of the pressure port to keep a slight overpressure. Helium was used as carrier gas for stable and fast mass detection.
endangered or protected species were involved during the sampling.
Sampling and treatment. Sea water was collected on Dec. 4th 2011 at Randers fjord (56u31912.2299N; 10u13948.5999E), which is influenced by freshwater discharge (13%salinity) of two rivers in its inner part [23]. Water was filled into canisters and transferred to the laboratory where it was stored and subsequently used for rate measurements within the following 4 days. In order to obtain very low O2concentrations in the incubation bottles, we applied the following procedure: the water was bubbled for .1 hour with N2+0.05% CO2mixture, while enclosed in a 20 L glass bottle. From this reservoir, the incubation bottles were filled using a glass tube siphon with Tygon tubing joints. The filling was performed through the pressure compensation opening of the incubation bottle (Figs. 1 and 2) while a N2 gas stream was maintained within the incubation bottle by a 5-mm Tygon tube inserted through the 8-mm sensor opening. The seawater was allowed to overflow for three volume changes before the STOX sensor was inserted. All the glassware was prepared by first washing it with 0.1 M NaOH, and subsequently with 0.1 M HCl to avoid organic contamination.
Calibration
After filling the incubation bottle with degassed water (see above), the water was incubated for approximately 4 hours until any remaining trace amounts of O2were consumed. We used the in situ zero calibration of the STOX sensor [13] to define zero O2 concentration. Zero O2 concentration was reached when the differential signal of the STOX sensor was zero. The uncertainty of the zero O2 concentration measurement is equivalent to the detection limit of the STOX sensor, which is below 10 nmol L21 [13]. In parallel, zero concentration was indicated by the optodes when the phase shift of the optode sensors showed no further increase (phase shift and O2concentrations are inversely related). The second calibration point was set by injecting known volumes of saturated water into the incubation bottle via the pressure compensation port. The added O2concentration was calculated from the volume of the incubation bottles (1160 mL), the injection volume, and the known O2saturation concentrations at the actual temperature and 13%salinity according to Garcia and Gordon
[24]. A first addition increased the concentration in the incubation bottle from zero to 1mmol L21 and was used as a second calibration point. Subsequent additions (see Figure 3 below) were used to estimate the uncertainty of this procedure by comparing the O2concentrations measured with the calibrated STOX sensor after the addition with those calculated from the added volumes and the saturation concentration. The error was less than 4.2%. For the MIMS, a two-point calibration was performed based on the 16-16O2 reading (mass 32) for air-saturated water pumped across the membrane and the18-18O2background signal (mass 36) of the stabilized signal after pump was turned off for.10min.
Experiments
Three different experiments were set up comparing the 3 different approaches to measure O2 consumption rates. In experiment 1, the STOX sensor and 2 optode spots (full range and trace O2 concentrations) were compared by measuring O2 consumption rates simultaneously in the same incubation bottle (Fig. 1). In experiment 2, O2consumption rates were measured in 18-18
O2 labeled water using simultaneous STOX sensor and MIMS measurements (Fig. 2).
In experiment 3, O2consumption rates were determined from time series of18-18O2labeled subsamples (Exetainer approach) using
MIMS. 5 different time series were measured with different initial 18-18
O2concentrations of 0.6, 0.9, 2.3, 4.4 and 9.3mmol L21.
Post-processing and Statistics
For the following rate calculations we assumed zero order kinetics, first of all because the change of concentration used for the rate calculation was usually small, and because half saturation constants for microbial respiration were expected to be in the order of 100 nmol L21[25] which is below the O2concentrations used for rate calculations in this study. Moreover, any deviation from zero order kinetics is readily detected in the residuals of the linear regression. O2 consumption rates were calculated from linear regression of oxygen concentrations over time. A crucial parameter for rate measurements is the precision of the concentration measurement, which is defined as the scatter of repeated measurements around a mean value. Assuming that the true decrease of O2was linear, we used the root mean square of the residuals (RMSRES) of the linear regression as a proxy for the precision of the O2measurements. RMSRESwas calculated from the difference between observed (C) and predicted (Cˆ ) concentra-tions and the number of individual concentration measurements (n):
RMSRES~
ffiffiffiffiffiffiffiffiffiffiffiffiffiffiffiffiffiffiffiffiffiffiffiffiffiffiffiffiffiffiffiffiffiffiffiffiffiffiffiffiffiffiffi 1
n{2 Xn
i~1
Ci{CC^i
2
s
ð1Þ
The standard error of the rate (i.e. standard error of the slope of the linear regression) was calculated from RMSRES and the difference between individual sample time points (t) and their mean (tt):
SE~ RMSffiffiffiffiffiffiffiffiffiffiffiffiffiffiffiffiffiffiffiffiffiffiRES
Pn i~1
ti{tt ð Þ2
s ð2Þ
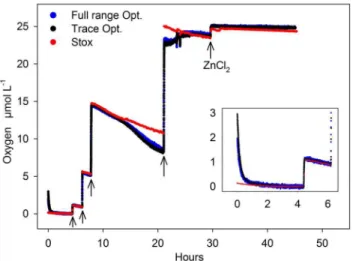
Figure 3. Experiment 1: Comparing optodes (trace and full range) and STOX sensor.Degassed water was successively enriched with oxygen by adding known volumes of air saturated water (arrows). Consumption rates were calculated after each addition from the O2 decrease over time (see Figure 4 A–C). ZnCl2was added after 30 hours to stop biological activity. The insert shows the initial adaptation of the optodes in the first few hours.
For a sample size of n.100, the term in the denominator of equation 2 can be approximated from the measuring frequency (F) and the incubation time (T) yielding the simplified equation (see Appendix S1):
SE&3:46RMSREST
{1:5F{0:5 ð3Þ
It is evident from equation 3 that the standard error of the rate decreases linearly with decreasing RMSRES, but it also decreases non linearly with increasing incubation time and measuring frequency. The incubation time was different in each experiment, which does not allow a comparison of the standard error between experiments. Moreover, the incubation time was often much less than 24 hours – the maximum incubation length during which bottle effects are assumed less significant. For each incubation we therefore estimated the standard error for an extended 24-hour incubation by inserting the respective measuring frequency and an incubation time (24 h) into Eq. 3. We further assumed that the precision does not change during the incubation, i.e. RMSRESis constant and thus the values from shorter incubations can be applied. Finally, a potential rate detection limit can be defined as two times the normalized standard error. This potential rate detection limit considers only the combined limitation from precision and measuring frequency and constitutes the lowermost detectable rate in case that other limitation such as senor drift can be diminished or excluded.
Results
Experiment 1: Comparison of STOX Sensor and Optode Spots
Experiment 1 lasted for 45 hours (Fig. 3). After the initial addition of degassed sea water, the remaining O2 (,130 nmol L21) was consumed within 4 hours (Fig. 3, insert). Increasing amounts of oxygen were added after 4.5, 6.2, 7.8 and 21 hours (Fig. 3, arrows), each followed by periods of almost constant decrease of O2 over time due to O2 consumption. Biological activity was terminated after 30 hours by adding 20 ml of 60% (w/ v) ZnCl2solution. In general, the oxygen readings of the STOX sensor and both optode spots (full range and trace) agreed well during most of the experiment. Mismatches were found in the first 2 hours, where the optode spots showed increased concentrations due to their initial adaptation to salinity and low O2concentration (Fig. 3, insert). Thereafter, the response to oxygen additions expressed as T90(i.e. the time to reach 90% of the final value) was less than 2.5 minutes. Until hour 14, the offset between STOX sensor and optodes was less than 3% of the O2concentration (e.g. the offset was 30 nmol L21at a concentration of 1
mmol L21, see Fig. 4). During the night (hour 14–20) both optode spots showed a stronger O2decrease compared to the STOX sensor (Fig. 3). The resulting offset between STOX and optode readings of 2mmol L21 was maintained during the O2 addition at hour 21 but decreased again in the morning and after the stirring speed was increased to ,100 rpm at hour 23.5. Possible reasons such as microbial growth and biofilm formation are discussed below. In the following the O2time series before the deviation of optode and STOX readings (0–14 hours) and after the addition of ZnCl2are analyzed. Figures 4 A–C show the decrease of O2subsequent to the first 3 O2additions to concentrations of 1.2, 5.5 and 14.3mmol L21. Consumption rates were calculated from linear regressions for,1.2 hour time intervals and increased from 138 to 412 nmol L21h21with increasing O2concentrations (Table 1). The offset between the different sensor readings was less than 3%, and the
consumption rates calculated from all three sensors agreed well showing a relative standard deviation (i.e. standard deviation normalized by mean value) of less than 10%.
While the rates and concentrations were nearly identical, the precision of the O2 measurement was significantly different between the sensors. The full range optode showed a large scatter of individual measurements with discrete steps of 20–30 nmol L21 (Fig. 4) indicating a limited resolution of phase and temperature readings – the underlying quantities from which O2concentrations are calculated. Consequently, a high RMSRES(Table 1) indicated a low precision of the full range optode, whereas the STOX sensor showed a high precision expressed by low RMSRES (Table 1). Nevertheless, short sampling intervals for the optode measure-ments (5 s) compared to the STOX measuremeasure-ments (390 s) lead to comparable standard errors of 2.6–12.6 nmol L21 h21 (STOX) and 2.6–4.0 nmol L21 h21 (full range optode), whereas the standard error of the trace optode was up to one order of magnitude lower (0.2–1.4 nmol L21h21). RMSRESincreased with increasing O2concentrations from 32 to 46 nmol L2
1
and from 3 to 18 nmol L21for the full range and trace optode respectively, whereas no clear trend was observed for the STOX sensor (4– 14 nmol L21). Figure 4 D shows the O
2concentration over time after the addition of ZnCl2. The consumption rates were strongly decreased but still significant with 560.7, 1560.9, and 3060.3 nmol L21 h21 calculated from trace optode, full range optode and STOX measurements, respectively.
Experiment 2: Comparison of STOX and18-18O2
Incubations
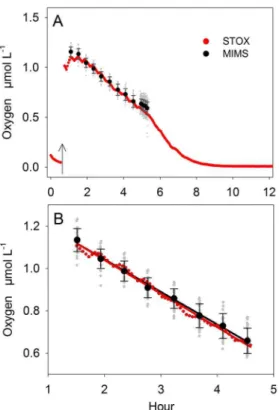
Experiment 2 lasted for 12 hours (Figure 5 A). After the initial addition of degassed sea water into the incubation bottle, O2 consumption lowered the remaining trace concentration from 0.11 to 0.045mmol L21 before 18-18O2 was added to a final concentration of 1.2mmol L21at hour 0.6 (Fig. 5A, arrow). After mixing of18-18O2for 0.4 hours the MIMS measurements started by pumping subsamples for 10 min every 30 min until hour 4.5. O2 concentrations were calculated by averaging 30 MIMS measurements taken during the last minute of the pumping interval. After hour 4.5, subsamples where pumped continuously for 24 min and O2concentrations were calculated by averaging 180 MIMS measurements over 6 min. O2consumption rates were calculated from linear regressions over a 3 hour time interval (Figure 5 B).
O2concentration measured by STOX sensor and MIMS were comparable with negligible offset (,3%) resulting in almost identical O2 consumption rates of 15962.0 and 15463.5 nmol L21h21, respectively (Table 1). Moreover, the consumption rates were comparable to those measured in Experiment 1 at similar concentrations (1mmol L21). The direct comparison of the STOX and the MIMS measurement revealed a lower precision of the MIMS measurement which was not fully compensated by its higher measuring frequency and therefore resulted in a higher standard error of 3.45 nmol L21h21(Table 1). The dilution of the incubated water during the pumping intervals was an additional source of error. Although the dilution was considered in the calculation, a slight undulation in the decrease of O2was observed by the STOX (Fig. 5B) which increased the standard error of the STOX measurement compared to the one in Experiment 1.
Experiment 3:18-18O2Incubations in Exetainers
Five different incubations with initial concentrations of 0.6, 0.9, 2.2, 4.4, and 9.1mmol18-18O2L2
1
5 time points over the first 6 hours. In all incubations 18-18O2 concentrations decreased linearly with time (Figure 6). Residual concentration of16-16O2of 2mmol L2
1
were measured in the T0 samples by the MIMS. Assuming negligible isotope fractionation, O2 consumption rates were calculated from linear regression of 18-18
O2concentrations over time and multiplied by the ratio of total O2over
18-18
O2concentrations measured at the start of the incubation. O2consumption rates ranged between 12560.6 and 20463.1 nmol L21 h21 and were increased at high initial O2 concentrations (Table 1). The precision of the18-18O2 measure-ment was comparable to those in experimeasure-ment 2 at similar O2 concentrations. However, with increasing O2concentrations the precision decreased and the standard error increased (Table 1).
Discussion
All three methods - the STOX sensor, both optode spots and the 18-18O2 incubations - were suitable to detect significant O2 consumption rates at low O2 concentrations with high precision and a relative standard error of less than 3%. The direct comparison of the methods (Experiments 1 and 2) showed an overall good agreement of O2 concentrations and consumption rates. Deviations of O2readings between optodes and STOX were observed in Experiment 1 only between hour 14 and 24 (Fig. 3). The deviation occurred during the night and disappeared in the morning after the addition of oxic water and after the stirring speed was increased. Because the linear decrease of the STOX signal seemed unaffected we assume that both optodes were simultaneously producing the signal offset. The observed signal offset corresponded to a decrease in room temperature of several
degrees during the night, which was, however, strongly damped by the water bath to a decrease of less than 0.1uC in the incubation bottles – too little to explain the signal offset. Another possibility is the O2consumption of a slowly growing microbial biofilm on the surface of the optode spots which may lead to a decrease in O2 concentrations detected by the spots. The increase of stirring speed at hour 23 could have caused a gradual erosion of the biofilm and thus a response back to unbiased O2concentrations. Although this explanation is speculative and a deviation between optode and STOX measurement was not observed in a previous experiment (data not shown), it emphasizes the potential limitation which may arise from microbial activity and growth, especially in water samples from a shallow coastal environment where microbial abundance and activity is high.
O2Consumption Rates as a Function of O2
Concentrations
In Experiments 1 and 3, we observed a significant increase of O2consumption rates with increasing O2concentrations (Figure 7). Between 0–7mmol L21, a similar trend of,25 nmol L21h21per 1mmol L21was observed for both experiments. In Experiment 1, the O2consumption rates were measured one after the other in the same incubation bottle and at increasing O2 concentrations (Figure 3) which also allows interpreting increasing rates as the result of bacterial growth or biofilm formation over time (see above). In fact, considering the O2 measurement after the deviation of STOX and optode reading (after hour 25, Figure 3), rates at O2concentrations of 24mmol L21were again similar to those at 1mmol L21(STOX:,150mmol L21h21) indicating that Table 1.Summary of measured O2consumption rates, method settings and statistics.
Exp. Sensor O2Conc. O2Rate SE RMSRES F Pot. Det. Lim.
mmol L21 nmol L21h21 nmol L21h21 nmol L21 d21 nmol L21h21
1 Trace Opt. 1.0 138.0 0.24 3.0 17280 0.007
5.1 242.9 0.70 6.2 17280 0.014
14 426.0 1.39 17.9 17280 0.039
24.7 (ZnCl2) 5.5 0.69 45.6 2880 0.245
Full range Opt. 1.0 150.0 2.55 32.2 17280 0.071
5.1 259.0 4.03 36.0 17280 0.079
14 402.0 3.59 46.5 17280 0.102
24.7 (ZnCl2) 14.9 0.92 55.2 2880 0.297
STOX 1.0 126.0 2.57 4.0 222 0.078
5.1 215.5 12.55 13.5 222 0.261
14 408.0 5.48 8.6 222 0.166
24.7 (ZnCl2) 29.5 0.34 6.6 222 0.127
2 MIMS (direct) 1.0 153.7 3.45 52.4 1860 0.350
STOX 1.0 158.5 1.96 13.3 191 0.278
3 MIMS (Exet.) 2.6 125.6 0.58 29.5 148 0.698
2.9 126.0 0.93 61.6 148 1.459
4.2 156.1 1.64 108.7 148 2.577
6.4 193.2 1.56 79.3 148 1.879
11.1 203.8 3.06 199.3 148 4.723
The O2consumption rates (O2Rate) measured at different O2concentrations (O2Conc.) and with different sensors and sampling frequencies (F) are summarized. For
each rate measurement, standard errors (SE) and root mean square of the residuals (RMSRES) were calculated from equations 1 and 2. The potential rate detection limit
of an assumed 24 hour incubation (Pot.Det.Lim.) was calculated from equation 3. Please note, a low RMSRESdenotes a high precision, and potential rate detection limits
are only based on precision and measuring frequency, but do not consider possible limitation from sensor drift or O2contamination.
the data in Experiment 1 may not illustrate a reliable effect of O2 concentrations on respiration rates. In contrast to Experiment 1, the Exetainers in Experiment 3 were incubated simultaneously at different O2concentrations and therefore bacterial growth cannot explain the different rates. Instead, rates could be limited by low O2concentrations. Although half saturation constants for micro-bial rates are assumed to be in the order of 100 nmol L21[25], O2 consumption rates can be limited already at higher concentrations if the particulate organic matter is aggregated. Inside organic aggregates, the combination of diffusion limited O2transport and high bacterial abundance can lead to the formation of anoxic zones that will increase in volume and decrease the bulk O2 consumption rate as the O2concentration outside the aggregate decreases. The diffusion limitation of O2 consumption rates depends on the O2 demand inside the aggregate, the aggregate size and the thickness of the diffusive boundary layer (DBL) around the aggregate [26]. Below a threshold O2concentration, the O2consumption rate of the entire aggregate decreases with the increase of anoxic volume. By applying and rearranging the analytical solution for solute transport and reaction in a sphere as presented by Ploug et al. [26], the O2 consumption rate of an aggregate below a threshold O2concentration can be calculated:
R~R0{R0 1{6C Dagg
R0r02
32
ð4Þ
where r0denotes the radius of the aggregate, Daggis the diffusivity within the aggregate, C is the ambient O2concentration and R0is the non limited O2 consumption rate of the aggregate. For simplicity we neglected the DBL around the sphere and we assumed zero order O2 consumption. In our study, aggregates were observed in the incubated water, but the number and size of aggregates and their specific respiration rates were not analyzed. Instead we use data from a recent study on aggregate distribution in the upwelling region off Mauritania [27] in which O2 respiration was related to aggregate diameter by R0~1:8d
1:8
using units of mm (d) and nmol h21(R0). Applying this relation and assuming a diffusion coefficient of 1.361029 m2 s21, concentration dependent rates of aggregates were calculated from Eq. 4. The shape of this function compares well with the measured decrease of O2 consumption rates in Experiment 3, when an aggregate diameter of 0.14 mm is applied in the model (dashed line in Fig. 7). Insitu measurements of aggregate sizes in the upwelling region off Mauritania [27] revealed that,80% of the aggregates were larger than 0.5 mm, and 30–60% were larger than 1 mm in diameter. For this size distribution, the calculations clearly show that diffusion limited rates can be expected at concentrations below,20mmol L21. Rate measurements at low O2are therefore challenged by the difficulty to reproduce insitu conditions with respect to shear stress and aggregate size, raising the question which incubation approach is best to meet these requirements. A thorough discussion of the optimal treatment is beyond the scope of this study and furthermore depends on the Figure 4. Experiment 1: Comparison of O2 decrease over time.The O2consumption measured by optodes and STOX sensor after the adjustment to O2concentrations of 1.2mmol L21(A), 5.5mmol L21(B) and 14.3mmol L21(C), and after the addition of 20 ml ZnCl2(D). Linear fits are indicated by the straight lines. Please note, the aspect ratio of time and concentration axis (mmol L21to hour) is the same for all figures to allow
comparison of slopes.
objectives of the incubation experiment. For example, determining half saturation constants for O2 respiration on a cellular level would require strong disaggregation and thus a high stirring speed, whereas assessing in situ consumption rates requires that shear stress is lowered to a minimum and in situ aggregate size distribution is maintained.
Potential Detection Limits of Rate Measurements The O2 consumption rates measured in all incubations were between 30 and 426 nmol L21 h21, which is comparable with previous rates measured in coastal shallow waters [11]. However, O2consumption in the open Ocean, especially below the euphotic zone, is expected to be much lower, at approximately 1 nmol L21 h21[9]. Assessing the potential of each method for measuring low rates, a rate detection limit for a 24 hour incubation was calculated from Eq 3. This rate detection limit is a potential limit as it is based only on sensor precision and measuring frequency, but neglects limitations from sensor drift and O2contamination (see below). The potential rate detection limits ranged from 4.7 nmol L21h21(Exetainer, at high O2) to as low as 7 pmol L21 h21(trace optode, at low O2), and most detection limits were 1–2 orders of magnitude below the target rate of ,1 nmol L21h21 (Table 1). All approaches show highest precision and lowest detection limits at low O2concentrations. Especially both optodes show an almost linear decrease of the detection limit with decreasing O2concentrations which is well explained by the non-linear response of the fluorescent signal to changing O2 concentrations [18]. Extrapolation of the detection limit to concentrations of 60mmol L21(trace optode) and 200mmol L21
(full range optode) results in a detection limit of 0.5 nmol L21h21 for both cases. Because the concentration dependent increase of detection limit is stronger for the trace optode compared to the full range optode the latter should be used for rate measurements at concentrations above 30mmol L21.
Given that the incubation time of 24 hours cannot be extended and that the precision, in case of MIMS and optodes, cannot be improved by the user, only the increase of measuring frequency can further decrease the detection limit. More Exetainers can be filled to increase the number of samples and the measuring frequency of the optodes can be increased to up to 1 s21. The measuring frequency of the STOX sensor, however, is limited by its inherent response time [13], which is specific to the individual sensor. An increase of measuring frequency by shorter switching intervals of the front guard decreases the precision because of the exponential signal response after each switch. Nevertheless, technical improvements of the STOX could shorten the response time and thus the switching intervals.
Figure 5. Experiment 2: Comparing MIMS and STOX sensor.O2 concentration and consumption rates measured after the addition of 1.2mmol18-18O2L21(arrow) (A). Individual MIMS measurements (grey dots) are averaged (black dots) and presented with the respective standard deviation. From the entire experimental run 3 hours of simultaneous measurements (B) were used for rate calculations. doi:10.1371/journal.pone.0089369.g005
Figure 6. Experiment 3: Time series of18-18O2concentrations in
Exetainers.The O2consumption in 5 incubations with different initial 18-18O
2concentrations was measured. For each Exetainer, individual MIMS measurements are averaged (black dots) and presented with the respective standard deviation.
doi:10.1371/journal.pone.0089369.g006
Figure 7. O2consumption rates versus O2concentrations.The
Specific Limitations of Rate Measurements
The rate detection limits discussed above are derived from statistical measures of short incubations with rather high consumption rates and should be treated as potential detection limits. There are other effects that may interfere with the measurements and increase the detection limit. Long term drift is a common problem of many sensors. The STOX sensor alternates each measurement with a zero calibration to reduce the effect of sensor drift. However, a remaining drift of up to 0.14% of the O2concentration per hour was recently reported (Tiano et al. in review), which would result in a drift of 1.4 nmol L21h21at O2 concentrations of 1mmol L21. The detection limit of the STOX sensor may be therefore more than one order of magnitude higher due to sensor drift compared to the detection limit due to sensor precision and measuring frequency (0.08 nmol L21h21at 1
mmol L21, Table 1). The optodes do not have a regular zero calibration, but rely on the high stability of their signal and calibration curve. A small drift in optode measurements is caused by photobleaching, i.e. the photochemical destruction of the fluorescent dye, which depends on the number of oxygen readings. According to the sensor specifications given by the manufacturer (www.presens.de) the drift was less than 0.002 and ,0.05 nmol L21 h21, for the trace and full range optode, respectively, which is in the range of the calculated potential rate detection limits. However, photo-bleaching causes a decay in fluorescent intensity and affects fluorescent lifetime measurements to result in a positive drift, i.e. increasing O2readings over time. The measured O2consumption rates are therefore conservative estimates. For the MIMS measurement, a linear drift was considered using calibrations before and after the measurement. The good agreement between STOX and MIMS measurement in experiment 2 (Fig. 5) shows that a linear drift correction of the MIMS measurement (drift 0.8% h21) was suitable.
Oxygen leakage into the incubation vial is another potential limitation for rate measurements, especially at low O2. In experiment 1+2, the diffusive O2 transport across the two ports of the incubation bottle can be neglected. Assuming O2diffusivity of 161029m2s21and a maximum O2difference within the ports of 300mmol L21 a steady state flux would increase the O2 concentrations inside the incubation bottle by ,0.08 nmol L21 h21, which is a very conservative estimate as the time to reach a steady state flux is not considered in this calculation. Oxygen contamination in anoxic incubations using Exetainers was reported recently by De Brabandere et al. [28] who measured O2 contaminations of 300–400 nmol L21 introduced by butyl rubber septa of the caps of the Exetainers. In experiment 3, the residual concentrations of 16-16O2 were significantly higher (2mmol L21). The reason was most likely the high initial O2 concentration of the sea water used in this study, which apparently
could not be completely removed by degassing with He for 15 minutes (see method section). Application of the Exetainer approach using low oxygen water from the Namibian OMZ (Kalvelage et al. in prep.) revealed residual O2concentrations of less than 500 nmol L21, measured with STOX sensor after degassing, filling and capping of the Exetainers. For future studies we recommend to use deoxygenated butyl rubber septa as described by De Brabandere et al. [28] to minimize O2 contamination.
In principal, the combined effect of sensor drift and O2leakage rates can be estimated by a dead control incubation. In experiment 1, the incubated water was poisoned after 30 hours by adding 20 ml 60% ZnCl2. Interestingly, the STOX sensor and both optodes were still measuring O2consumption rates between 5 and 30 nmol L21h21(Table 1). At O2concentrations of 25mmol L21, a drift of the STOX sensor of 0.14% could explain the O2 decrease of 30 nmol L21h21. However, the rates measured by the optodes cannot be explained by sensor drift, which would have resulted in increasing O2rates of less than 0.1 nmol L21h21. The remaining O2consumption rather suggests that not all biological activity was terminated or that the O2consumption was abiotic, eventually stimulated by the addition of ZnCl2. Instead of poisoning the sample after the incubation experiment we recommend running a control incubation using autoclaved, sterile and acidified water to quantify sensor drift and O2leakage.
Assets and Drawbacks of the Different Methods
The STOX sensor and the optodes provide continuous on-line measurements which allow detailed time series analysis as well as immediate correction and experimental adjustment. Furthermore, STOX sensor and optodes have the potential to detect very low rates (Table 2), because of their high precision (STOX) and high measuring frequency (optodes). In comparison, the rate detection limit is higher for the MIMS measurement, because the precision is less and the amount of individual samples is limited either by the amount of subsamples that can be pumped in the direct MIMS approach or the number of time points in the Exetainer approach. However, the methods with high precision and low rate detection limit (STOX, both optodes) rely on highly controlled measuring environments (optodes: stable temperature), on fragile and pricy sensors (STOX) and on extensive and often expensive periphery equipment, which requires considerable lab space on board or close to the sampling site. This limits the number of parallel incubations and replicates necessary to cover a large spatial heterogeneity in the field.
In contrast, the Exetainer incubations allow for a high number of parallel incubations, and to some extend the incubation in individual Exetainers already considers the heterogeneity of the water sample. The samples are fixed and collected during the field Table 2.Method comparison with respect to precision, detection limit and applicability.
Exp. Method Precision Meas. Freq. Pot. Det. Lim. Fragility Handling Price
1 STOX +++ ++ +++ + ++ +
1 Optode (trace) +++ +++ +++ +++ ++ +++
1 Optode (full range) ++ +++ +++ +++ ++ +++
2 MIMS (direct) ++ ++ ++ + + +++
3 MIMS (Exet.) ++ + + +++ +++ +++
The rating scheme is: regular (+), strong (++), and very strong (+++). Besides the precision, measuring frequency and potential rate detection limit, the sensor fragility, the handling in the field and the price of the consumables (sensor or label) are compared.
trip and can be processed later in the lab. Moreover, the Exetainer approach is easily combined with e.g. 13C and 15N labelling experiments [22] which allows investigating the C-cycle and N-cycle under dynamic oxygen conditions. This advantage holds especially for the direct MIMS measurement where oxygen consumption can be monitored with high temporal resolution in parallel to the production of gaseous N-species [29]. In general, there is great potential in combining any of the described O2 sensing methods with15N labelling experiments to investigate the kinetics of nitrogen transformation processes (T. Dalsgaard et al. in prep.).
Conclusions
In summary, all methods were suitable to detect O2 consump-tion rates in the range of a few nmol L21 h21 and at low O2 concentrations, representing rates and conditions as expected in the open Ocean and OMZs. Specific limitations of the rate measurements such as sensor drift (STOX) and oxygen contam-ination (Exetainer) need to be minimized to fully exploit the low detection limits derived from the sensor specific precision and measuring frequency. Potential detection limits for a 24 hour incubation were a few nmol L21h21or less, but differed among the methods. For continuous measurements and extremely low
rates the STOX sensor and optodes are recommended, whereas the Exetainer/MIMS approach with 18-18O2 addition is recom-mended for many parallel incubations and simple handling in the field. A specific challenge for incubations at low O2concentrations is the presence of aggregates in which diffusion limited rates can be expected at concentrations below ,20mmol L21. To consider diffusion limited O2 consumption, a more refined sample treatment is needed that better reproduces in situ conditions with respect to aggregate size and distribution.
Supporting Information
Appendix S1 Mathematical derivation of equation (3) for calculating the Standard Error from measuring frequencies and incubation times.
(DOC)
Author Contributions
Conceived and designed the experiments: MMMK NPR GL TK MH LT. Performed the experiments: MH LT TK. Analyzed the data: MH LT TK. Contributed reagents/materials/analysis tools: NPR MMMK. Wrote the paper: MH LT TK.
References
1. Gustafsson BG (2001) Quantification of water, salt, oxygen and nutrient exchange of the Baltic Sea from observations in the Arkona Basin. Continental Shelf Research 21: 1485–1500.
2. Konovalov SK, Murray JW, Luther GW, Tebo BM (2006) Processes controlling the redox budget for the oxic/anoxic water column of the Black Sea. Deep-Sea Research Part II-Topical Studies in Oceanography 53: 1817–1841. 3. Karstensen J, Stramma L, Visbeck M (2008) Oxygen minimum zones in the
eastern tropical Atlantic and Pacific Oceans. Progress in Oceanography 77: 331–350.
4. Olson DB, Hitchcock GL, Fine RA, Warren BA (1993) Maintenance of the Low-Oxygen Layer in the Central Arabian Sea. Deep-Sea Research Part Ii-Topical Studies in Oceanography 40: 673–685.
5. Diaz RJ, Rosenberg R (2008) Spreading dead zones and consequences for marine ecosystems. Science 321: 926–929.
6. Deutsch C, Brix H, Ito T, Frenzel H, Thompson L (2011) Climate-Forced Variability of Ocean Hypoxia. Science 333: 336–339.
7. Stramma L, Johnson GC, Sprintall J, Mohrholz V (2008) Expanding oxygen-minimum zones in the tropical oceans. Science 320: 655–658.
8. Keeling RF, Koertzinger A, Gruber N (2010) Ocean Deoxygenation in a Warming World. Annual Review of Marine Science. 199–229.
9. Suess E (1980) Particulate Organic-Carbon Flux in the Oceans - Surface Productivity and Oxygen Utilization. Nature 288: 260–263.
10. Taylor GT, Gulnick JD (1996) Enhancement of marine bacterial growth by mineral surfaces. Canadian Journal of Microbiology 42: 911–918.
11. Loebl M, Dolch T, van Beusekom JEE (2007) Annual dynamics of pelagic primary production and respiration in a shallow coastal basin. Journal of Sea Research 58: 269–282.
12. Morrison JM, Codispoti LA, Smith SL, Wishner K, Flagg C, et al. (1999) The oxygen minimum zone in the Arabian Sea during 1995. Deep-Sea Research Part Ii-Topical Studies in Oceanography 46: 1903–1931.
13. Revsbech NP, Larsen LH, Gundersen J, Dalsgaard T, Ulloa O, et al. (2009) Determination of ultra-low oxygen concentrations in the oxygen minimum zone by the STOX sensor. Limnology and Oceanography: Methods 7: 371–381. 14. Kalvelage T, Lavik G, Lam P, Contreras S, Arteaga L, et al. (2013) Nitrogen
cycling driven by organic matter export in the South Pacific oxygen minimum zone. Nature Geoscience 6: 228–234.
15. Thamdrup B, Dalsgaard T, Revsbech NP (2012) Widespread functional anoxia in the oxygen minimum zone of the Eastern South Pacific. Deep-Sea Research Part I-Oceanographic Research Papers 65: 36–45.
16. Dalsgaard T, Thamdrup B, Farias L, Revsbech NP (2012) Anammox and denitrification in the oxygen minimum zone of the eastern South Pacific. Limnology and Oceanography 57: 1331–1346.
17. Jensen MM, Lam P, Revsbech NP, Nagel B, Gaye B, et al. (2011) Intensive nitrogen loss over the Omani Shelf due to anammox coupled with dissimilatory nitrite reduction to ammonium. ISME Journal 5: 1660–1670.
18. Klimant I, Meyer V, Kuhl M (1995) Fiberoptic Oxygen Microsensors: a New Tool in Aquatic Biology. Limnology and Oceanography 40: 1159–1165. 19. Revsbech NP, Thamdrup B, Dalsgaard T, Canfield DE (2011) Construction of
STOX Oxygen Sensors and Their Application for Determination of O2 Concentrations in Oxygen Minimum Zones. Methods in Enzymology: Research on Nitrification and Related Processes, Vol 486, Part A. 325–341.
20. Tengberg A, Hovdenes J, Andersson HJ, Brocandel O, Diaz R, et al. (2006) Evaluation of a lifetime-based optode to measure oxygen in aquatic systems. Limnology and Oceanography: Methods 4: 7–17.
21. Uchida H, Kawano T, Kaneko I, Fukasawa M (2008) In Situ Calibration of Optode-Based Oxygen Sensors. Journal of Atmospheric and Oceanic Technol-ogy 25: 2271–2281.
22. Holtappels M, Lavik G, Jensen MM, Kuypers MMM (2011)15 N-Labeling Experiments to Dissect the Contributions of Heterotrophic Denitrification and Anammox to Nitrogen Removal in the OMZ Waters of the Ocean. In: Martin GK, editor. Methods in Enzymology: Academic Press. 223–251.
23. Nielsen K, Somod B, Ellegaard C, Krause-Jensen D (2003) Assessing Reference Conditions According to the European Water Framework Directive Using Modelling and Analysis of Historical Data: An Example from Randers Fjord, Denmark. Ambio 32: 287–294.
24. Garcia HE, Gordon LI (1992) Oxygen solubility in seawater: Better fitting equations. Limnology and Oceanography 37: 1307–1312.
25. Stolper DA, Revsbech NP, Canfield DE (2010) Aerobic growth at nanomolar oxygen concentrations. Proceedings of the National Academy of Sciences of the United States of America 107: 18755–18760.
26. Ploug H, Ku¨hl M, BuchholzCleven B, Jørgensen BB (1997) Anoxic aggregates -an ephemeral phenomenon in the pelagic environment? Aquatic Microbial Ecology 13: 285–294.
27. Iversen MH, Nowald N, Ploug H, Jackson GA, Fischer G (2010) High resolution profiles of vertical particulate organic matter export off Cape Blanc, Mauritania: Degradation processes and ballasting effects. Deep Sea Research Part I: Oceanographic Research Papers 57: 771–784.
28. De Brabandere L, Thamdrup B, Revsbech NP, Foadi R (2012) A critical assessment of the occurrence and extend of oxygen contamination during anaerobic incubations utilizing commercially available vials. Journal of Microbiological Methods 88: 147–154.