*e-mail: [email protected]
Recebido: 03/04/2012 / Aceito: 22/10/2012
Mathematical modeling of dilatometric behavior of 420A and 440C
martensitic stainless steels used in surgical tools
José Renato Jatobá Marcuci, Claudia Cristiane Camilo*, Pedro Luiz Di Lorenzo, João Manuel Domingos de Almeida Rollo
Abstract This research consisted of implementing and evaluating an empirical mathematical model to reproduce analytically the dilatometric behavior of ASTM 420A and ASTM 440C martensitic stainless steels, widely used for manufacturing surgical tools. Martensitic stainless steels can be subdivided into three subgroups: low-carbon, medium-carbon and high-carbon steels. The microstructure of each group is also characteristic as needlelike martensitic; very ine martensitic; and ultra-ine martensitic containing carbides. The proposed method was based on experimental data obtained from the dilatometric testing of the steel samples applying low heating rates. It was possible to determine the formation of phase ields near the equilibrium conditions. The method, being based on empirical data, ensured a greater approximation to the experimental values, verifying that it can be applied as a useful tool in the evaluation of industrial heat treatments for surgical tools.
Keywords Dilatometric test, Mathematical modeling, Phase transformation, Martensitic stainless steels, Surgical tools.
Modelamento matemático de ensaio dilatométrico em aços inoxidáveis
martensíticos 420A e 440C utilizados em ferramental cirúrgico
Resumo O presente trabalho consistiu em implementar e avaliar um modelo matemático empírico que reproduz analiticamente o comportamento dilatométrico dos aços inoxidáveis martensíticos ASTM 420A e ASTM 440C, utilizados em ferramental cirúrgico. Aços inoxidáveis martensíticos podem ser subdivididos em três subgrupos, ou seja, baixo carbono; médio carbono e alto carbono. A microestrutura de cada grupo é caracterizada por
martensita em forma de agulha; martensita ina e martensita ultra-ina contendo carbetos. A elaboração do
método matemático se baseou em dados extraídos de ensaios dilatométricos sob baixas taxas de aquecimento.
Foi possível determinar a formação dos campos de fase próximos às condições de equilíbrio. Os resultados obtidos garantiram boa aproximação com os valores experimentais, evidenciando que o modelo aplicado é um instrumento útil na avaliação dos tratamentos térmicos industriais para ferramental cirúrgico.
Introduction
The ASTM 420A and ASTM 440C martensitic stainless steels are widely used in the manufacturing of surgical
tools because this application requires excellent
mechanical properties and corrosion resistance. During steel selection, a role of thumb is that mechanical strength gains are linked to losses in toughness and ductility. In the case of stainless steels this compromise is even more critical because, in general, the steels that have better mechanical properties, such as the martensitic steels, have low corrosion resistance when compared with the traditional austenitic or ferritic steels (Totten, 2006).The phase transformations can be studied to indicate the most appropriate route of thermal treatments for steels and to investigate the
application of the material. The ields present in the
phases together with the corrosion resistance and mechanical properties are essential characteristics for applications such as the manufacturing of surgical tools. Obtaining the diagrams of continuous cooling and heating transformations (CCT and CHT) is of fundamental importance for the planning and design of industrial thermal processes, as they reveal the
temperatures which determine the austenitizing ield
and thus enable an evaluation of the dissolution of carbides. This information can be used to avoid precipitation at the grain boundaries, a subject of interest in relation to the corrosion resistance and mechanical properties in the processing of materials for use as surgical tools.
Dilatometry is a technique applied to study phase
transformations in solid state, allowing real-time monitoring of the transformation progress in terms of dimensional changes, according to the thermal cycling program (Caballero et al., 2001a; Gomez
and Medina, 2003). Using this technique diagrams
of the dilatometry temperature variation versus the length of the material are obtained under controlled heating and cooling. As the phase transformations are related to the volume variation, proportionally
to the linear variation, the inlection points on the dilatometry curve (variation in the angular coeficient)
characterize the phase transformation.
The analysis of the dilatometric behavior of martensitic stainless steels during thermal treatment provides important information on the temperatures
of phase transformations and ields of solid solubility,
essential for the correct programming of the thermal treatment of steels for the manufacture of surgical tools.
Dilatometry allows heating curves to be plotted
with rates close to the equilibrium of the material phases, with emphasis on the ield solubility of the
phases as evidenced by the CHT diagrams.
The modeling of phase transformations allows the behavior of the material to be predicted without applying the dilatometric test, which is faster than
the techniques previously applied to determine
appropriate heat treatments. The modeling of phase transformations has been studied by several researches (Caballero et al., 2011b, 2002; Cho et al., 2011; Suh, 2007). According to Cho et al. (2011), the nonisotropic dilatometric behavior can be successfully reproduced
using the inite element (FE) simulation considering
the transformation plasticity. The transformation plasticity was caused by the small amount of stress that naturally developed in the specimen during the dilatometric experiment. Suh (2007) proposed that the anisotropic volume change of the dilatometric specimen, which is normally observed during the phase transformation of conventional low-carbon steel, may be caused by the transformation plasticity under the very small external force supplied to support it during the dilatometric experiment. Caballero et al. (2002) carried out an experimental validation of the kinetics model for the austenite formation by comparing the experimental and theoretical heating dilatometric curves. They found that the experimental transformation kinetics, the critical temperatures, and the magnitude of the overall contraction due to austenite formation were accurately reproduced by dilatometric calculations.
One of the aims of this study was to apply dilatometry to produce a CHT diagram and apply it to steels used to produce surgical tools or as material for implants. Consultation of the diagram is essential in the context of the metallurgy of steels, since structures submitted to thermal treatment can develop a heterogeneous microstructure due to the anisotropic conditions, compromising the mechanical resistance and also the corrosion of the biomaterials.
This paper proposes an empirical mathematical model to reproduce analytically the dilatometric behavior of ASTM 420A and ASTM 440C martensitic stainless steels, widely used as surgical tools.
Materials and Methods
The martensitic stainless steels studied complied with the recommendations of American Society for
Testing and Materials (ASTM) F899-02 (2002) for
stainless steel used for the manufacture of surgical materials. The compositions, in percent weight, are shown in Table 1.
Obtaining the dilatometric curves
The continuous heating curves were obtained with the aid of a bench dilatometer (Netzsch DIL 402 C), according to American Society for Testing and
Empirical method for developing the mathematical modeling
It was considered for the development of the analytical model, before and after the processing phase, that the material consists of a single phase and that the kinetic
parameters of the ields in this phase do not change.
The analytical calculation was performed using three
equations, the linear variation with temperature, and a ield for each phase before, during and after
processing. The parameters of the mathematical functions were experimentally obtained from the
ive dilatometric curves with heating rates close to equilibrium conditions. From ambient temperature to Ac1 (ield I) the material was composed of phase A, whereas at AC3 (ield III) it was composed of phase B. The functions of these two regions are irst degree, since the slope is constant (Figure 1).
Field II (transformation) is represented by a
composite function, that is, the sum of functions 1
and 3, however, with coeficients that represent the fractions of phases A and B (Figure 1).
f1 = aT + b (1)
f2 = nAf1 + nBf3 (2)
f3 = cT + d (3)
The term nA represents the fraction of phase A
depending on the temperature in ield II (Ac1 and Ac3). The term nB is a function of fraction phase B
and thus,
nB = 1 – nA (4)
The linear coeficient and the constant terms relating to ields I and II were calculated for each
dilatometric curve. These are the average values that determine parameters a, b, c and d characterizing the functions f1 and f3.
To calculate the fraction of phases, the lever rule was applied to the transformation region (Ac1 to Ac3)
for each curve (Figure 2). The fraction of phase A is
considered y
x+y and of phase B x
x+y, where x is the
distance between the extended line of ield I (f1) and the dilatometric curve, and y is the distance between
the extended line of ield III (f3) and the dilatometric curve (Gomez and Medina, 2003).
The function to express the behavior of the fractional variation of each phase (nA and nB), as a function of temperature, was obtained by the least
squares method (LSM) from the experimental points
related to the fraction of each phase, which were determined from the dilatometric curve using the lever rule.
Results
Diagram of heating curves for steels ASTM 420A and 440C
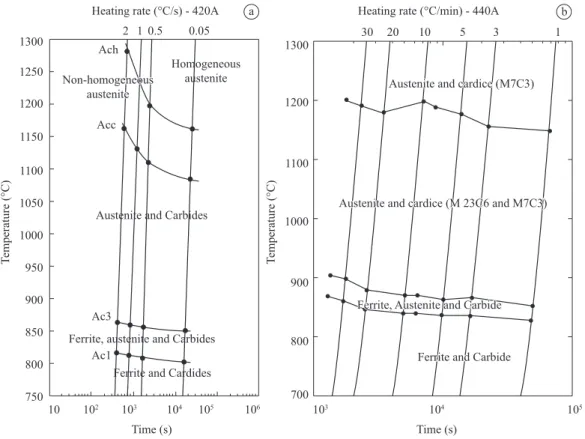
The critical temperatures of Ac1 and Ac3 for steels 420A and 440C were determined from the dilatometric tests performed with continuous heating in the dilatometer. The thermal cycle was started at room temperature and the temperature was then increased to 1250 °C, with a soaking time of 2 minutes and natural cooling (shutdown of the dilatometer furnace). The heating rate varied between 1 °C/min and 10 °C/min, providing a dilatometric behavior close to that of the
thermal equilibrium state (low heating rates). The
results shown in Table 2 were used to construct the
CHT diagrams. (Figure 3).
Figure 1. Phase ields considered in the proposed mathematical model. Table 1. Chemical composition (percent weight) of ASTM 420A and ASTM 440C stainless steels.
Type C Mn (Max) P (Max) S (Max) Si (Max) Cr Other elements
420A 0.16-0.25 1.00 0.040 0.030 1.00 12.00-14.00 Ni 1.00 max
440C 0.95-1.20 1.00 0.040 0.030 1.00 16.00-18.00 Mo 0.75 max
Mathematical Modeling of ASTM steels 420A and 440C
According to the proposed procedures, the coeficients
a, b, c and d were calculated for the functions f1 and f3 (Table 3). These calculations were carried out using the software Netzsch Proteus Thermal Analysis.
Applying the lever rule, the experimental fraction
of phase B was calculated from the curve diagrams
obtained. Figure 4 shows some polynomial functions calculated using the least squares method based on
the experimental points. The polynomial function that
best represented the behavior of the phase B fraction
as a function of temperature was the fourth-degree polynomial, because it represented the nucleation tendency of the phase more smoothly, ensuring that more values were consistent with the experimental points, particularly at the beginning (T – Ac1 = 0) and end (TT = Ac1 – 50) of the processing.
Therefore,
-3 -2
-4 2 -5 3
-7 4
nb(T) = 2.35 10 + 1.69 10 (T - Ac1) + 8.2 10 (T - Ac1) - 2.33 10 (T -Ac1) + 1.58 10 (T - Ac1)
⋅ ⋅
⋅ ⋅
⋅
(5)
The same principle was used to calculate the
fraction of phase B as a function of temperature
throughout the transformation. Data taken from curve
Table 3. Coeficients a, b, c and d for the functions of the 420A (a) and 440C (b) martensitic stainless steels.
Material f1 f3
a b c d
Steel 420A 1.15 × 10⁻⁵ –2.94 × 10⁻⁴ 2.54 × 10⁻⁵ –1.39 × 10⁻²
Steel 440C 1.28 × 10⁻⁵ –5.86 × 10⁻⁴ 2.63 × 10⁻⁵ –1.46 × 10⁻²
Table 2. Values for the Ac1 and Ac3 temperatures of 440C and 420A stainless steels obtained by dilatometry.
Heating Rate (°C/min)
Steel 420A Steel 440C
Ac1 (°C)
Ac3 (°C)
Ac1 (°C)
Ac3 (°C)
10 812.4 855.3 844.3 873.9
8 807.7 851.5 843.4 873.8
5 804 850.9 840.1 867.5
3 801.2 849.5 839.7 869.1
1 796.8 847 832.2 855.2
Figure 3. CHT (Continuous Heating Transformation) diagrams of 420A (a) and 440C (b) martensitic stainless steels.
diagrams and the polynomial curve obtained with the
least squares method (LSM) are shown in Figure 5. The ifth-degree polynomial showed the best behavior for the fraction of phase B as a function
of temperature, as it was closer to the experimental points and the curve was smoother in the region of
inal transformation. This fraction tended to stabilize
at above 30 °C. Thus,
-3 2
3 2 6 3
6 4 8 5
nB(T) = 6.1 10 + 1.4 10 (T Ac1)
+ 1.6 10 (T Ac1) + 4.61 10 (T Ac1)
2.1 10 (T Ac1) + 2.87 10 (T Ac1)
−
− −
− −
⋅ ⋅ −
⋅ − ⋅ −
− ⋅ − ⋅ −
(6)
The inal results obtained for the analytical equations for the empirical method were as follows:
Steel 420A
-5 -4
1 1
To T < Ac1: f = aT + b > f = 1.15 10⋅ ⋅T - 2.94 10⋅ (7)
2 A 1 B 3 2
-5 -4
-5 -2
nB
To Ac1 < T < Ac3:f = n f + n f > f
= (1 - nB)(1.15 10 T - 2.94 10 ) + (2.54 10 T - 1.39 10 )
⋅ ⋅ ⋅
⋅ ⋅ ⋅
(8)
5 2
3 3
To T > Ac3: f = cT + d > f = 2.54 10− T 1.39 10−
⋅ ⋅ − ⋅ (9)
Steel 440C
-5 4
1 1
To T < Ac1: f = aT + b > f = 1.28 10 T 5.86 10− ⋅ ⋅ − ⋅ (10)
2 A 1 B 3 2
5 4
5 2
nB
To Ac1 < T < Ac3:f = n f + n f > f
= (1 nB)(1.28 10 T 5.86 10 )
+ (2.63 10 T 1.46 10 )
− −
− −
− ⋅ ⋅ − ⋅
⋅ ⋅ − ⋅
(11)
3 3
5 2
To T > Ac3: f = cT + d > f
= 2.63 10− T 1.46 10−
⋅ ⋅ − ⋅
(12)
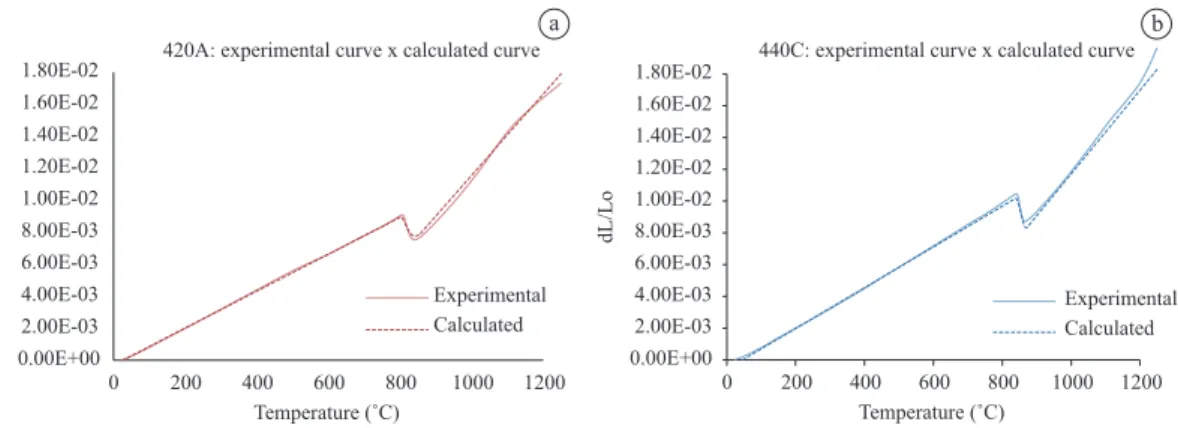
Figure 6 shows a comparison between the curves
obtained with the empirical data and from dL/L0 × T obtained by dilatometry, both at a heating rate of
5 °C/min. Before the α → γ transformation, 420A and 440C steels do not undergo phase changes after the kinetic behavior of a crystalline structure is observed.
Because of this, the curve obtained with the modeling
reproduced the behavior observed experimentally
almost perfectly in this region. Following the
transformation distortions in the dilatometry curves appeared due to the carbide precipitates dissolved in the material. Such distortions were not reproduced by the mathematical model because the occurrence of the dissolution of precipitates was disregarded, and it was considered that the material has only one phase after the transformation.
a b
Figure 6. Experimental curve versus curve calculated analytically for steels (a) 420A and (b) 440C. Figure 4. Polynomial functions calculated by the LSM. Mathematical
modeling of steel 420A.
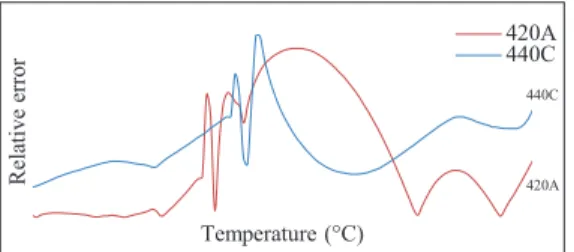
Figure 7 shows the relative error calculated based
on the dL/L0 obtained by dilatometry, in other words, the absolute difference between the actual and the calculated values divided by the actual value. The largest error was in the region after the transformation; however, this is below 5%, which is reasonably acceptable even considering the uncertainty associated
with the equipment.
Discussion
The study reported herein resulted from observation of reaustenitizing thermal treatments followed by hardening and tempering of martensitic stainless steels for surgical tools, produced in industrial furnaces.
Based on the phase transformation parameters
obtained in the continuous-heating dilatometric test it was possible to construct diagrams of the continuous
heating transformation, from which ive ields of
heating rate-dependent phases can be determined: ferrite and carbides; ferrite, austenite and carbides; austenite and carbides; non-homogeneous austenite; and homogeneous austenite, of the two martensitic stainless steels.
The analytical calculation was performed using
three equations, the linear variation with temperature and a ield for each phase before, during and after
processing. The parameters of the mathematical functions were experimentally obtained from the
ive dilatometric curves with heating rates close to equilibrium conditions.
In this study, the ifth-degree polynomial showed the best behavior for the fraction of phase B as
a function of temperature, as it was closer to the experimental points and the curve was smoother in
the region of inal transformation. This fraction tended
to stabilize at above 30 °C. Such distortions were not reproduced by the mathematical model, due to the dissolution of precipitates which was disregarded, and it was considered that the material has only one phase after the transformation.
In this study, the method based on empirical data ensured a greater approximation to the experimental values, showing that the applied model is a useful tool in
the evaluation of industrial heat treatments for materials used to produce surgical tools. Martensitic stainless steel type AISI-420 is a material widely used in this context (Caballero et al., 2002; Rodrigues et al., 2009) and these tools present premature corrosion problems after cleaning and sterilization as well as cutting edge loss and/or rupture during surgical procedures.
The relative change in length which occurs during the austenitization process was calculated as a function of temperature, according to Caballero et al. (2002).
Experimental validation of the kinetics model for the
austenite formation was carried out by comparison between the experimental and theoretical heating dilatometric curves. The experimental transformation kinetics, critical temperatures Ac1 and Ac3, as well as the magnitude of the overall contraction due to austenite formation were accurately reproduced by dilatometric calculations.
Conclusions
Dilatometric tests were performed under conditions of low heating rates, enabling the determination of the
ields of the phase formations through the obtainment
of CHT (Continuous Heating Transformation) diagrams and their correlation with the industrial heat treatment of martensitic stainless steels used in the manufacturing of surgical tools. In many cases the CHT diagrams, which provide the temperatures for the thermal treatment in the austenitization of steels, are not available in the industrial context, and thus there is
a risk that a homogeneous austenite ield will not be achieved. Consequently, after the hardening and
annealing treatments there may be a heterogenic microstructure which leaves the material susceptible to corrosive attack and heterogeneity in the mechanical properties due to the anisotropic conditions.
The proposed mathematical method was found
to be eficient in the analytical reproduction of the
α → γ transformation in martensitic stainless steels since, based on empirical data, it provided low relative errors and ensured good approximation to the experimental values.
Acknowledgements
The authors would like to acknowledge FAPESP, CNPq and CAPES in Brazil for the technical and inancial support provided for this research.
References
Authors
José Renato Jatobá Marcuci, Claudia Cristiane Camilo*, João Manuel Domingos de Almeida Rollo Programa de Pós-graduação Interunidades em Bioengenharia, Escola de Engenharia de São Carlos – EESC,
Instituto de Química de São Carlos – IQSC, Faculdade de Medicina de Ribeirão Preto –FMRP, Universidade de São Paulo – USP, Av.Trabalhador Sancarlense, 400, Parque Arnold Schimidt, CEP 13566-590, São Carlos, Brasil.
Pedro Luiz Di Lorenzo
Departamento de Engenharia de Materiais, Escola de Engenharia de São Carlos, Universidade de São Paulo – USP, Av. Trabalhador Sancarlense, 400, Parque Arnold Schimidt, CEP 13566-590, São Carlos, Brasil.
American Society for Testing and Materials – ASTM. E0228-06: Standard test method for linear thermal expansion of solid materials with a push-rod Dilatometer. ASTM International; 2006.
Caballero FG, Capdevila C, Garcia de Andrés C. Kinetics and dilatometric behavior of non isothermal ferrite-to-austenite transformation. Materials Science Technology. 2001a; 9:1114-8.
Caballero FG, Capdevila C, Garcia de Andrés C. Modelling of Kinetics of Austenite Formation in steels with different initial microstructures. ISIJ International - Iron and Steel Institute of Japan. 2001b; 10:1093-102.
Caballero FG, Capdevila C, García de Andrés C. Modelling of kinetics and dilatometric behaviour of austenite formation in a low-carbon steel with a ferrite plus pearlite initial microstructure. Journal of Materials Science. 2002; 37:3533-40. http://dx.doi.org/10.1023/A:1016579510723
Cho Y-G, Im Y-R, Lee JK, Suh D-W, Kim S-J, Han HN. A inite element modeling for dilatometric nonisotropy
in steel. The Minerals, Metals & Materials Society and ASM International 2011; 42(7):2094-106. http://dx.doi. org/10.1007/s11661-010-0598-3
Gomez M, Medina SF. Modelling of phase transformation kinetics by corrections of dilatometry results for a ferritic Nb-microalloyed steel. ISIJ International - Iron and Steel Institute of Japan. 2003; 8:1228-37.
Rodrigues CAD, Enokibara F, Leiva TP, Nunes IA, Rollo JMDA. Qualidade do aço inoxidável martensítico do tipo AISI-420 utilizado na confecção de ferramentas cirúrgicas. REM: Revista Escola de Minas. 2009; 62(4):475-80. http:// dx.doi.org/10.1590/S0370-44672009000400010 Suh D-W, Oh C-S, Han HN, Kim S-J. Dilatometric analysis of austenite decomposition considering the effect of non-isotropic volume change. Acta Materialia, 2007; 55:2659-69. http://dx.doi.org/10.1016/j.actamat.2006.12.007