ISSN 0104-6632 Printed in Brazil
www.abeq.org.br/bjche
Vol. 25, No. 02, pp. 291 - 298, April - June, 2008
*To whom correspondence should be addressed
Brazilian Journal
of Chemical
Engineering
EFFECT OF MIXING MODE ON THE BEHAVIOR
OF AN ASBBR WITH IMMOBILIZED BIOMASS IN
THE TREATMENT OF CHEESE WHEY
L. H. S. Damasceno
1, José A. D. Rodrigues
2*, S. M. Ratusznei
2, M. Zaiat
1and E. Foresti
11
Departamento de Hidráulica e Saneamento, Escola de Engenharia de São Carlos, Universidade de São Paulo (USP), Av. Trabalhador São Carlense 400, CEP: 13566-590, São Carlos - SP, Brazil.
2Departamento de Engenharia Química e de Alimentos, Escola de Engenharia Mauá, Instituto Mauá de Tecnologia, Praça Mauá 1, CEP: 09580-900, São Caetano do Sul - SP, Brazil.
E-mail: [email protected]
(Received: August 14, 2006 ; Accepted: January 14, 2007)
Abstract - A hydrodynamic study of a mechanically stirred anaerobic sequencing batch biofilm reactor (ASBBR) containing immobilized biomass on polyurethane foam was performed with the aim to determine homogeneity of the reactor based on total mixing time. Turbine or helix propellers were used for stirring at rotor speeds of 100, 200, 300 and 500 rpm. Experimental values obtained were fitted to a Boltzmann sigmoid. Homogenization times of the reactor were negligible when compared to the 8-h cycle time for all conditions studied. At low propeller rotations the turbine propeller showed the best performance. For higher rotations total mixing times were similar for both propellers; however the helix propeller had better homogeneity conditions. At a subsequent stage the system was operated in batch mode treating cheese whey at concentrations of 500, 1000 and 2000 mgCOD/L and rotations of 200, 300 and 500 rpm. In these assays the importance of the propeller became evident not only for mixing, but also for substrate flow across the bed containing immobilized biomass. Due to axial flow, the helix propeller offered better mass transfer conditions, evidenced by improved organic matter conversion and lower production of total volatile acids. Keywords: ASBBR; Stirring; Mixing time; Cheese whey.
INTRODUCTION
Anaerobic sequencing batch reactors (ASBRs) have been studied for treatment of high-strength wastewaters (dairy, piggery and landfill leachate) as well as low-strength ones (domestic wastewater). Although investigations focus more on bench-scale reactors, results presented are promising, showing the real potential of these systems as an alternative to continuous ones. Operation principles of an ASBR are extremely simple. Treatment takes place in a single tank and a typical cycle consists of four steps: feeding, reaction, decanting and discharge (Dague et al., 1992).
Stirring has an important role during the reaction step. It provides close contact between the substrate and the biomass, thus being one of the advantages of the ASBR, as it does not require complex feed systems. To provide mixing in the reactor, either mechanical stirring (continuous or intermittent) or gas or liquid circulation may be used (Angenent & Dague, 1995; Ndon & Dague, 1997; Zaiat et al., 2001).
Brazilian Journal of Chemical Engineering
than 25 % of the total cycle time (Droste & Massé, 1995; Zhang et al., 1996; Dugba & Zhang, 1999). On the other hand, when immobilized biomass is used the effect of mass transfer should also be taken into account.
Biomass immobilization on polyurethane foam in mechanically stirred ASBRs was proposed by Ratusznei et al. (2000). In the system used the reactor maintained homogeneity by stirring with a magnetic stirrer operated at 500 rpm. Biomass was immobilized in 0.5 cm polyurethane foam cubes inside a basket inside the reactor. Employing the same reactor the authors studied the effect of stirring on reactor performance (Ratusznei et al., 2001) and observed an increase in COD organic matter conversion with increasing rotor speed. In order to assess the effects of solid-phase mass transfer on the performance of an ASBBR containing immobilized biomass, Cubas et al. (2002) evaluated different polyurethane-foam cube sizes in treating complex low-strength wastewater. Solid-phase mass transfer was seen not to be the limiting step in organic matter conversion for particles between 0.5 and 2.0 cm. Only 3.0 cm particles showed solid-phase mass transfer resistance. Pinho et al. (2002) applied different rotations (500, 700, 900 and 1100 rpm) to determine the influence of stirring frequency in the treatment of partially soluble effluents in an ASBR containing immobilized biomass on 3 cm polyurethane foam cubes. The residual substrate
concentration was seen to decrease with increasing stirring frequency, improving treated effluent conditions.
Within this context, the main objective of this research was to assess mixing conditions and their relation to performance in organic matter conversion in an ASBBR containing immobilized biomass applied to the treatment of cheese whey.
MATERIALS AND METHODS
The reactor used was made of acrylic with a diameter and a height of 20 cm and a total volume of 6 L. A 10 cm high basket was used in the reactor to contain 0.5 cm polyurethane foam cubes. This basket occupied half of the reactor volume to allow permanent immersion of the bed during the operation. This configuration was based on that proposed by Ratusznei et al. (2000) where the basket occupied the whole reactor volume. Stirring was provided by either a turbine or two helix propellers. The turbine propeller with a diameter of 6 cm had six vertical flat blades and was positioned below the bed at a clearance of 3 cm from the reactor bottom. The helix propellers with a diameter of 6 cm consisted of three blades; one was positioned 2 cm from the reactor bottom and the other above the bed, 12 cm from the reactor bottom. A scheme of the reactor setup is presented in Figure 1.
1. reaction tank;
2. stainless steel basket containing particles with immobilized cells; 3. mechanical stirrer;
4. feed pump; 5. discharge pump; 6. substrate, 7. treated effluent; 8. timers.
Figure 1: Scheme of the anaerobic sequencing batch reactor containing immobilized biomass
The hydrodynamic assays were performed using the stimulus and response technique to determine the degree of homogeneity in the reactor, thereby characterizing the stirring by total mixing time. To estimate total mixing time a pulse-type stimulus was
used by adding 5 mL of 0.5 N H2SO4 and the
Brazilian Journal of Chemical Engineering Vol. 25, No. 02, pp. 291 - 298, April - June, 2008
between acid solution injection into the system and detection by the electrode of the pH meter.
To determine mixing time (tmix), variation in pH
in the system was assumed to have a Boltzmann sigmoid behavior, as shown in Equation (1), where y represents pH value, A1 initial y value (y(-f)), A2
final y value (y(+f)), x the time elapsed, x0 the x
value corresponding to halfway between A1 and A2
(y(x0) = (A1 + A2)/2) and dx the size of the value
span in x that has the largest variation in y.
x x dx 2
2
1 A
e 1
A A y
0
(1)
Assuming mixing time (tmix) to be the time
necessary for the (A1 – y)/(A1 – A2) ratio to reach
99.9% of the stability value, mixing time can then be calculated using Equation (2).
tmix = x0 + 6.91dx (2)
Lag time is determined by the characteristics of the system, which is comprised of a fixed bed containing inert support and batch operation. Thus the tracer needs some time to cross the bed and to be detected by the probe, in this case the pH electrode. Hence, total mixing time (tTmix) was defined as the
sum of the lag time and the mixing time.
tTmix = t0 + tmix (3)
After determination of the lag time, Microcal
Origin® 6.0 software, which uses the
Lenvenberg-Marquardt method, was used for sigmoid model fitting to the experimental data.
The reactor was designed to operate in fed-batch mode with a minimum volume of 2.5 L at the beginning and a maximum volume of 4.5 L at the end of operation. Thus, the reactor was characterized in relation to hydrodynamic behavior under the following conditions:
Condition i: reactor at minimum capacity (2.5 L)
characterizing start of fed-batch operation and pH electrode inserted into the foam bed.
Condition ii: reactor at maximum capacity (4.5 L) characterizing end of fed-batch operation and pH electrode inserted into the foam bed.
Condition iii: reactor at maximum capacity and
pH electrode above the bed.
Assays for hydrodynamic characterization were performed in duplicate at 100, 200, 300 and 500 rpm for both propeller types (turbine and helix). The bed consisted only of polyurethane foam with no
biomass. The average values of the fit parameters were calculated afterwards.
Performance and stability were assessed in the
ASBBR treatment of cheese whey at 30 r 1ºC with
concentrations of 500, 1000 and 2000 mgCOD/L; an 8-h cycle time and stirring at 200, 300 and 500 rpm. For each concentration studied in the first cycle the reactor was fed with 3 L cheese whey. In the remaining cycles 2 L wastewater were always discharged and fed with 1 L always remaining as residual volume. This residual volume allowed the polyurethane foam to be always immersed in the fed-batch operation, where the volume of 2 L was fed in 10 minutes.
Bicarbonate alkalinity supplementation was in accordance with the methodology proposed by Ratusznei et al. (2003), maintaining the
NaHCO3/COD ratio at 0.5. The inert support was
inoculated with sludge obtained from a UASB reactor treating poultry slaughterhouse effluent.
Organic matter concentrations (COD) for filtered (CS) and unfiltered (CST) samples, pH, bicarbonate
alkalinity (BA) and total volatile solids (TVS) were obtained in accordance with to the Standard Methods for Examination of Water and Wastewater (1995) for influent and effluent samples.
RESULTS AND DISCUSSION
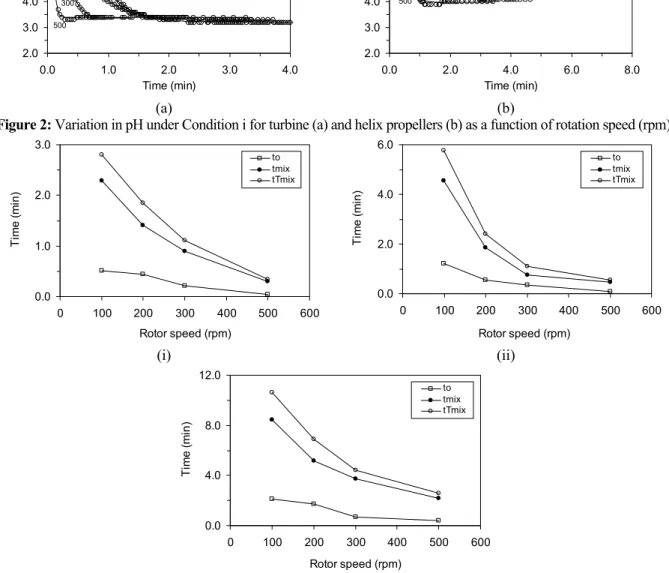
The behavior of the hydrodynamic assays for the turbine and helix propellers is shown in Figure 2. The variations in t0, tmix and tTmix with increasing
rotation are shown in Figures 3 and 4 and in Tables 1 and 2 the average fit parameters of the proposed model, t0, tmix and tTmix, are listed.
In a comparison of the different hydrodynamic assay conditions (i, ii, iii) for the turbine propeller,
the lag times for conditions i and ii were
approximately close, and higher for condition iii. At 200 rpm and higher the values of t0, tmix and tTmix for
conditions i and ii were close again. For the rotations tested condition iii showed higher mixing times than conditions i and ii. In the assays with the helix propellers t0 values were close under all conditions.
At 300 rpm and higher approximately no difference in mixing time for conditions ii and iii was observed. Condition i always had lower mixing times.
A comparison of the propellers showed that for
condition i at 200 rpm and higher lag time values
were close, whereas for mixing time this behavior was similar at 300 rpm and higher. For condition ii
lag time showed behavior identical to that for
Brazilian Journal of Chemical Engineering
propellers was higher at all rotations. For condition
iii, in general, lag time values were the same. At 300 rpm and higher approximately no difference was seen between propellers for the mixing time.
Under all conditions tested the model adopted provided a good fit to the experimental data, showing that it was appropriate to represent and determine mixing time in the system. The turbine propeller showed similar mixing conditions in the bed at the beginning (volume 2.5 L) and at the end of
the batch (volume 4.5 L) (conditions i and iii), with longer mixing times when homogenization of the top part of the reactor was taken into account (condition
ii). For the helix propellers a shorter mixing time was found at the beginning of the batch (condition i) and similar values in both the bed and the top part of the reactor at the end (conditions ii and iii). At low rotations performance of the turbine propeller was better, whereas at higher rotations mixing times were the same.
2.0 3.0 4.0 5.0 6.0 7.0 8.0
0.0 1.0 2.0 3.0 4.0
Time (min)
p
H
Experimental values Model
100
200 300
500
(a)
2.0 3.0 4.0 5.0 6.0 7.0 8.0
0.0 2.0 4.0 6.0 8.0
Time (min)
p
H
Experimental values Model
200
100 200
300
500
(b)
Figure 2: Variation in pH under Condition i for turbine (a) and helix propellers (b) as a function of rotation speed (rpm).
0.0 1.0 2.0 3.0
0 100 200 300 400 500 600
Rotor speed (rpm)
T
im
e
(
m
in
)
to tmix tTmix
(i)
0.0 2.0 4.0 6.0
0 100 200 300 400 500 600
Rotor speed (rpm)
T
im
e
(
m
in
)
to tmix tTmix
(ii)
0.0 4.0 8.0 12.0
0 100 200 300 400 500 600
Rotor speed (rpm)
T
im
e
(
m
in
)
to tmix tTmix
(iii)
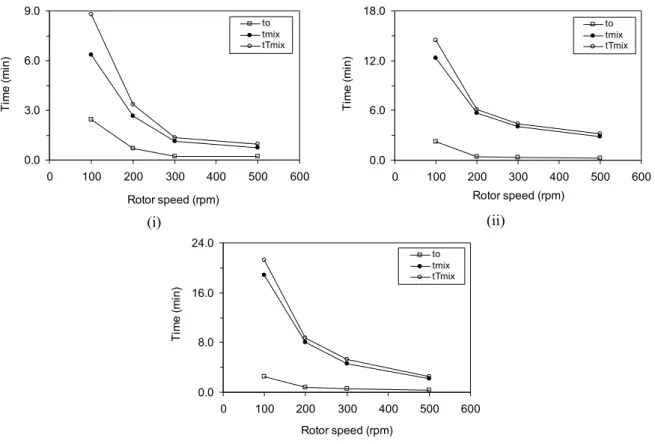
Figure 3: Behavior of lag time (t0), mixing time (tmix) and total mixing time (tTmix) for
Brazilian Journal of Chemical Engineering Vol. 25, No. 02, pp. 291 - 298, April - June, 2008 0.0
3.0 6.0 9.0
0 100 200 300 400 500 600
Rotor speed (rpm)
T
im
e
(
m
in
)
to tmix tTmix
(i)
0.0 6.0 12.0 18.0
0 100 200 300 400 500 600
Rotor speed (rpm)
T
im
e
(
m
in
)
to tmix tTmix
(ii)
0.0 8.0 16.0 24.0
0 100 200 300 400 500 600
Rotor speed (rpm)
T
im
e
(
m
in
)
to tmix tTmix
(iii)
Figure 4: Behavior of lag time (t0), mixing time (tmix) and total mixing time (tTmix) for
Conditions i,ii and iii as a function of rotor speed for the helix propellers.
Table 1: Average values of the adopted model parameters, lag time (t0), mixing time (tmix) and total mixing time (tTmix) for the turbine propeller.
Condition i Condition ii Condition iii Parameters
100 200 300 500 100 200 300 500 100 200 300 500
A1 21.5 42.0 7.3 6.9 7.8 7.7 6.6 6.9 6.5 10.2 10.8 15.4
A2 3.2 3.3 3.3 3.4 3.4 3.6 3.6 3.7 3.5 3.6 3.7 3.6
x0 -0.54 -0.72 0.18 0.08 0.68 0.23 0.23 0.14 1.63 0.25 -0.19 -0.25
dx 0.41 0.31 0.10 0.03 0.56 0.24 0.08 0.05 0.99 0.71 0.57 0.35
r2 0.998 0.990 0.998 0.992 0.997 0.988 0.984 0.991 0.993 0.989 0.994 0.995
t0(min) 0.5 0.4 0.2 0.0 1.2 0.6 0.3 0.1 2.1 1.7 0.7 0.4
tmix(min) 2.3 1.4 0.9 0.3 4.5 1.9 0.8 0.5 8.5 5.2 3.7 2.2
tTmix(min) 2.8 1.8 1.1 0.3 5.8 2.4 1.1 0.6 10.6 6.9 4.4 2.6
Table 2: Average values of the adopted model parameters, lag time (t0), mixing time (tmix) and total mixing time (tTmix) for the helix propeller.
Condition i Condition ii Condition iii Parameters
100 200 300 500 100 200 300 500 100 200 300 500
A1 7.7 8.6 7.3 8.0 16.7 43.1 7.5 8.9 8.8 7.9 7.7 7.9
A2 4.3 4.2 4.0 4.2 5.7 5.4 5.2 5.2 5.4 5.4 5.3 4.9
x0 1.30 0.22 0.25 0.09 -2.49 -5.05 0.83 0.01 0.29 0.98 0.60 0.25
dx 0.73 0.35 0.13 0.09 2.14 1.55 0.46 0.42 2.68 1.02 0.58 0.27
r2 0.998 0.998 0.995 0.996 0.979 0.932 0.998 0.997 0.996 0.996 0.997 0.997
t0(min) 2.4 0.7 0.2 0.2 2.2 0.5 0.4 0.3 2.5 0.8 0.6 0.4
tmix(min) 6.4 2.6 1.1 0.7 12.3 5.7 4.0 2.9 18.8 8.0 4.6 2.1
Brazilian Journal of Chemical Engineering
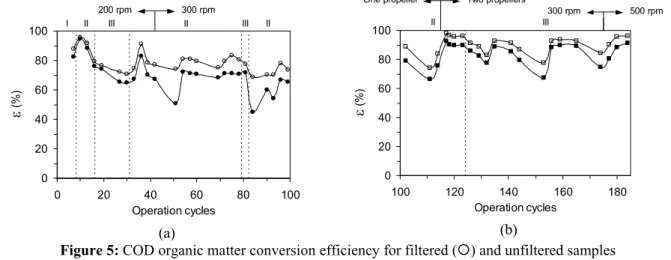
Figures 5, 6 and 7 show the values of COD removal efficiency, of bicarbonate alkalinity and of total volatile acid concentration under operation with turbine and helix propellers for cheese whey concentrations of 0.5 gCOD/L (I), 1.0 gCOD/L (II) and 2.0 gCOD/L (III).
In the study of reactor behavior using a turbine propeller, the first phase consisted of adaptation of the biomass, where the system was operated for eight cycles with a cheese whey concentration of 0.5 gCOD/L and a rotation of 50 rpm. Next, the system was operated for eight cycles with a cheese whey concentration of 1.0 gCOD/L and a rotation of 200 rpm showing stability and conversion efficiency higher than 80%, with a maximum TVA concentration of a 56 mgHAc/L. Subsequently, the system was operated with a cheese whey
concentration of 2.0 gCOD/L for 15 cycles, which occasioned an excessive increase in TVA requiring a reduction in cheese whey concentration to 1.0 gCOD/L for 11 cycles, reducing COD and TVA concentrations.
Maintaining the cheese whey concentration at 1.0 gCOD/L and increasing the rotation to 300 rpm, operating the system for 37 cycles, no significant variation in performance was observed, since organic matter conversion efficiency and acids production remained at stable values. Next, influent concentration was increased to 2 gCOD/L, maintaining the rotation at 300 rpm for three cycles, which caused excessive production of volatile acids, although COD removal efficiency was maintained. Thus, it was necessary to reduce the concentration to 1.0 gCOD/L with the system operating for 18 cycles.
0 20 40 60 80 100
0 20 40 60 80 100
Operation cycles
H
(%
)
III
I II III II II
200 rpm 300 rpm
(a)
0 20 40 60 80 100
100 120 140 160 180
Operation cycles
H
(%
)
One propeller Two propellers
II III
300 rpm 500 rpm
(b)
Figure 5: COD organic matter conversion efficiency for filtered ({) and unfiltered samples (z) for turbine (a) and helix propellers (b).
0 350 700 1050 1400
0 20 40 60 80 100
Operation cycles
B
A
(
m
g
C
a
C
O
3
.
l
-1 )
200 rpm 300 rpm
III
I II III II II
(a)
0 400 800 1200
100 120 140 160 180
Operation cycles
B
A
(
m
g
C
a
C
O
3
.
l
-1 )
One propeller Two propellers
II III
300 rpm 500 rpm
(b)
Brazilian Journal of Chemical Engineering Vol. 25, No. 02, pp. 291 - 298, April - June, 2008
0 100 200 300 400
0 20 40 60 80 100
Operation cycles
T
V
A
(m
g
H
A
c
.
l
-1 )
200 rpm 300 rpm
III
I II III II II
(a)
0 50 100 150 200 250
100 120 140 160 180
Operation cycles
T
VA
(m
g
H
A
c
.
l
-1 )
One propeller Two propellers
II III
300 rpm 500 rpm
(b)
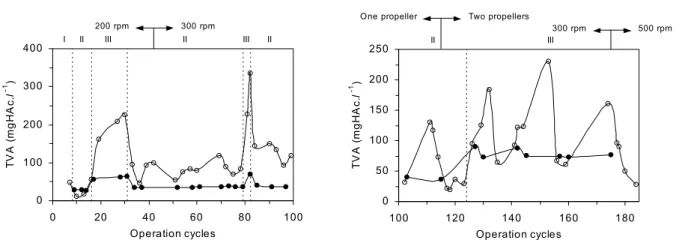
Figure 7: Total volatile acids (TVA) in the influent (z) and in the effluent for turbine (a) and helix propellers (b).
In the study of reactor behavior using the helix propellers, the biomass from the research with the turbine propeller was used in order to avoid the adaptation period of the biomass. Thus, starting at cycle 101, a helix propeller was used below the bed at 300 rpm, maintaining the cheese whey concentration at 1 gCOD/L. The system operated for 15 cycles with average COD removal efficiencies higher than 75% and a TVA concentration below 130 mgHAc/L.
In order to verify the effect of two helix propellers on the system, the reactor was operated for nine cycles under the same conditions as the previous, but another propeller was placed above the polyurethane foam bed. COD removal efficiency higher than 96% was obtained, with TVA values less than 40 mgHAc/L. Next, cheese whey concentration was increased to 2 gCOD/L, maintaining the rotation at 300 rpm, which resulted in an increase in TVA concentration and concomitant formation of polymer-like material in the reactor operated for nine cycles. After cleaning the system to remove this material, conversion efficiency was seen to increase and TVA concentration in the effluent reduced after operation for nine cycles. Next, efficiency decreased again with an increase in TVA concentration due to the presence of polymer-like material, requiring a new cleanup of the system. After cleaning the system was operated for 21 cycles.
To evaluate the hypothesis of improved mass transfer conditions with increasing rotation, influent concentration was maintained at 2 gCOD/L and rotation was increased to 500 rpm. Removal efficiency was significantly improved and total volatile acid concentration reduced after operation for nine cycles, indicating that this rotation is more
appropriate for reactor operation. This improvement might be explained by the fact that, besides a better flow of the substrate across the bed provided by the helix propeller, the polymer formed accumulated less in the system due to faster movement, resulting in the discharge of material together with the effluent.
CONCLUSIONS
In general, the hydrodynamic study in the ASBR, containing immobilized biomass on polyurethane foam, indicated that the time necessary for homogenization of the reactor was negligible in relation to the cycle time, even at low rotor speeds for the two types of propellers tested. In virtue of the axial flow type, with the helix propellers homogenization was better than it was with the turbine propeller, despite requiring longer mixing times at low concentrations. Mixing time was similar for both types of propeller only at high rotations.
Brazilian Journal of Chemical Engineering
ACKNOWLEDGMENTS
This study was supported by the Fundação de Amparo à Pesquisa do Estado de São Paulo (FAPESP, São Paulo, Brazil, process no 02/06154-5). We acknowledge the assistance of Dr. Baltus C. Bonse in the revision of this paper.
NOMENCLATURE
Symbols
BA bicarbonate alkalinity mgCaCO3/L
CI unfiltered substrate
concentration in the influent,
mgCOD/L
CS filtered substrate
concentration in the effluent
mgCOD/L
CST unfiltered substrate
concentration in the effluent
mgCOD/L
TVA, total volatile acid concentration
mgHAc/L
HST substrate removal efficiency
considering non-filtered substrate concentration
%
HSF substrate removal efficiency
considering filtered substrate concentration
%
Abbreviations
ASBR anaerobic sequencing batch reactor
(-)
COD chemical oxygen demand (-)
UASB upflow anaerobic sludge blanket
(-)
REFERENCES
Angenent, L .T. and Dague, R. R., A Laboratory-scale Comparison of the UASB and ASBR Processes. 50th Purdue Industrial. Wastewater Conference Proceedings, Ann Arbor Press, Chelsea, Michigan, USA, p. 365-377 (1995). Cubas, S. A., Pinho, S. C., Foresti, E., Rodrigues,
J.A.D., Ratusznei, S.M. and Zaiat, M., Effects of Solid-Phase Mass Transfer on a Stirred Anaerobic Sequencing Batch Reactor Containing Immobilized Biomass. VII Taller y Simposio Latinoamericano Sobre Digestión Anaerobia, Mérida, Yucatan, México, p. 229-236 (2002). Dague, R. R., Habben, C. E. and Pidaparti, S.R.,
Initial Studies on the Anaerobic Sequencing Batch Reactor. Water Science and Technology,
26, 2429-2432 (1992).
Droste, R. L. and Massé, D. I., Anaerobic Treatment in Sequencing Batch Reactor. International Symposium on Technology Transfer, Salvador, Bahia, Brasil, p.353-363 (1995).
Dugba, P. N. and Zhang, R., Treatment of Dairy Wastewater with Two-Stage Anaerobic Sequencing Batch Reactor Systems -Thermophilic versus Mesophilic Operations. Bioresource Technology, 68, 225-233 (1999).
Ndon, U. J. and Dague, R. R., Ambient Temperature Treatment of Low Strength Wastewater Using Anaerobic Sequencing Batch Reactor. Biotechnology Letters, 19, 319-323 (1997).
Pinho, S. C., Cubas, S. A., Ratusznei, S.M., Rodrigues, J.A.D., Foresti, E. and Zaiat, M., Influence of the Agitation Rate on the Treatment of Partially Soluble Wastewater in Anaerobic Sequencing Batch Reactor Containing Immobilized Biomass. VII Taller y Simposio Latinoamericano Sobre Digestión Anaerobia, Mérida, Yucatan, México, p. 103-106 (2002). Ratusznei, S. M., Rodrigues, J. A. D., Camargo, E.
F. M., Zaiat, M. and Borzani, W., Feasibility of a Stirred Anaerobic Sequencing Batch Reactor Containing Immobilized Biomass for Wastewater Treatment. Bioresource Technology, 75, 127-132 (2000).
Ratusznei, S. M., Rodrigues, J. A. D., Camargo, E.F.M., Zaiat, M. and Borzani, W., Influence of Agitation Rate on the Performance of a Stirred Anaerobic Sequencing Batch Reactor Containing Immobilized Biomass. Water Science and Technology, 44, 305-312 (2001).
Ratusznei, S. M., Rodrigues, J. A. D. and Zaiat, M., Operating Feasibility of Anaerobic Whey Treatment in a Stirred Sequencing Batch Reactor Containing Immobilized Biomass. Water Science and Technology, 48, 179-186 (2003).
Standard Methods for the Examination of Water and Wastewater, 19th ed, American Public Health Association/American Water Works Association/ Water Environment Federation, Washington, D.C., USA (1995).
Zaiat, M., Rodrigues, J. A. D., Ratusznei, S.M., Camargo, E.F.M. and Borzani, W. Anaerobic Sequencing Batch Reactors for Wastewater Treatment: A Developing Technology. Applied Microbiology and Biotechnology, 55, 29-35 (2001). Zhang, R., Yin, Y., Sung, S. and Dague, R. R.,