ISSN 0104-6632 Printed in Brazil
www.abeq.org.br/bjche
Vol. 25, No. 02, pp. 217 - 228, April - June, 2008
*To whom correspondence should be addressed
Brazilian Journal
of Chemical
Engineering
A KINETIC MODEL FOR GROWTH AND
BIOSYNTHESIS OF MEDIUM-CHAIN-LENGTH
POLY-(3-HYDROXYALKANOATES) IN
Pseudomonas putida
M. S. M. Annuar
1*, I. K. P. Tan
1, S. Ibrahim
2and K. B. Ramachandran
3Institute of Biological Sciences, University of Malaya, Phone: 603-7967-6740, Fax: 603-7967-4178, Zip Code: 50603, Kuala Lumpur, Malaysia.
E-mail: [email protected]
2Department of Civil Engineering, University of Malaya, 50603 Kuala Lumpur, Malaysia. 3Department of Biotechnology,Indian Institute of Technology (IIT) Madras,
Chennai-600036, India.
(Received: June 19, 2007 ; Accepted: November 26, 2007)
Abstract - A kinetic model is presented giving a mathematical description of batch culture of Pseudomonas putida PGA1 grown using saponified palm kernel oil as carbon source and ammonium as the limiting nutrient. The growth of the micro-organism is well-described using Tessier-type model which takes into account the inhibitory effect of ammonium at high concentrations. The ammonium consumption rate by the cells is related in proportion to the rate of growth. The intracellular production of medium-chain-length poly-(3-hydroxyalkanoates) (PHAMCL) by P. putida PGA1 cells is reasonably modeled by the modified
Luedeking-Piret kinetics, which incorporate a function of product synthesis inhibition (or reduction) by ammonium above a threshold level.
Keywords: Ammonium; Kinetic; Medium-chain-length PHA; P. putida; Substrate-inhibition.
INTRODUCTION
Poly-(3-hydroxyalkanoates) (PHA) are natural polyesters accumulated intracellularly by various types of microorganisms. When nutrient supplies such as nitrogen, oxygen, phosphorus, sulfur or magnesium are imbalanced, it is advantageous for bacteria to store excess carbon by polymerizing soluble carbon intermediates into water-insoluble molecules like PHA inside their cells (Madison and Huisman, 1999). PHA is classified into two major families, i.e., short-chain-length PHA (PHASCL) and
medium-chain-length PHA (PHAMCL). Typical
examples of PHASCL are poly-(3-hydroxybutyrate)
(PHB) and poly-(3-hydroxybutyrate-co -3-hydroxyvalerate) (PHBV). A well known producer
of PHASCL is Wautersia eutropha (formerly known
as Alcaligenes eutrophus). The class of PHAMCL is
characterized by monomers with a carbon atom length ranging from 6 to 18, and is primarily produced by the fluorescent pseudomonads (Huisman et al., 1989). More than 100 different monomers have been reported to occur in PHAMCL
(Steinbuchel and Valentin, 1995). The PHAMCL are
also targeted for specific uses where chirality and elastomeric properties are important. The constituent monomers that display different functional groups in their side chain are a valuable source of chiral synthons yet to be exploited (Kessler et al., 2001).
Only the PHASCL have been commercially
Brazilian Journal of Chemical Engineering
The PHAMCL are yet to make a significant impact as
a viable choice due to the fact that it is very expensive to produce this polymer in bulk amounts even for material testing purposes. The final PHAMCL
yield and content obtained are lower compared to those of PHASCL, which hampered development of
its applications (Lee et al., 2000). Much of the research effort was directed to improve its yield and productivity using fermentation processes. Several PHAMCL production strategies in the bioreactor such
as batch and continuous (Durner et al., 2001; Jung et al., 2001), fed-batch (Beom, 2002) and high-cell-density processes (Lee et al., 2000) under various cultivation conditions have been described.
For the production of PHAMCL, one of the most
preferred feedstocks is highly reduced and long carbon chain molecules such as animal or vegetable oils or their free fatty acids. These substrates have high energy content, which is excellent for good cell growth and energy metabolism. It is suggested that these oils in the semi-purified form can be a cheaper substrate for PHAMCL fermentation as compared to
the purified, single-type fatty acids. However, most of the studies on PHAMCL fermentation employed the
latter as the carbon source, which gives more defined fermentation components. Relatively high yield and productivity have been reported for the use of pure, single type fatty acids as the fermentation feedstock (Durner et al., 2001). The usage of crude fatty acid mixtures or their oils, however, has not been a popular choice.
One of the pioneering studies on the utilization of crude mixture of fatty acids from plant oils for microbial PHAMCL production was reported by Tan
et al. (1997). Using ammonium-limited culture of
Pseudomonas putida PGA1 in shake-flasks, they
have shown that saponified palm kernel oil (SPKO) and its major free fatty acids, when used as the sole carbon and energy source in the fermentation, gave good biomass growth and PHAMCL yield.
Subsequently, kinetics of ammonium uptake and growth of P. putida PGA1 using SPKO as the sole carbon and energy source with ammonium as the limiting nutrient was studied by Annuar et al. (2006). They reported that the ammonium uptake by P.
putida PGA1 cells can be described using a
first-order kinetic model, indicating that the micro-organism’s specific uptake rate of ammonium and its growth should increase as the ammonium ion concentrations become higher ( 0.1-0.2 gL-1). Further increase in the ammonium ion concentration above 0.2 g L-1 resulted in slightly lower specific growth rates of P. putida PGA1 (Annuar et al., 2006, 2007).
In cultivations using an automated bioreactor, PHAMCL accumulation by P. putida PGA1 is
encouraged under ammonium-limited conditions with SPKO as the sole carbon and energy source (Annuar et al., 2007). The amount of PHAMCL
accumulated and its specific production rate, qPHA,
were influenced by the residual ammonium concentration level in the culture medium. It was observed in both batch and fed-batch fermentations that when the residual ammonium becomes exhausted (<0.05 g L-1), the PHAMCL accumulation
and qPHA were significantly reduced (Annuar et al.,
2007). However, this effect can be reversed by feeding low amount of ammonium to the culture, resulting in significantly improved PHAMCL yield
and productivity. It is concluded that the feeding of residual ammonium concentration in the culture medium during the PHAMCL accumulation has a
positive effect on sustaining the PHAMCL
biosynthetic capability of the organism. Uptake of SPKO by the micro-organism follows zero-order kinetics, indicating a mass transfer limitation of the free fatty acids by the P. putida PGA1 cells (Annuar et al., 2007).
Several kinetic models have been proposed for the growth and PHASCL production by strains of W.
eutropha under chemolithoautotrophic and
heterotrophic growth conditions using laboratory-scale automated bioreactor (Heinzle and Lafferty, 1980; Mulchandani et al., 1989; Belfares et al., 1995). On the other hand, no formal kinetic models have been reported for growth and PHAMCL
production by microorganisms, especially by the main producer of PHAMCL, i.e., Pseudomonas sp.
In this short communication, a kinetic model for growth and PHAMCL production by P. putida PGA1
is presented which complements the earlier studies of Annuar et al. (2007). The present study evaluated several kinetic models for growth of P. putida PGA1 on SPKO with ammonium as a limiting nutrient. Two classes of growth models were tested on published experimental data of Annuar et al. (2006), i.e., models incorporating a substrate inhibition parameter and models that consist of only growth parameters. This was followed by the development of a simple mathematical model via partial adoption of a published model of Heinzle and Lafferty (1980), which reasonably describes the limiting substrate consumption (i.e., ammonium) and PHAMCL
production in P. putida PGA1 in a batch fermentation. The simulation results for growth, ammonium consumption and PHAMCL biosynthesis in P. putida
Brazilian Journal of Chemical Engineering Vol. 25, No. 02, pp. 217 - 228, April - June, 2008
MATERIALS AND METHODS
Microorganism
Pseudomonas putida PGA1 strain was a gift from
Professor G. Eggink of the Agrotechnological Research Institute, Wageningen, The Netherlands.
Medium Composition
In all studies, a defined mineral medium was used with NaNH4HPO4.H2O providing the limiting
ammonium nutrient. SPKO was supplied as the sole carbon and energy source. The exact composition of the mineral medium and trace elements used was detailed in Annuar et al. (2007). Saponification of palm kernel oil (PKO) was carried out according to
Tanet al. (1997). PKO is the extract from the nut of
the oil palm (Elaeis guineensis Jacq.) fruit. The oil consists of a mixture of C6–C18:2 fatty acids with approximately 82% saturated fatty acids and 18% unsaturated fractions. Detailed fatty acid composition of palm kernel oil was reported by Elson (1992).
Shake-Flasks Studies
The different growth models for P. putida PGA1 were evaluated using experimental data obtained from shake-flasks cultivation. The corresponding data and details of the experimental conditions for this cultivation which include the cultivation conditions, growth and ammonium assays, data
analyses and numerical calculations have been described elsewhere (Annuar et al., 2006).
Bioreactor Studies
Experimental data for comparison with simulation results were obtained from published work of Annuar
et al. (2007), which also elaborated on the bioreactor
specifications and experimental conditions (fatty acid compositions of SPKO, cultivation conditions, analytical methods, data analyses and calculations). Data from batch fermentation was used for comparison with the simulation results. The main geometric characteristics of the stirred tank bioreactor and the initial conditions of the experiment are reproduced in Tables 1 and 2, respectively. In the bioreactor studies, the temperature and the pH were maintained at 30 (r0.5) qC and 7.0 (r0.05), respectively, with an agitation rate of 600 rpm and an aeration rate of 0.5 vvm of filtered air. Silicone anti-foaming agent (BDH) was included in the aqueous medium at 1.0 g L-1.
Experimental Data Regression and Estimation of Growth Model Kinetic Parameters
Mathematical models describing growth only and those that incorporated growth inhibitions by the substrate were fitted to the shake-flask cultivation data using non-linear regression function of Polymath 6.0 software. The program uses the Levenberg-Marquardt (LM) algorithm, a technique that uses an iterative solution method to calculate the kinetic parameter values.
Table 1: Dimensions of the stirred tank bioreactor (BiostatB 3-liter fermenter, B. Braun Biotech International) and its components.
Design parameters Specifications
Total volume 3 litres
Diameter of inner tank 130 mm
Height of tank 240 mm
Number of baffles 4
Baffle width 10.5 mm
Type of impellers Rushton disc turbine
Number of impellers 2
Distance between impellers 79.5 mm
Distance of lower impeller from bottom plate 25 mm
Impeller diameter of disc 53 mm
Number of blades 6
Impeller blade width 10.5 mm
Impeller blade length 14.5 mm
Diameter of single ring sparger 48 mm
Number of holes 14
Distance of ring sparger from bottom plate 20 mm
Table 2: Initial conditions for the batch fermentation of P. putida PGA1 in a stirred tank bioreactor.
Fermentation mode
Working volume (L)
Initial SPKO concentration
(g L-1)
Initial ammonium (S) concentration
(g L-1)
Initial total biomass (X) concentration
(g L-1)
Initial residual biomass (R) concentration
(g L-1)
Initial PHAMCL
(P) concentration (g L-1)
Batch 1.2 6.8 0.4 0.115(r0.050) 0.11 (r0.04) 0.009(r0.002)
Simulation of Batch Fermentation
Simulation of the batch fermentation in the bioreactor was performed using the differential equations solver of Polymath 6.0 software. A set of ordinary differential equations (ODE) (eqs. 1, 8 and 9, see Results and Discussion section) was solved using the Runge-Kutta-Fehlberg (RKF45) algorithm.
RESULTS AND DISCUSSION
Simple models are necessary in order to have a solid basis for the design of fermentation processes, for economic calculations, and for the control of fermentation processes. Modeling requires simplifications of the complex biological system, which are at the same time a major goal of modeling. In this study, a semi-empirical model proposed on the
basis of a simple mechanistic description from the work of Heinzle and Lafferty (1980) was partially adopted. They presented a structured model describing batch culture of Wautersia eutropha strain H16 (formerly classified as Alcaligenes eutrophus H16) under chemolithoautotrophic growth conditions. In their work, growth and storage of poly-E-hydroxybutyrate (PHB), i.e., PHASCL are described as a function of the
limiting substrate S (i.e., ammonium), the residual biomass R (i.e., PHA-free biomass), and the product P (PHB). Their bacterial ammonium consumption and PHASCL biosynthesis models were fitted to the
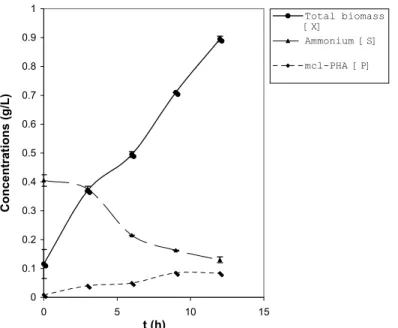
experimental data obtained from the reported work of Annuar et al. (2007); which details the dynamics of the PHAMCL fermentation of P. putida PGA1 grown on 6.8
g L-1 SPKO and 0.4 g L-1 ammonium as carbon and nitrogen sources, respectively. The growth, ammonium consumption, and PHAMCL production profiles are
reproduced in Figure 1.
0 0.1 0.2 0.3 0.4 0.5 0.6 0.7 0.8 0.9 1
0 5 10 15
t (h)
C
o
n
c
e
n
tr
a
ti
o
n
s
(g
/L
)
Total biomass [X]
Ammonium [S] mcl-PHA [P]
Figure 1: Growth and accumulation of PHAMCL in Pseudomonas putida PGA1 in batch
Brazilian Journal of Chemical Engineering Vol. 25, No. 02, pp. 217 - 228, April - June, 2008
Rate of Cell Growth (rR)
The total dry biomass (X) of P. putida PGA1 consists of two parts, namely PHAMCL (P) and
residual biomass (R), where R is calculated as the difference between the total dry biomass and PHAMCL concentration (X=R+P). R is the
catalytically active fraction of biomass, which includes proteins and nucleic acid.
The limiting substrate ammonium (S) is essential to produce R and limits its synthesis at low concentrations. The synthesis of R is described as follows,
dR/dt = rR = P.R (1)
where rR is the rate of synthesis of R and P is the
specific rate of synthesis of R.
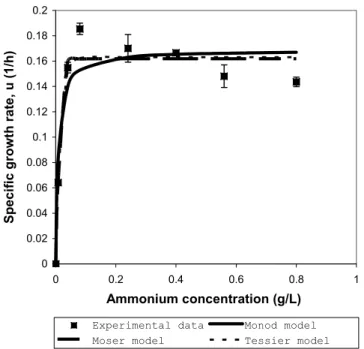
The maintenance requirement for the limiting substrate is assumed to be small enough to be neglected. Several growth models were tested to describe the specific growth rate of P. putida PGA1
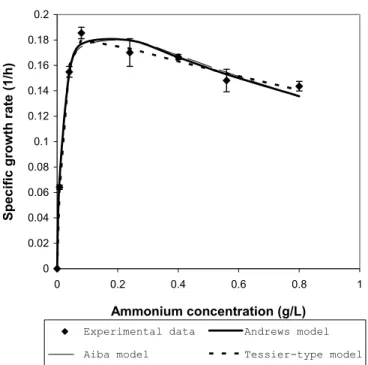
(Table 3). The growth models were divided into those that incorporate limiting substrate-inhibition kinetics and those that contained only growth kinetic parameters. All the models were fitted to the experimental data from shake-flask culture with varying initial ammonium concentrations (Annuar et al., 2006). The estimated values for the model kinetic parameters and fitting constant as returned by the fitting algorithm are shown in Table 3, along with the post-regression statistics. It is clear that growth models that incorporate the substrate inhibition parameter (R2: 0.9867-0.9955) gave better fits to the experimental data compared to the models with only growth parameters (R2: 0.9094-0.9569). Among the three models that take into account the substrate inhibition factor, the Tessier-type model showed the best fit of the experimental data (R2: 0.9955), as compared to the Andrews (R2: 0.9901) and Aiba (R2:0.9867) models. The graphical outputs showing the fits of the experimental data by the models with growth kinetic parameters only and by the growth models incorporating the substrate-inhibition kinetic are shown in Figure 2(a) and 2(b), respectively.
0 0.02 0.04 0.06 0.08 0.1 0.12 0.14 0.16 0.18 0.2
0 0.2 0.4 0.6 0.8 1
Ammonium concentration (g/L)
Sp
e
c
if
ic
g
ro
w
th
r
a
te
,
u
(
1
/h
)
Experimental data Monod model Moser model Tessier model
0 0.02 0.04 0.06 0.08 0.1 0.12 0.14 0.16 0.18 0.2
0 0.2 0.4 0.6 0.8 1
Ammonium concentration (g/L)
Sp
e
c
if
ic
g
ro
w
th
r
a
te
(
1
/h
)
Experimental data Andrews model Aiba model Tessier-type model
Figure 2b): Fitting of the experimental data with growth models (Andrews, Aiba and Tessier-type) incorporating substrate inhibition kinetics.
Table 3: Values of the kinetic parameters for growth models (with and without the substrate-inhibition kinetic parameter) as returned by the numerical calculations.
Values of kinetic parameters and fitting constant (r 95% confidence interval)
Models for growth only Pmax (h
-1
) KS (gL-1) n (-)
Correlation
coefficient (R2) Variance (V)
Monod
max S
= P P .S/(K +S) (2)
0.1687 (r0.0158)
0.0083
(r0.0060) - 0.9093874 0.0004289
Moser
n n
max S
= P P .(S /K +S ) (3)
0.1620 (r0.0156)
1.21x10⁻⁶
(r2.858x10-6)
2.9098
(r0.4895) 0.9574338 0.0002417
Tessier
-S/K max
= P P .(1-e S) (4)
0.1632 (r0.0152)
0.0149
(r0.0094) - 0.9568672 0.0002041
Models for growth with substrate inhibition Pmax (h-1) KS (gL -1
) KI,S (gL -1
) Correlation
coefficient (R2) Variance (V)
Aiba
-S/K
max S I,S
= P P [S/(K +S)]exp( ) (5)
0.2218 (r0.0232)
0.0169 (r0.0069)
1.6890
(r0.6017) 0.9867078 7.549x10
-5
Andrews
max S I,S
= P P /[(1+K /S)(1+S/K )] (6)
0.2336 (r3.538x10-6)
0.0189 (r1.463x10-6)
1.1750
(r7.832x10-5) 0.9901356 5.602x10 -5
Tessier-type
max I,S S
= [exp(-S/K )-exp(S/K )]
P P (7)
0.1894 (r6.109x10-5)
2.6812 (r0.0057)
0.0205
(r3.588x10-5) 0.9955221 2.543x10
-5
*
Equations (2) to (7) were obtained from Moser (1985). Symbols: Pmax: maximum specific growth rate; KS: substrate constant;
KI,S: substrate-inhibition constant;
Brazilian Journal of Chemical Engineering Vol. 25, No. 02, pp. 217 - 228, April - June, 2008
The R2 (correlation coefficient) is frequently used to judge whether the model represents correctly the data, implying that, if the correlation coefficient is close to one, then the regression model is correct. However, many examples exist where the correlation coefficient is close enough to one but the model is still not appropriate. Hence, the residual plot should be used together with R2 for judging the appropriateness of the model, while R2 can be used for comparing various models representing the same dependent variable. The residual plot shows the difference between the calculated and measured values of the dependent variable as a function of the measured values. This is shown in Figure 3 for the fitting of a Tessier-type model to the experimental data. The residuals are randomly distributed around the line of error=0 with zero mean, indicating that the Tessier-type model represents the data correctly (Figure 3). The residual plots for other tested growth models also showed similar random nature of their residuals distribution (data not shown). If the residuals show a clear trend, this indicates that an inappropriate model is being used. This information combined with the high R2 showed that Tessier-type model describes best the growth of P. putida PGA1 with ammonium as the limiting substrate. Another
useful indicator for the comparison of various models representing the same dependent variable is the variance (V). A model with smaller variance represents the data more accurately than a model with larger variance. It is also found that all the models representing substrate inhibition kinetics have consistently much lower V as compared to those representing the growth kinetics as a function of substrate concentration only (Table 3). This indicated that the substrate-inhibition kinetic model should be able to represent growth data more accurately. Different levels of high ammonium concentration in the aqueous medium were found to exert a substrate-inhibition effect towards growth of W. eutropha strains (Suzuki et al., 1986; Mulchandani et al., 1989; Belfares et al., 1995; Beaulieu et al., 1995) and P. putida PGA1 (Annuar et al., 2006, 2007).
On the other hand, for the regression model to be stable and statistically valid, the confidence intervals must be much smaller (or at least smaller) than the respective parameter values (in absolute values). The confidence intervals at 95% for all tested growth models are less than the estimated parameter values returned by the fitting algorithm (Table 3). The Tessier-type model has significantly much smaller confidence intervals for all its kinetic parameters.
Figure 3: Residual plots for the fitting of the Tessier-type model to the growth data from shake-flask cultivation. (Residual points were obtained by subtracting calculated values, (Ucalc) from experimental data (Uexp)).
Rate of Ammonium Consumption (rS)
An examination of the experimental data (Figure 1) indicated that ammonium concentration was almost completely consumed in the growth phase due to the bacterial metabolism and this corresponded to an increase in the residual biomass growth rate. Furthermore, specific ammonium
which is adequate to describe the relationship between the rate of synthesis of R (rR) and the rate of
consumption of the limiting substrate S (rS). The
value of biomass yield coefficient on ammonium (YR/S) is taken from the work of Heinzle and Lafferty
(1980) at 1.48r0.14 (Table 4). In their work, W.
eutropha H16 was grown on fully synthetic medium
containing ammonium (in the form of (NH4)2SO4) as
nitrogen source and gaseous CO2 as the sole carbon
and energy source.
Rate of PHAMCL Production (rP)
The rate of synthesis of PHAMCL (rP) is assumed
to be the sum of a growth associated term (rP,1) and a
biomass associated term (rP,2), following the
suggestion of Heinzle and Lafferty (1980). They formulated a rate expression for P as:
dP/dt = rP = rP,1 + rP,2 (9)
As shown in Figure 1, the rP is correlated with rR
during the growth phase. The first term in the expression of the rate of synthesis of P, i.e., rP,1, is a
function of PHAMCL yield coefficient on residual
biomass (YP/R) and rR (Eq. 10).
rP,1 = YP/R . rR (10)
The value of YP/R is determined to be within a
range of 0.105-0.16 (Heinzle and Lafferty, 1980). For the purpose of the modeling exercise in this work, average YP/R value were used, i.e., 0.13.
The non-growth associated term of the synthesis of P (rP,2) is assumed to be a function of the limiting
substrate S, of the residual biomass R, and of the
product P (Heinzle and Lafferty, 1980). At high contents of PHAMCL in the cells, the rate of synthesis
of P is decreased, which can be formally described as an inhibition. Following this, the second term in the expression of the rate of synthesis of P , rP,2 , is given
by equation (11).
rP,2 = -k1.P + k2.R (11)
The values of k1 and k2 fall within the range of
0.045-0.048 h-1 and 0.18-0.176 h-1, respectively, as determined by Heinzle and Lafferty (1980). For the purpose of simulation in the present work, the average values of both (k1=0.047 and k2=0.18) were
used in the rate expression (Eq. 11).
The crucial aspect of the model is the initialization of the non-growth associated production of P, and the inhibition of it by the limiting substrate ammonium. Heinzle and Lafferty (1980) proposed that this inhibition can be incorporated into the model by multiplying Eq. (11) by a function that is used to describe allosteric substrate inhibition, which yields the following equation:
rP,2 = [KI,P / (KI,P+S) ] (-k1.P + k2.R) (12) KI,P is the inhibition constant representing the
substrate concentration at half maximum rate of production of P. KI,P was determined to be between
0.036 and 0.047 g L-1 (NH4)2SO4 (Table 4). Again
here, the average value of 0.042 g L-1 for KI,P was
employed in the simulation exercise.
Table 4 summarizes all the kinetic parameters required to solve the final set of equations [Eqs (1), (8), (9), (10), (11), and (12)].
Table 4: Evaluated parameters for the model equations.
Parameter Value Dimension Equation no.
Pmax 0.19(r6.11x10-5)a h
-1
(7)
KS 2.68(r0.01)a g L-1 (7)
KI,S 0.02(r3.59x10-5)a g L-1 (7)
YR/S 1.48(r0.14 )b - (8)
YP/R 0.105-0.16
b
- (10)
k1 0.045-0.048
b
h-1 (11)
k2 0.18-0.176b h-1 (11)
KI,P 0.036-0.047
b
g L-1 (12)
a
Values of the kinetic parameters obtained in this study.
b
Brazilian Journal of Chemical Engineering Vol. 25, No. 02, pp. 217 - 228, April - June, 2008
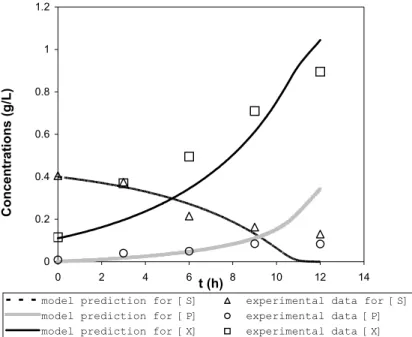
Simulation
Figure 4 shows the results of a numerical integration of the model with one set of parameters as given in Table 4. The time course of calculated concentrations is compared with experimental values. The comparisons demonstrate a good agreement between the data from simulations of the model with the experimental data. Thus, alongside the Tessier-type model incorporating substrate-inhibition kinetics to describe the batch growth of P.
putida PGA1, the models for ammonium utilization
and accumulation of PHASCL (PHB), initially
proposed by Heinzle and Lafferty (1980) for W.
eutropha under chemolithoautotrophic growth
conditions, are equally applicable to simulate the ammonium consumption and PHAMCL accumulation
in P. putida under heterotrophic conditions.
Ammonium utilization kinetics by P. putida PGA1 in a chemically defined medium can be modeled quite simply using a rate equation related directly by a yield coefficient to the growth kinetic model. The PHAMCL formation rate can be described reasonably
well by using a model that takes into account the growth-associated and non-growth associated product formation simultaneously. Using this general form of Luedeking-Piret kinetics, Heinzle and Lafferty (1980) modified the non-growth product formation rate equation to include a function of PHAMCL biosynthesis inhibition by a certain level of
ammonium in the medium; when the ammonium concentration exceeds the 0.036-0.047 g L-1 range, the rate of PHAMCL biosynthesis in the cells is
reduced. This is not an unfounded modification, as it is well known that PHA accumulation is increased significantly under threshold ammonium concentration in the medium. This ammonium level differs between different types of micro-organisms. The accumulation and storing of the intracellular polymer is the bacterial culture’s response to the deficiency conditions (e.g. ammonium limitation) that do not permit continuation of its exponential growth. In this case, the intracellular stored carbon in the form of polymer helps the bacterial population to survive the starvation period until favorable growth conditions are restored in its environment.
0 0.2 0.4 0.6 0.8 1 1.2
0 2 4 6 8 10 12 14
t (h)
C
o
n
c
e
n
tr
a
ti
o
n
s
(
g
/L
)
model prediction for [S] experimental data for [S] model prediction for [P] experimental data [P] model prediction for [X] experimental data [X]
Figure 4: Comparison of model predictions (lines) with the experimental data (symbols). (X: total biomass concentration; S: ammonium concentration; P: PHAMCL concentration)
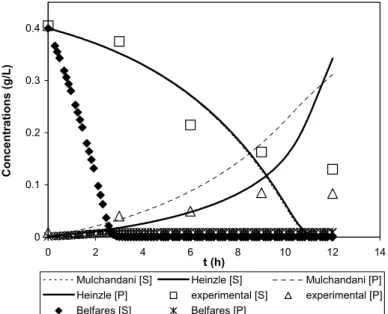
Ammonium consumption and PHASCL (PHB)
production models proposed by Mulchandani et al. (1989) were also compared to the current experimental data. Using W. eutropha ATCC 17697 culture grown in fructose as carbon substrate, their ammonium consumption rate equation took a form similar to the model of Heinzle and Lafferty (1980)
with the biomass yield coefficient with respect to ammonium (YR/S) estimated at 1.46 g g-1, which is
biosynthesis of PHAMCL by P. putida PGA1 cells.
Although their rate equation also adopts the Luedeking-Piret kinetics, it does not take into account the possibility of PHAMCL biosynthesis
inhibition above a certain level of residual ammonium in the aqueous medium (Figure 5). Their product synthesis equation is solely a function of the culture’s growth rate and biomass concentration, each related to the product balance by a constant (Mulchandani et al., 1989).
Alternative ammonium consumption and PHASCL
(PHB) production models for W. eutropha DSM545 grown in mineral salts medium containing glucose as carbon source and (NH4)2SO4 as nitrogen source
were reported by Belfares et al. (1995). Their
ammonium utilization rate equation also took a similar form to the two models tested earlier. However, due to significantly higher difference in the biomass yield coefficient with respect to ammonium (equivalent to YR/S), which was estimated
at 6.25 g g-1 , in comparison to other YR/S values used
in this study, the rate of ammonium consumption was grossly over-estimated compared to the experimental data (Figure 5). On the other hand, the PHB production rate proposed by these authors was solely a function of cell growth with a biomass product yield coefficient (equivalent to YP/R)
estimated at 0.13. As a result, it predicted a very much lower PHAMCL production rate in P. putida
PGA1 batch culture (Figure 5).
0 0.1 0.2 0.3 0.4
0 2 4 6 8 10 12 14
t (h)
C
o
n
c
e
n
tr
a
ti
o
n
s
(g
/L
)
Mulchandani [S] Heinzle [S] Mulchandani [P]
Heinzle [P] experimental [S] experimental [P] Belfares [S] Belfares [P]
Figure 5: Comparison of simulation results for ammonium consumption and PHA production models as proposed by Mulchandani et al. (1989) and Belfares et al. (1995) to the experimental data.
CONCLUSIONS
The batch growth of P. putida PGA1 culture in a defined aqueous medium with a fatty acid mixture as carbon source can be described by using a Tessier-type model which incorporates the limiting substrate (ammonium) inhibition kinetics. Utilization of the ammonium is related vis-à-vis to growth kinetics. The PHAMCL accumulation by P. putida PGA1 cells
can be reasonably modeled using Luedeking-Piret kinetics that take into account the product synthesis inhibition (or reduction) by ammonium concentrations above a threshold level.
NOMENCLATURE
Abbreviations
PHA poly-(3-hydroxyalkanoates) (-) PHAMCL medium-chain-length
poly-(3-hydroxyalkanoates)
(-) PHASCL short-chain-length
poly-(3-hydroxyalkanoates)
(-) PHB poly-(3-hydroxybutyrate) (-) PHBV poly-(3-hydroxybutyrate-co
-3-hydroxyvalerate)
Brazilian Journal of Chemical Engineering Vol. 25, No. 02, pp. 217 - 228, April - June, 2008
SPKO saponified palm kernel oil (-) LM Levenberg-Marquandt (-) ODE ordinary differential
equations
(-) RKF Runga-Kutta-Fehlberg
Symbols
P product concentration g L-1 R residual biomass
concentration
g L-1 S limiting substrate
concentration
g L-1 X total biomass concentration g L-1
k1 constant 1 h-1 k2 constant 2 h-1 KI,S substrate-inhibition constant g L-1 KI,P product-inhibition constant g L-1 KS substrate constant g L-1 n fitting constant (-)
rR rate of R synthesis g L-1 h-1 rS rate of S consumption g L-1 h-1 rP rate of P formation g L-1 h-1 rP,1 first term of rP equation g L-1 h-1 rP,2 second term of rP equation g L-1 h-1 R2 coefficient of correlation (-)
YR/S growth yield coefficient (-) YP/R product yield coefficient (-)
Greek Symbols
P specific growth rate h-1
Pmax maximum specific growth rate
h-1
V variance (-)
ACKNOWLEDGEMENTS
This study was funded by University of Malaya research, grant no. Vot F0156/2001A.
REFERENCES
Annuar, M. S. M., Tan, I. K. P., Ibrahim, S., and Ramachandran, K.B. (2007). Production of medium-chain-length poly(3-hydroxyalkanoates) from crude fatty acids mixture by Pseudomonas
putida. Trans IChemE, Part C, Food and
Bioproducts Processing, 85(C2), 104.
Annuar, M. S. M., Tan, I. K. P., Ibrahim, S., and Ramachandran, K.B. (2006). Ammonium uptake and growth kinetics of Pseudomonas putida
PGA1. Asia Pacific Journal of Molecular Biology and Biotechnology, 14, 1.
Beaulieu, M., Beaulieu, Y., Melinard, J., Pandian, S., and Goulet, J. (1995). Influence of ammonium salts and cane molasses on growth of Alcaligenes
eutrophus and production of polyhydroxybutyrate.
Applied and Environmental Microbiology, 61, 165. Belfares, L., Perrier, M., Ramsay, B. A., Ramsay,
J.A., Jolicoeur, M., and Chavarie, C. (1995). Multi-inhibition kinetic model for the growth of
Alcaligenes eutrophus, Canadian Journal of
Microbiology, 41, 249.
Beom, S. K. (2002). Production of medium chain length polyhydroxyalkanoates by fed-batch culture of Pseudomonas oleovorans. Biotechnology Letters, 24, 125.
Durner, R., Zinn, M., Witholt, B., and Egli, T. (2001). Accumulation of poly[(R)-3-hydroxyalkanoates] in Pseudomonas oleovorans
during growth in batch and chemostat culture with different carbon sources. Biotechnology and Bioengineering, 72, 278.
Elson, C. E. (1992). Tropical oils: nutritional and scientific issues. Critical Reviews in Food Science and Nutrition, 31(1/2), 79.
Heinzle, E., and Lafferty, R. M. (1980). A kinetic model for growth and synthesis of poly-E -hydroxybutyric acid (PHB) in Alcaligenes
eutrophus H16. European Journal of Applied
Microbiology and Biotechnology, 11, 8.
Huisman, G. W., de Leeuw, O., Eggink, G., and Witholt, B. (1989). Synthesis of poly-3-hydroxyalkanoates is a common feature of fluorescent pseudomonads. Applied and Environmental Microbiology, 55, 1949.
Jung, K., Hazenberg, W., Prieto, M., and Witholt, B. (2001). Two-stage continuous process development for the production of medium-chain-length poly(3-hydroxyalkanoates). Biotechnology and Bioengineering, 72, 19.
Kellerhals, M. B., Kessler, B., Witholt, B., Tchouboukov, A., and Brandl, H. (2000). Renewable long-chain fatty acids for the production of biodegradable medium-chain-length polyhydroxyalkanoates (mcl-PHAs) at laboratory and pilot plant scales. Macromolecules, 3, 4690.
Kessler, B., Weusthuis, R., Witholt, B., and Eggink, G. (2001). Production of microbial polyesters: fermentation and downstream processes. Advances in Biochemical Engineering/Biotechnology, 71, 159. Lee, S. Y., Wong, H. H., Choi, J.I., Lee, S. H., Lee,
high-cell-density cultivation of Pseudomonas
putida under phosphorus limitation. Biotechnology
and Bioengineering, 68, 466.
Madison, L. and Huisman, G. W. (1999). Metabolic engineering of poly(3-hydroxyalkanoates): From DNA to plastic. Microbiology and Molecular Biology Reviews, 63, 21.
Moser, A. (1985). Kinetics of batch fermentations. In: Rehm, H.J. and Reed, G. (Eds.) Biotechnology (Vol.2), VCH Verlagsgesellschaft mbH, Federal Republic of Germany, 253.
Mulchandani, A., Luong, J. H. T., and Groom, C. (1989). Substrate inhibition kinetics for microbial growth and synthesis of poly-E-hydroxybutyric acid by Alcaligenes eutrophus ATCC 17697.
Applied Microbiology and Biotechnology, 30, 11. Steinbuchel, A. and Valentin, H.E. (1995). Diversity
of bacterial polyhydroxyalkanoic acids. FEMS Microbiology Letters, 128, 219.
Suzuki, T., Yamane, T., and Shimizu, S. (1986). Mass production of poly-E- hydroxybutyric acid by fully automatic fed-batch culture of methylotroph. Applied Microbiology and Biotechnology, 23, 322.
Tan, I. K. P., Sudesh, K., Theanmalar, M., Gan, S. N., and Gordon III, B. (1997). Saponified palm kernel oil and its major free fatty acids as carbon substrates for the production of polyhydroxyalkanoates in
Pseudomonas putida PGA1. Applied Microbiology


![Table 4 summarizes all the kinetic parameters required to solve the final set of equations [Eqs (1), (8), (9), (10), (11), and (12)]](https://thumb-eu.123doks.com/thumbv2/123dok_br/18894596.425996/8.892.103.794.836.991/table-summarizes-kinetic-parameters-required-solve-final-equations.webp)