ISSN 0104-6632 Printed in Brazil
www.abeq.org.br/bjche
Vol. 25, No. 02, pp. 375 - 387, April - June, 2008
*To whom correspondence should be addressed
Brazilian Journal
of Chemical
Engineering
KINETICS OF BARIUM SULPHATE REACTION
CRYSTALLIZATION IN CRYSTALLIZERS WITH
INTERNAL CIRCULATION
J. Koralewska
1, K. Piotrowski
2*, B. Wierzbowska
1and A. Matynia
11Wrocáaw University of Technology, Faculty of Chemistry, Phone +(48) (71) 320-3497,
Fax +(48) (71) 328-0425, WybrzeĪe WyspiaĔskiego 27, 50-370, Wrocáaw, Poland. E-mail: [email protected], E-mail: [email protected],
E-mail: [email protected]
2
Silesian University of Technology, Department of Chemical & Process Engineering, Phone/Fax +(48) (32) 237-1461, ks. M. Strzody 7, 44-101, Gliwice, Poland.
E-mail: [email protected]
(Received: February 22, 2007 ; Accepted: July 29, 2007)
Abstract - Kinetic calculation results describing the observed nucleation and growth rates of barium sulphate crystals precipitated in an integrated reaction-crystallization process in a barium sulphate-ammonium chloride-water system are presented and analyzed. The scope of experiments included two continuous model DTM-type crystallizers (Draft Tube Magma) with internal circulation of the suspension forced by a liquid jet-pump device responsible for stable and intensive enough ascending/descending flow of BaSO4 crystal magma in a mixing chamber. For comparison purposes the experimental data corresponding to a continuous DT (Draft Tube) crystallizer with propeller agitator are presented and discussed. The various types of laboratory crystallizers used were fed with concentrated water solution of barium chloride (of 10 or 24 mass %) and - in a stoichiometric proportion - crystalline ammonium sulphate, assuming isothermal (348 K) and hydrodynamic (average residence time of suspension in a crystallizer: 900 s) process conditions. The observed nucleation and growth rates of barium sulphate crystals were estimated on the basis of crystal size distributions (CSDs) using convenient calculation scheme derived for an MSMPR (Mixed Suspension Mixed Product Removal) model approach. Considering the experimental population density distribution courses, a size-dependent growth (SDG) phenomenon was taken into account in the kinetic calculations. Five SDG kinetic models recommended in the accessible literature were used for kinetic parameter values estimation. It was proved statistically, that Rojkowski’s two SDG models (hyperbolic and exponential) best suit for our own experimental data description. The experimental data presented can be practically applied for improving the constructions of liquid jet-pump DTM crystallizers recommended for reaction crystallization of sparingly soluble inorganic salts (especially for high concentrations of reaction substrates) in the modern industrial-scale technologies.
Keywords: Barium sulphate; Precipitation; Barium chloride; Ammonium sulphate; Reaction crystallization kinetics; Size-dependent growth (SDG); DTM MSMPR crystallizer; DT MSMPR crystallizer; Liquid jet pump.
INTRODUCTION
Taking successful advantage of mass crystallization processes on various scales is possible owing to integration of precisely selected crystallizer construction, rational arrangement of its interior and
Brazilian Journal of Chemical Engineering
circulation of suspension inside the apparatus. This liquid/suspension flow produces uniformity of temperature and concentration within the working volume and creates a suspended state of growing crystals and prevents their inconvenient agglomeration (Mullin, 1993; Myerson, 1993; Mersmann, 1995). Circulation of suspension inside the hydraulic system of the apparatus reduces the formation of incrustation considerably as well as prevents fast clogging of all important crystallizer elements. The constructions with some simple geometrical element responsible for improvement of circulation and no classification effects within the solid phase are usually classified as DTM MSMPR (Draft Tube Magma, Mixed Suspension Mixed Product Removal) type crystallizers. The device responsible for adjustable forced circulation of suspension inside the vessel is usually an agitator (of one of a variety of constructions) or a circulation pump. On the basis of long-term observations it can be concluded that in large-scale industrial installations the pumps consume considerable amounts of electrical energy. Moreover, their rotors can negatively affect the quality of the solid phase (destruction of surface, breakage, intensification of attrition, etc.). On the other hand, application of an agitator requires a precise balance of the shaft coupled with the selection of an appropriate bearing system. Additionally, in the case of utilizing the crystallizer bottom as the shaft’s input location, reliable packing becomes extremely important. A considerably simpler device, both from a construction and a utilization point of view, to produce effective circulation of suspension inside the vessel, although still rarely used in industrial and laboratory practice, is a jet-pump device (Rojkowski and Synowiec, 1991; Matynia, 1997).
The lack of internal movable elements, thus considerably reducing mechanical destruction of the crystal phase; a simple construction; and the possibility of producing properly shaped crystals coupled with relatively low energy consumption are the main advantages of crystallizers with a liquid jet-pump device. Manual or fully automatic adjustment of its working conditions (e.g. optimal ejection degree) is possible with relatively easily available valves. If necessary, it is possible to replace a whole jet-pump device or an integral part (e.g. feeding nozzle) by another with more convenient geometrical proportions.
The original constructions of jet-pump crystallizers have until now been successfully applied in various processes of mass crystallization from solutions, including complex reaction
crystallization technologies (Matynia, 1997). The practical applicability of these constructions in reaction crystallization of sparingly soluble salts, calcium (hydroxyapatite – HAP) and magnesium/ ammonium (struvite – MAP) phosphates (Matynia et al. 2005a) as well as barium sulphate (Koralewska et al., 2006a, Koralewska et al., 2006b) and others, has actually been tested.
In the work presented the kinetic data corresponding to continuous reaction crystallization of BaSO4 in two laboratory crystallizers equipped
with a jet-pump device with different directions of suspension circulation (later denoted as DTMn and DTMp crystallizers; see Fig. 1a and Fig. 1b) and – for comparison purposes – to that in a “reference,” conventional crystallizer equipped with a propeller agitator (later denoted as DT – Draft Tube – crystallizer; see Fig. 1c) are presented and discussed in detail. The test stand equipment operation was precisely controlled by means of a PC computer. Nucleation and growth rates of BaSO4 crystals were
estimated on the basis of crystal size distributions (CSDs), owing to their characteristic curves observed by taking into account the size-dependent growth (SDG) kinetic models.
Separation of barium sulphate from water solution is a typical mass crystallization process preceded by a strictly integrated chemical (here, very fast ionic) reaction of sparingly soluble salt precipitation (BaSO4 solubility product
( 2
4 2 SO
Ba sp a a
K ) is 1.1u10–10 (mol dm–3)2). Running this complex process in a controlled way enables one to provide the optimal conditions for the course of the chemical reaction, nucleation and crystal growth (Nielsen, 1964; Nývlt et al., 1985; Söhnel and Garside, 1993; Mersmann, 1995), thus making it possible to obtain the quality required for the product’s further usage or postprocessing.
Both in scientific work and precisely controlled reaction crystallization experiments, barium sulphate is very often used as a model chemical compound for precipitation, appropriate for analysis. Thus, one has at his or her disposal a great number of data from the literature in this area and relatively extensive research documentation and kinetic data concerning its precipitation under various technological conditions (e.g. Matynia et al., 2001). In a presented research study the barium ions (after BaCl2
Brazilian Journal of Chemical Engineering Vol. 25, No. 02, pp. 375 - 387, April - June, 2008
can be regarded as extreme. However, application of a highly concentrated water solution of BaCl2 as well
as crystalline (NH4)2SO4 as a second reagent resulted
from the necessity of design-oriented utilization of the results (e.g. process data, resulting kinetic relationships, suggestions on use of liquid jet-pump DTM crystallizers) in original, proecological and modern technology for utilization of toxic solid wastes after processes of metal heat treatment (so-called postquenching salts) by chemical neutralization (Matynia, 2002; Matynia et al., 2004).
EXPERIMENTAL
Setup and Procedure
The simplified schemes of crystallizer construction used in the experiments on continuous reaction crystallization of barium sulphate presented in Fig. 1 are:
Fig. 1a – a DTMn type crystallizer with a liquid jet-pump. The feeding nozzle of a jet-pump was situated in the apparatus bottom profile, thus providing an ascending flow of suspension in a mixing chamber (working volume Vw = 1.2 dm3).
Fig. 1b – a DTMp type crystallizer with a liquid jet-pump. The feeding nozzle of a jet-pump was
situated below a upper liquid level, thus providing a descending flow of suspension in a mixing chamber (Vw = 1.2 dm3).
Fig. 1c – a classical DT-type “reference” crystallizer with a three-paddle propeller agitator, providing a descending flow of suspension in a circulation profile (Vw = 0.6 dm3).
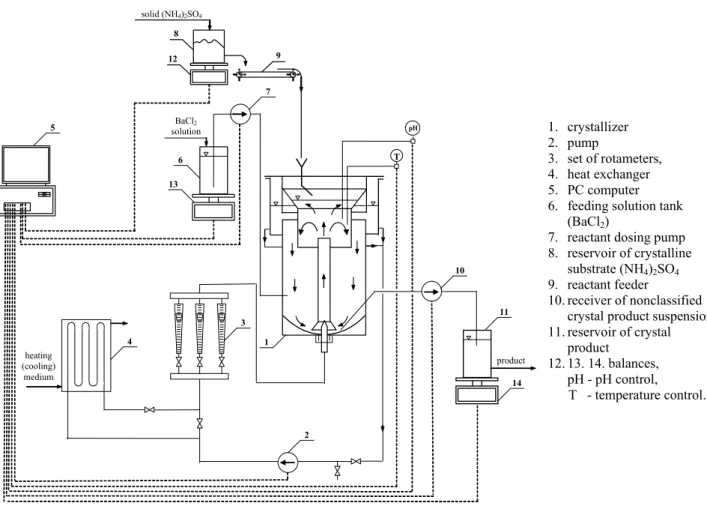
A scheme of the laboratory test stand with the exemplary DTMn laboratory-scale crystallizer selected is presented in Fig. 2. Operation, control and recording of the measurement data were performed by the integrated automatic system controlled by a PC computer. The details of constructional elements within the individual crystallizers and main dimensions of their individual elements as well as the work regime and characteristics of operating conditions (including hydrodynamic ones) are presented in Koralewska et al. (2006a), Koralewska et al. (2006b) and Matynia et al. (2005a).
All experimental tests were run assuming a minimal value of unit power of a jet-pump feeding stream, thus resulting in a possibly minimal intensity of suspension circulation in the model crystallizers: DTMn crystallizer – 0.63 and 1.2 W kg–1, DTMp crystallizer – 0.43 and 0.91 W kg–1 for [BaCl2]RM =
10 and 24 mass %, respectively. In the case of the DT crystallizer the minimum number of revolutions of the agitator was 7 s–1.
1 2
3
1 2
3
1
2
3
(a) (b) (c)
Figure 1: Schemes of the crystallizers under study: (a) - DTMn type crystallizer with a liquid jet-pump of ascending suspension flow in a mixing chamber: (b) - DTMp type crystallizer with a liquid jet-pump of
Brazilian Journal of Chemical Engineering
T
pH
5
7
10
product 11
4
3
2 1 heating
(cooling) medium
BaCl2
solution 6
13
14 solid (NH4)2SO4
12 9
8
1. crystallizer 2. pump
3. set of rotameters, 4. heat exchanger 5. PC computer 6. feeding solution tank
(BaCl2)
7. reactant dosing pump 8. reservoir of crystalline
substrate (NH4)2SO4 9. reactant feeder
10. receiver of nonclassified crystal product suspension 11. reservoir of crystal
product 12. 13. 14. balances,
pH - pH control, T - temperature control.
Figure 2: Scheme of the experimental stand with a DTMn crystallizer with a liquid jet-pump.
The crystallizers were provided with a water solution of barium chloride (after dissolution of BaCl22H2O, p.a., POCh Gliwice, Poland, in distilled
water) and, in stoichiometric proportions, with crystalline ammonium sulphate ((NH4)2SO4 p.a.,
POCh Gliwice, Poland). Barium chloride solution was pumped into the so-called “crystal growth zone in the DTM and DT crystallizers” (a volume between the body of the crystallizer and a jet-pump device or a draft tube), while crystalline ammonium sulphate was dosed directly onto the free surface of the suspension. Feeding points of the reagents are visible in Fig. 1: (1) – BaCl2 water solution, (2) – crystalline
(NH4)2SO4. Crystal suspension (not classified BaSO4
product) was collected from the crystallizer bottom (3).
The measurements were performed at a fixed process temperature, T = 348 K, for the suspension residence time in the crystallizer vessel, W = 900 s. Two concentrations of barium chloride in a feeding solution were tested: 10 and 24 mass % (barium
chloride solubility in water at T = 293 K is 26.3 mass %, Mullin (1993)). The process parameter values applied to the model liquid jet-pump DTM constructions were selected purposefully in order to directly compare the results with the ones related to a DT-type “reference” crystallizer (Matynia et al., 2004; Matynia et al., 2005b) as well as for their potential practical application in the modern technology of proecological utilization of toxic quenching salts elaborated by the authors (Matynia, 2002). A continuous process of precipitation followed by integrated crystallization of barium sulphate was operated within the time of 5W (measured from the moment of stabilization of the assumed conditions of pseudo-steady state). After this time the whole crystallizer content was withdrawn, cooled to room temperature, filtered and dried to be used in the CSD tests (laser particle analyzer COULTER LS – 230).
Brazilian Journal of Chemical Engineering Vol. 25, No. 02, pp. 375 - 387, April - June, 2008
w i 3 i v
i w
i 3
i c v
i i
V
ǻL L k
V V
ǻL L
ȡ
k m
n (1)
where mi is the mass of the ith crystal fraction, kg; Vi
is the volume of the ith crystal fraction, m3; kv is
the crystal volumetric shape factor; Uc is the crystal
density, kg m–3; Li is the average size of the ith
crystal fraction, m; 'Li is the size range of the ith
crystal fraction, m; and Vw is the crystallizer working
volume, m3.
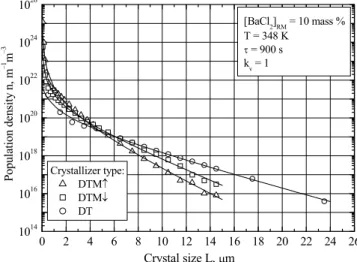
Computed by this method the individual population density distributions of BaSO4 crystals
for the two BaCl2 concentrations tested in the three
model crystallizers are as shown in Fig. 3 and Fig. 4.
0 2 4 6 8 10 12 14 16 18 20 22 24 26
1014 1016 1018 1020 1022 1024 1026
[BaCl
2]RM = 10 mass %
T = 348 K W = 900 s k
v = 1
Crystallizer type: DTMn DTMp DT
P
o
p
u
la
ti
o
n
de
ns
it
y n,
m
–1 m
–3
Crystal size L, Pm
Figure 3: Comparison of population density distributions of barium sulphate crystals: points - experimental data, solid lines - values calculated with the use of Eq. (10)
and data from Table 2 for the Rojkowski SDG hyperbolic model (RH).
0 1 2 3 4 5 6 7 8 9 10 11 12 13 14 1014
1016 1018 1020 1022 1024 1026
Crystallizer type: DTMn DTMp DT
[BaCl2]RM = 24 mass % T = 348 K
W = 900 s kv = 1
P
o
pu
la
ti
o
n de
ns
it
y n,
m
–1 m
–3
Crystal size L, Pm
Figure 4: Comparison of population density distributions of barium sulphate crystals: points - experimental data, solid lines - values calculated with the use of Eq. (10)
Brazilian Journal of Chemical Engineering
Crystallization Kinetics
The law of preserving the crystal number is mathematically expressed in the population balance equation form (Mullin, 1993).
The population balance of the mass crystallization process enables one to evaluate the analytical (or – in more complex cases – numerical, solved with the use of advanced iterative algorithms) interdependence of the number (volume, mass) of crystals and their size in a form of CSD with the resulting final effect of interrelations between the intrinsic process kinetics, hydrodynamics, crystallizer construction, arrangement of the apparatus interior, decisive technological parameter values and presence of other accompanying processes. This function can also be practically interpreted as an essential indicator of crystal product quality.
For the basic, simplified mathematical model of a mass crystallization process, assuming steady state in the continuous crystallizer with ideally mixed content (suspension), withdrawal of nonclassified, representative product (MSMPR-type crystallizer) and the absence of any possible accompanying processes (e.g. attrition, breakage, agglomeration, dissolution, etc.) the crystal population balance equation can be formulated in the form of a simple differential equation (Randolph and Larson, 1988), Eq. (2):
G(L) dG(L) G(L)IJ
dL n(L)
dn(L)
(2)
where G is the crystal linear growth rate, m s–1 and W is the suspension residence time, s.
From the experimental population density distributions ln(n) = f(L) of barium sulphate crystals (calculated from mass/volumetric CSD with the use of Eq. (1)), presented in Fig. 3 and Fig. 4, it can be observed that for the smallest size crystals (L < 2
Pm) the distribution course is clearly concave on top. This can be interpreted as the presence in the system of a complex kinetic phenomenon – Size Dependent Growth (SDG). This observed behavior (sudden increase in the amount of fines) is very essential from practical point of view since within this size range the largest fraction of the number of crystals is located. Considering the fine-grained morphology, this fraction is characterized by the highest specific area in respect to the whole crystal population.
A more detailed description of the process kinetics – assuming the size-dependent growth
(SDG) behavior and rendering the observed strong nonlinearity in the lnn(L) function for barium sulphate crystals of L < 2 Pm (see Fig. 3 and Fig. 4) – requires adoption of some empirical form of G(L) dependency before solving Eq. (2).
The empirical or semiempirical G(L) equations taken under consideration were developed by Bransom (1960); Canning and Randolph (CR) (1967); Abegg, Stevens and Larson (ASL) (1968); Rojkowski: exponential model (RE) (Rojkowski, 1977), hyperbolic model (RH) (Rojkowski, 1978a) and hyperbolic II model (RHII) (Rojkowski, 1978b); Mydlarz and Jones (1990) and Mydlarz (1996). Detailed analysis of the mathematical construction and restrictions of these G = f(L) equations proved that the Bransom (1960), Mydlarz-Jones (1990) and Mydlarz (1996) equations are valid only for crystals of L > 0. The assumption that a zero-sized nucleus results in a zero growth rate from a mathematical point of view, makes its further growth impossible. This means that for practical application of these formulas it becomes necessary to arbitrarily assume that the nucleus has a specific – not more closely defined – size Lz > 0, which can introduce into the
calculations some unpredictable calculation error. Some solutions of Eq. (2), obtained in the form of n(L) analytical expressions, comply with the assumed G(L) forms and are presented below (Eq. (3–12)) (Piotrowski, 2002):
ASL model (Abegg, Stevens and Larson, 1968):
b0 1 aL G
G (3)
for b = 1
¸¸¹· ¨¨ © §
1
aIJ G
1 01 aL 0
n
n (see Eq. (6))
for 0 < b < 1
1 b
0
0
1
1 aL 1
G IJa 1 b n n exp
bln 1 aL
ª § ª º ·º « ¨ ¬ ¼ ¸»
« ¨ ¸»
« ¨ ¸»
« ¨ ¸»
¨ ¸
« © ¹»
¬ ¼
(4)
CR model (Canning and Randolph, 1967):
1 aL GG 0 (5)
1 aIJ G
1 0
0
aL 1 n n
¸ ¹ · ¨ ©
Brazilian Journal of Chemical Engineering Vol. 25, No. 02, pp. 375 - 387, April - June, 2008
RE model (Rojkowski, 1977):
G G exp aL GG f f 0 (7)
00 0
G G G exp aL
ln
G n n exp
1 L
1
G aIJ G IJ
f f
f f
ª § ·º
« ¨ ¸»
« ¨ ¸»
« ¨ ¸»
« ¨ ª º ¸» « ¨¨ « » ¸¸» « © ¬ ¼ ¹»
¬ ¼
(8)
RH model (Rojkowski, 1978a):
aL 1 L aG G aL 1 G G G
G 0 0
¸ ¹ · ¨ © § f f
f (9)
0 0 2 0 0 0 0G G aG L G
1
ln
IJ aG G
n n exp
G aG L
1 L ln
IJG 1 aL G
f f
f
f
f
ª § § · ·º « ¨ ¨ ¸ ¸» « ¨ © ¹ ¸»
« ¨ ¸»
« ¨ § · ¸» « ¨¨ ¨¨ ¸¸ ¸¸» « © © ¹ ¹»
¬ ¼ (10)
RHII model (Rojkowski, 1978b):
G G L IJ G L G G G IJ G G G 0 2 0 2 0 f f f ff (11)
2 0 0 2 0 0 2 0 0 20 0 0
G G G L G GIJ L
ln
IJG G GIJ
n n exp
G GIJ G G G L ln
GIJG G G LG
f f f
f f
f f f
f f
ª § § · ·º « ¨ ¨ ¸ ¸» « ¨ ¨ ¸ ¸» « ¨ © ¹ ¸»
« ¨ ¸»
« ¨ § · ¸» « ¨ ¨ ¸ ¸» « ¨¨ ¨¨ª º¸¸ ¸¸» « © ©¬ ¼¹ ¹»
¬ ¼ (12)
where a is the parameter in the ASL, CR, RE and RH models of SDG, m–1; b is the exponent in the ASL model of SDG; G is the crystal linear growth rate, m s–1; G0 is the minimum crystal linear growth rate
(growth rate of nuclei), ms–1; Gf is the maximum crystal linear growth rate, ms–1; L is the characteristic linear size of the crystals, m; n is the population density (number of crystals within the specified size range in a unit volume of the suspension per this size range), m–1m–3; n0 is
the nuclei (zero-sized crystals) population density,
m–1m–3 and W is the suspension residence time, s. Knowing the nuclei population density, n0, and its
linear growth rate, G0, the nucleation rate B can then
be calculated from the following simple relationship, Eq. (13):
0 0G n
B (13)
RESULTS AND DISCUSSION
On the basis of our experimental data (Fig. 3 and Fig. 4), using ORIGIN PRO 6.1 software (nonlinear regression tool), the following parameter n0, G0, Gf,
a and b values in the analytical relationships n(L) corresponding to the selected G(L) equations were computed. For each n(L) function (model) and each experimental data set a mean square deviation (variance – (RMSD)2) was calculated in an ln form (see Eq. (14)):
exp
calc 2
2 Ȉ(ln n (L) ln n (L)) (RMSD)
p 1
(14)
where p is the number of experimental points. A comparison of sums of variances 6RMSD)2 for all six measurement series (see Table 1) enabled selection of the n(L) model which is the most compatible with our experimental data (assumed criterion – a minimal value of 6RMSD)2) and thus the corresponding G(L) equation form.
Analysis of the sums of variance (Table 1) suggests that RH – the Rojkowski hyperbolic model with 6RMSD)2 = 0.4605 – and RE – the Rojkowski exponential model with 6RMSD)2 = 0.7057 – fit the experimental data well. These models render both steep curvature in the initial L range and apparent linearity within the remaining L range very well. The remaining models with their considerably higher
6RMSD)2 values (ASL with 6RMSD)2= 1.5064, RHII with 6RMSD)2 = 1.6265 and CR with
6RMSD)2= 1.9397) do not seem to be adequate for description of lnn(L) and G(L) relations in the system under study. The kinetic parameter values of the process run in DTMn, DTMp and DT crystallizers, calculated by means of the five selected SDG models, are presented in Table 2 ([BaCl2]RM = 10 mass %) and Table 3 ([BaCl2]RM =
Brazilian Journal of Chemical Engineering
Table 1: Barium sulphate reaction crystallization in DTMn, DTMp and DT crystallizers - the (RMSD)2 and 6(RMSD)2 values for the selected SDG models.
(RMSD)2 for SDG model: Crystallizer
type
[BaCl2]RM
mass % p ASL CR RE RH RHII
10 27 0.5433 1.1403 0.1895 0.2097 0.3211
DTMn
24 24 0.0135 0.0123 0.0141 0.0132 0.2035
10 27 0.2603 0.6197 0.0630 0.0713 0.0824
DTMp
24 24 0.0558 0.0434 0.3613 0.0475 0.3852
10 17 0.2927 0.0425 0.0288 0.0380 0.0740
DT
24 14 0.3408 0.0815 0.0490 0.0808 0.5603
6(RMSD)2 1.5064 1.9397 0.7057 0.4605 1.6265
Explanations:
ASL - Abegg, Stevens and Larson model, Eqs. (3), (4) and (6) CR - Canning-Randolph model, Eqs. (5) and (6)
RE - Rojkowski exponential model, Eqs. (7) and (8) RH - Rojkowski hyperbolic model, Eqs. (9) and (10) RHII - Rojkowski hyperbolic II model, Eqs. (11) and (12)
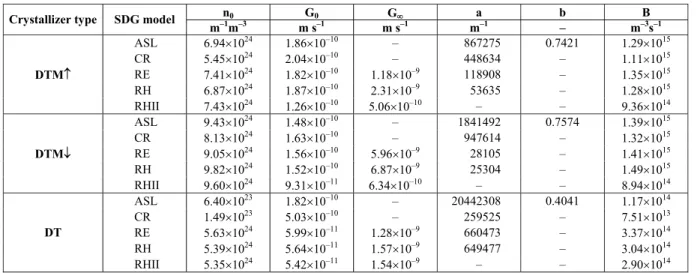
Table 2: Kinetic parameter values of nucleation and crystal growth for the selected SDG models in DTMn, DTMp and DT-type crystallizers. Barium sulphate crystals obtained for barium chloride
concentration in feeding solution 10 mass % at 348 K and W = 900 s (kv = 1).
Crystallizer type SDG model n0 G0 Gf a b B
– – m–1m–3 m s–1 m s–1 m–1 – m–3s–1
ASL 7.42u1026 1.12u10–12 – 25660097290
0.5951 8.34u1014
CR 1.12u1024 1.70u10–10 – 1367228 – 1.89u1014
RE 6.72u1026 6.36u10–12 1.32u10–9 556534 – 4.28u1015
RH 8.10u1026 5.24u10–12 1.73u10–9 471176 – 4.24u1015
DTMn
RHII 8.79u1026 2.72u10–12 1.46u10–9 – – 2.39u1015
ASL 2.75u1024 1.63u10–11 – 1206866602 0.5222 4.48u1013
CR 8.09u1022 2.98u10–10 – 899397 – 2.41u1013
RE 1.54u1024 3.86u10–11 1.59u10–9 666537 – 5.95u1013
RH 3.13u1024 2.40u10–11 1.98u10–9 634542 – 7.52u1013
DTMp
RHII 2.96u1024 2.85u10–11 2.13u10–9 – – 8.44u1013
ASL 1.10u1021 1.24u10–9 – 311814 0.4807 1.36u1012
CR 4.85u1021 7.48u10–10 – 277298 – 3.63u1012
RE 4.93u1021 4.47u10–10 2.55u10–9
378252 – 2.20u1012
RH 4.82u1021 4.39u10–10 3.00u10–9
398064 – 2.12u1012
DT
RHII 4.92u1021 4.76u10–10 3.23u10–9 – – 2.34u1012
Table 3: Kinetic parameter values of nucleation and crystal growth for the selected SDG models in DTMn, DTMp and DT-type crystallizers. Barium sulphate crystals obtained for barium chloride
concentration in feeding solution 24 mass % at 348 K and W = 900 s (kv = 1).
n0 G0 Gf a b B
Crystallizer type SDG model
m–1m–3 m s–1 m s–1 m–1 – m–3s–1
ASL 6.94u1024 1.86u10–10 – 867275 0.7421 1.29u1015
CR 5.45u1024 2.04u10–10 – 448634 – 1.11u1015
RE 7.41u1024 1.82u10–10 1.18u10–9 118908 – 1.35u1015
RH 6.87u1024 1.87u10–10 2.31u10–9
53635 – 1.28u1015
DTMn
RHII 7.43u1024 1.26u10–10 5.06u10–10 – – 9.36u1014
ASL 9.43u1024 1.48u10–10 – 1841492 0.7574 1.39u1015
CR 8.13u1024 1.63u10–10 – 947614 – 1.32u1015
RE 9.05u1024 1.56u10–10 5.96u10–9 28105 – 1.41u1015
RH 9.82u1024 1.52u10–10 6.87u10–9
25304 – 1.49u1015
DTMp
RHII 9.60u1024 9.31u10–11 6.34u10–10 – – 8.94u1014
ASL 6.40u1023 1.82u10–10 – 20442308 0.4041 1.17u1014
CR 1.49u1023 5.03u10–10 – 259525 – 7.51u1013
RE 5.63u1024 5.99u10–11 1.28u10–9 660473 – 3.37u1014
RH 5.39u1024 5.64u10–11 1.57u10–9 649477 – 3.04u1014
DT
Brazilian Journal of Chemical Engineering Vol. 25, No. 02, pp. 375 - 387, April - June, 2008
Population density plots of the experimental data are presented in Fig. 3 ([BaCl2]RM = 10 mass %) and
Fig. 4 ([BaCl2]RM = 24 mass %). From Fig. 3 it can be
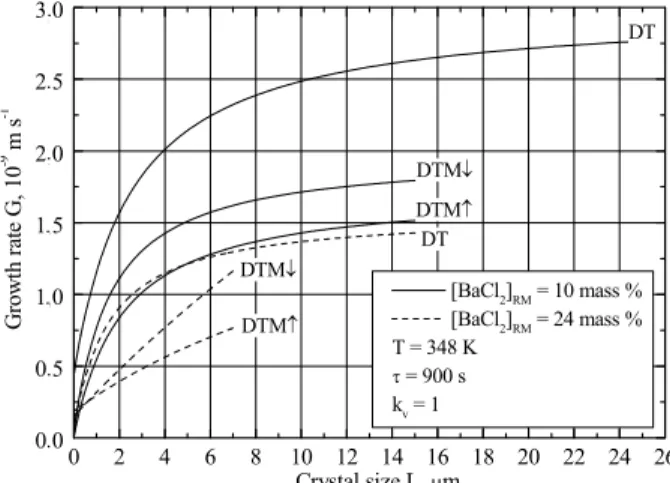
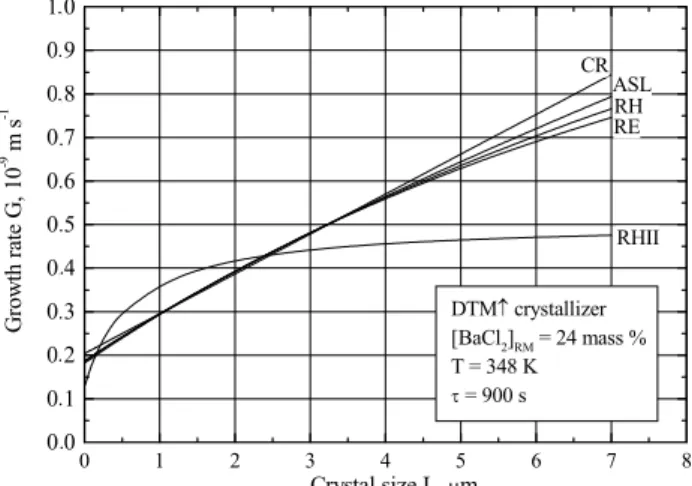
concluded that for L larger than ca. 8 Pm the effect of particle size on linear growth rate G is less and less pronounced, which is graphically represented by transformation of the distinctly observed curvature of lnn(L) within the initial L range into a practically linear relationship. Similar conclusions can be drawn from Fig. 4, but only for a DT apparatus where the authors have more n(L) data at their disposal than in the case of both liquid jet-pump DTM crystallizers. This experimental trend, observed in Fig. 3 and Fig. 4, is also reflected in Fig. 5 presenting the resulting six G(L) dependency courses for the three crystallizers and two assumed BaCl2 concentrations analyzed in
this study (the linear course of lnn(L) in Figs. 4 and 5 corresponds to stabilization of G value in Fig. 5 and thus its independence of L).
From Fig. 5 it can be concluded that for [BaCl2]RM = 10 mass % the highest value of G
corresponds to a DT-type crystallizer (G0 = 4.39u10– 10
m s–1 and Gf = 3.00u10–9 m s–1). Table 2 informs also that higher G corresponds to the DTMp type (G0 = 2.40u10–11 m s–1 and Gf = 1.98u10–9m s–1)
rather than to the DTMnconstruction (G0 = 5.24u10– 12
m s–1 and Gf = 1.73u10–9m s–1). It is noticeable that the difference between asymptotic values of Gf for DTMp (Gf = 1.98u10–9m s–1) and DTMn (Gf = 1.73u10–9 m s–1) is rather small. This important observation can be interpretted theoretically by calling attention of the reader to the hydrodynamic regime of inner circulation and the specific method of contacting both reagents in this original
technology. Both constructions, DT and DTMp, are characterized by a descending flow of suspension in the circulation profile/device. In this specific reaction crystallization system, a key factor in the instant ionic reactions in water solution seems to be a dissolution rate of the solid reagent, (NH4)2SO4,
being in turn a function of hydrodynamic conditions and turbulence level on micro- and macroscale within the bulk solution. As can be expected, the DTMn construction, with rather mild mixing conditions during ascending flow of circulated medium (e.g. final “fountain phenomenon” with a minimum of kinetic energy) provides in effect the lowest values of G. This dissolution phenomenon is also indirectly coupled with another kinetic process – nucleation rate. Lower dissolution rates (in a DT o DTMp o DTMnorder), as the effect of mixing that is not intensive enough, are also responsible for the lower efficiency in discharging the resulting concentration into the bulk of surrounding mother solution. In effect it can be presumed that some adhesive film layer of highly supersaturated mother liquid is spontaneously formed on the surface of the (NH4)2SO4 substrate, where a higher nucleation
(heterogeneous or even homogeneous) rate can be observed (possible catalytic effect of the ammonium sulphate surface, crystalographically similar to a product barium sulphate crystal network – catalytic/induced nucleation). The SDG model calculations also confirm these theoretical considerations, since for the DT-type apparatus the nucleation rate is B = 2.12u1012 m–3s–1, for DTMp it is B = 7.52u1013 m–3s–1 and finally for DTMn it reaches the highest value, B = 4.24u1015 m–3s–1.
0 2 4 6 8 10 12 14 16 18 20 22 24 26 0,0
0,5 1,0 1,5 2,0 2,5 3,0
[BaCl2]RM = 10 mass % [BaCl2]RM = 24 mass % T = 348 K
W = 900 s kv = 1 DTMn
DTMp
DT DTMp
DTMn
DT
.
.
.
. . . .
G
ro
w
th
r
at
e G
, 1
0
-9 m
s
-1
Crystal size L, Pm
Figure 5: Dependence of linear growth rate of barium sulphate crystals on their size G(L) - Eq. (9) - and data from Table 2 and Table 3 -
Brazilian Journal of Chemical Engineering
A higher concentration of BaCl2 in feeding
solution ([BaCl2]RM = 24 mass %, Table 3)
corresponds to a noticeable modification of overall (diffusion mechanism coupled with convection) mass transfer conditions between mother solution and suspended crystal phase. In this case the highest value of Gf corresponds to a DTMp construction (Gf = 6.87u10–9 m s–1, while G0 = 1.52u10–10 m s–1).
A similar construction, DTMn, has a bit lower value of maximal growth rate (Gf = 2.31u10–9 m s–1, while G0 = 1.87u10–10 m s–1), roughly comparable with the
value corresponding to a DT design (Gf = 1.57u10–9 m s–1, while G0 = 5.64u10–11 m s–1). In the case of
nucleation rate, similar values of B parameter are obtained for both jet-pump constructions, B = 1.49u1015 m–3s–1 for DTMp and B = 1.28u1015 m–3s–
1
for DTMn), while for the DT apparatus the B value is considerably lower (B = 3.04u1014 m–3s–1).
It can be concluded that from a technological point of view with the increase in BaCl2
concentration (from 10 to 24 mass %) in the case of the DT construction disadvantageous tendency is observed – a decrease in linear growth rate (Gf from 3.00u10–9 m s–1 to 1.57u10–9 m s–1 and G0 from
4.39u10–10 m s–1 to 5.64u10–11 m s–1) coupled with a considerable increase in nucleation rate B (from 2.12u1012 m–3s–1 to 3.04u1014 m–3s–1).
In the case of the DTMp apparatus, in spite of a significant increase in B value from 7.52u1013 m–3s–1 to 1.49u1015 m–3s–1 (however, the increment is smaller than in the DT case) an advantageous improvement in growth rate kinetics is observed (an increase in Gf from 1.98u10–9 m s–1to 6.87u10–9
m s–1 coupled with a simultaneous increase in G0
from 2.40u10–11 m s–1 to 1.52u10–10 m s–1).
Comparing the data for the DTMn crystallizer it is concluded that a slight increase in the Gf parameter value (from 1.73u10–9 m s–1 to 2.31u10–9 m s–1) and a noticeable increase in G0 (from 5.24u10– 12
m s–1 to 1.87u10–10 m s–1) correspond to an advantageous, however limited, decrease in nucleation rate (from B = 4.24u1015 m–3s–1 to 1.28u1015 m–3s–1).
Similar conclusions come to mind in analyzing the kinetic parameter values provided by a second SDG equation, namely the Rojkowski exponential (RE) model, with a bit lower statistical quality to the experimental data (6RMSD)2 = 0.7057 for the RE model compared to 6RMSD)2 = 0.4605 for the RH model discussed here in detail – see Table 1).
For example, in the case of a lower concentration of BaCl2 (10 mass %, Table 2) it is observed that for
the DTMn crystallizer G0 = 5.24u10–12 m s–1 (RH)
and 6.36u10–12 m s–1(RE), Gf = 1.73u10–9 m s–1 (RH) and 1.32u10–9 m s–1 (RE) and B = 4.24u1015 m–
3
s–1 (RH) and 4.28u1015 m–3s–1 (RE). For the DTMp crystallizer the corresponding kinetic parameter values are as follows: G0 = 2.40u10–11 m s–1(RH)
and 3.86u10–11 m s–1(RE), Gf = 1.98u10–9 m s–1 (RH) and 1.59u10–9 m s–1 (RE) and B = 7.52u1013 m–
3
s–1 (RH) and B = 5.95u1013 m–3s–1 (RE). Finally, in the case of the DT type apparatus the data are G0 =
4.39u10–10 m s–1 (RH) and 4.47u10–10 m s–1 (RE), Gf = 3.00u10–9 m s–1(RH) and 2.55u10–9 m s–1 (RE) and B = 2.12u1012 m–3s–1 (RH) and 2.20u1012 m–3s–1 (RE).
0 1 2 3 4 5 6 7 8
0,0 0,1 0,2 0,3 0,4 0,5 0,6 0,7 0,8 0,9 1,0
DTMn crystallizer [BaCl2]RM = 24 mass %
T = 348 K W = 900 s
RH ASL CR
RHII RE .
. . . . .
.
.
.
. . .
G
row
th ra
te
G
, 10
-9 m
s
-1
Crystal size L, Pm
Brazilian Journal of Chemical Engineering Vol. 25, No. 02, pp. 375 - 387, April - June, 2008
0 1 2 3 4 5 6 7 8
0,0 0,2 0,4 0,6 0,8 1,0 1,2 1,4
.
DTMp crystallizer [BaCl2]RM = 24 mass % T = 348 K
W = 900 s k
v = 1
RH
RHII RE
ASL CR
. . .
. . . .
G
row
th ra
te
G
, 1
0
-9 m
s
-1
Crystal size L, Pm
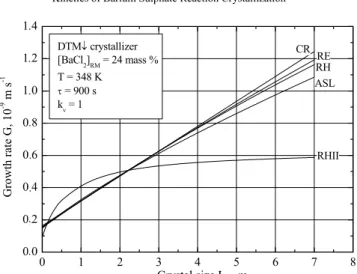
Figure 7: Dependence of linear growth rate of barium sulphate crystals on their size in the DTMp crystallizer – Eqs. (3), (5), (7), (9) and (11) with kinetic data from Table 3. Similar observations can be made on the basis of
Table 3. In Fig. 6 and Fig. 7, coincidence of G(L) curves provided by the RH and RE SDG models is clearly observed. Since their statistical indicators
6RMSD)2 are considerably higher (within the 1.5064 – 1.9397 range), all remaining SDG models (ASL, CR, RHII) provide kinetic data not strictly compatible with the experimental data. This results mainly from the mathematical limitations of the model equations, an inability to adjust to the characteristic curve of population density of experimental data characterized by both pronounced, high curvature within the range of smaller sizes and linearity for the largest sizes (flexibility of modeling). However, all these kinetic data (five SDG models – see Table 2 and Table 3) are quantitatively similar, in each case differing from each other maximally by one order of magnitude (except the CR and RHII sets – see also Fig. 6 and Fig. 7).
CONCLUSIONS
Two laboratory model crystallizers with internal circulation of suspension were tested in respect to their practical applicability in the area of reaction crystallization processes during precipitation of sparingly soluble inorganic compounds. An original liquid jet-pump construction was used in them (DTMp and DTMn) to secure the stable and sufficiently intensive circulation of growing crystal magma. The results were also compared with those for a conventional “reference” crystallizer equipped with a propeller agitator and a draft tube (DT) profile. The subject of process research was an
original proecological technology, where reaction crystallization of BaSO4 was practically controlled
by dissolution rate of solid substrate (NH4)2SO4.
Thus, in this specific process environment the hydrodynamic conditions (macro- and micromixing effects) inside the apparatus vessel (resulting, in turn, from the geometrical arrangement and its operational mode) played an extremely important role.
On the basis of research results for this specific system (highly concentrated solutions of BaCl2
contacted with solid (NH4)2SO4), it can be concluded
that with a gradual increase in a BaCl2 concentration
in the feeding solution (from 10 to 24 mass %) the initial superiority of the DT constructional solution over the two other designs (DTMp and DTMn), characterized by higher values of linear growth rates (both minimal and maximal) coupled with a lower nucleation rate, is beginning to yield to the advantages of modern liquid jet-pump constructions. In this case (24 mass % concentration) higher values of linear growth rate are observed in the DTMp and DTMncrystallizers, for both the G0 and Gf
parameters. Analyzing the nucleation data in connection with growth kinetic characteristics, however, one can conclude that although in the jet-pump construction nucleation rate is ca. one magnitude higher than that in the DT reference data, simultaneously higher values of both nucleation and growth rate indicate a general considerable improvement in the conditions of mass transfer between supersaturated mother solution and growing crystal phase.
Brazilian Journal of Chemical Engineering
reaction crystallization of sparingly soluble inorganic salts (especially for high concentrations of reaction substrates) in modern industrial-scale technologies.
ACKNOWLEDGEMENT
Crystal size distributions of barium sulphate were measured by means of a particle size analyzer COULTER LS – 230 at the Institute of Inorganic Chemistry, Gliwice, Poland.
NOMENCLATURE
a parameter in ASL, CR, RE and RH models of SDG
m–1 b exponent in ASL model of
SDG
B nucleation rate m–3s–1
[BaCl2]RM concentration of barium
chloride in the crystallizer feeding solution
mass %
G crystal linear growth rate m s–1 G0 minimal crystal linear growth
rate (growth rate of nuclei)
m s–1 Gf maximal crystal linear
growth rate
m s–1 kv crystal volumetric shape
factor
(-)
L characteristic linear size of crystal
m
Li average size of ith crystal
fraction in Eq. (1)
m
Lz nucleus size m
'Li size range of i th
crystal fraction in Eq. (1)
m
mi mass of ith crystal fraction
in Eq. (1)
kg
n population density (number of crystals within the
specified size range in a unit volume of the suspension per this size range)
m–1m–3
ni population density of ith
crystal fraction in Eq. (1)
m–1m–3 n0 nuclei (zero–sized crystals)
population density
m–1m–3 ncalc population density
calculated
m–1m–3 nexp population density
experimental
m–1m–3
Peu unit power of feeding
stream
W kg–1 p number of experimental
points
qvs volumetric flow rate of
suspension
m3 s–1 s number of agitator
revolutions
s–1
T process temperature K
Vi volume of ith crystal
fraction in Eq. (1)
m3 Vw crystallizer working
volume
m3
Greek Letters
Uc crystal density kg m
–3
W suspension residence time W=Vw/qvs s
Abbreviations
ASL Abegg, Stevens and Larson model of SDG
(-)
CR Canning and Randolph model of SDG
(-)
CSD Crystal Size Distribution (-) DT Draft Tube (crystallizer) (-) DTM Draft Tube Magma
(crystallizer)
(-)
MSMPR Mixed Suspension Mixed Product Removal (crystallizer)
(-)
RE Rojkowski exponential model of SDG
(-)
RH Rojkowski hyperbolic model of SDG
(-)
RHII Rojkowski hyperbolic II model of SDG
(-)
RMSD Root Mean Square Deviation (in this work calculated in an ln form)
(-)
(RMSD)2 Mean Square Deviation (variance) (in this work calculated in an ln form)
(-)
SDG Size-dependent Growth (-)
REFERENCES
Brazilian Journal of Chemical Engineering Vol. 25, No. 02, pp. 375 - 387, April - June, 2008
Bransom, S. H., Factors in the Design of Continuous Crystallizers, Brit. Chem. Eng., 5, 838 (1960). Canning, T. F. and Randolph, A. D., Some Aspects
of Crystallization Theory: Systems that Violate McCabe’s Delta L Law, AIChE J., 13, 5 (1967). Koralewska, J., Matynia, A., Piotrowski, K. and
Wierzbowska, B., Crystallization of Barium Sulphate in a Continuous DTM Type Crystallizer with a Jet-Pump of Descending Suspension Flow in a Mixing Chamber, Materials of the International Congress of Chemical and Process Engineering CHISA, CD–ROM, No. 278, Proc. Eng. Publisher, Prague, Czech Republic (2006a). Koralewska, J., Matynia, A., Piotrowski, K. and
Wierzbowska, B., Precipitation of Barium Ions with Solid Ammonium Sulfate in a Continuous DTM Crystallizer with a Liquid Jet Pump of Ascending Suspension Flow in a Mixing Chamber, Chem. Proc. Eng., 27, 1555-1579 (2006b).
Matynia, A., Crystallizers with a Jet-Pump, InĪ. Ap. Chem., 36, No. 6, 9 (1997) (in Polish).
Matynia, A., Wlazáo, P. and Koralewska, J., The Influence of Residence Time on the Crystallization of Barium Sulphate in the Process of Barium Ions Precipitation by Means of Crystalline Ammonium Sulphate Addition, Pol. J. Appl. Chem., XLV, No. 3-4, 91 (2001).
Matynia, A., Used Quenching Salts Treatment Process, Environ. Protection Eng., 28, No. 2, 77 (2002).
Matynia, A., Piotrowski, K., Koralewska, J. and Wierzbowska, B., Barium Sulphate Crystallization Kinetics in the Used Quenching Salts Treatment Process, Chem. Eng. Technol., 27, 559 (2004). Matynia, A., Koralewska, J., Wierzbowska, B. and
Piotrowski, K., Jet-Pump Crystallizers in the Reaction-Crystallization Processes of Sparingly Soluble Salts, Pol. J. Chem. Technol., 7, No. 3, 56 (2005a).
Matynia, A., Piotrowski, K. and Koralewska, J., Barium Sulphate Crystallization Kinetics in the Process of Barium Ions Precipitation by Means of
Crystalline Ammonium Sulphate Addition, Chem. Eng. Proc., 44, 485 (2005b).
Mersmann, A., Crystallization Technology Handbook, Marcel Dekker, New York (1995). Mullin, J.W., Crystallization, Butterworth–Heinemann,
Oxford (1993).
Mydlarz, J. and Jones, A. G., On Modelling the Size-Dependent Growth Rate of Potassium Sulphate in a MSMPR Crystallizer, Chem. Eng. Comm., 90, 47 (1990).
Mydlarz, J., A Hyperbolic Crystal Growth Rate Model, 13th Symposium on Industrial Crystallization, Toulouse, 275 (1996).
Myerson, A.S., Handbook of Industrial Crystallization, Butterworth-Heinemann, Boston (1993).
Nielsen, A.E., Kinetics of Precipitation, Pergamon Press, Oxford (1964).
Nývlt, J., Söhnel, O., Matuchová, M. and Broul, M., The Kinetics of Industrial Crystallization, Academia, Prague (1985).
Piotrowski, K., Computer Aided Design of Continuous Tank Crystallizers, Ph.D. diss., Silesian University of Technology, Gliwice, Poland (2002) (in Polish).
Randolph, A. D. and Larson, M. A., Theory of Particulate Processes: Analysis and Techniques of Continuous Crystallization, Academia Press, New York (1988).
Rojkowski, Z., New Empirical Kinetic Equation of Size Dependent Crystal Growth and Its Use, Kristall und Technik, 12, 1121 (1977).
Rojkowski, Z., New Hyperbolic Empirical Model of Size Dependent Crystal Growth, Bulletin de L’Academie Polonaise des Sciences - Serie des sciences chimiques, XXVI, 265 (1978a).
Rojkowski, Z., Two Parameter Kinetic Equation of Size Dependent Crystal Growth, Kristall und Technik, 13, 1277 (1978b).
Rojkowski, Z. and Synowiec, J., Krystalizacja i Krystalizatory, WNT, Warsaw (1991) (in Polish). SĘhnel, O. and Garside, J., Precipitation: Basic