ISSN 0104-6632 Printed in Brazil
www.abeq.org.br/bjche
Vol. 25, No. 02, pp. 337 - 349, April - June, 2008
Brazilian Journal
of Chemical
Engineering
SIMULATION OF STYRENE
POLYMERIZATION REACTORS: KINETIC
AND THERMODYNAMIC MODELING
A. S. Almeida
2, K. Wada
1and A. R. Secchi
1*1
GIMSCOP, Departamento de Engenharia Química, Universidade Federal do Rio Grande do Sul, Phone: +(55) (51) 3308-3528, Fax: +(55) (51) 3308-3277, Rua Sarmento Leite 288/24,
CEP: 90050-170, Porto Alegre – RS, Brasil. E-mail: [email protected]
2Engenharia de Processos, INNOVA S/A, Phone: +(55) (51) 3457-5835, Fax: +(55) (51) 3457-5829, Rod. Tabaí-Canoas, BR 336, Km 419,
Pólo Petroquímico, CEP: 95853-000, Triunfo - RS, Brasil. E-mail: [email protected]
(Received: June 23, 2006 ; Accepted: April 25, 2007)
Abstract - A mathematical model for the free radical polymerization of styrene is developed to predict the steady-state and dynamic behavior of a continuous process. Special emphasis is given for the kinetic and thermodynamic models, where the most sensitive parameters were estimated using data from an industrial plant. The thermodynamic model is based on a cubic equation of state and a mixing rule applied to the low-pressure vapor-liquid equilibrium of polymeric solutions, suitable for modeling the auto-refrigerated polymerization reactors, which use the vaporization rate to remove the reaction heat from the exothermic reactions. The simulation results show the high predictive capability of the proposed model when compared with plant data for conversion, average molecular weights, polydispersity, melt flow index, and thermal properties for different polymer grades.
Keywords: Polystyrene; Free-radical polymerization; Polymeric solution; Auto-refrigerated reactors.
INTRODUCTION
Many researchers have been involved in studying the phenomenon of thermo auto-initiation of styrene. Flory (1937) was the first who suggested that this polymerization is initiated by the combination of two molecules of styrene to produce a diradical. However, further statistical analysis indicated that these diradicals react very fast in order to start the polymerization. Mayo (1961) proposed the mechanism for this reaction. The first stage of the mechanism is the dimerization reaction of Diels Alder; in the next stage, the obtained diradical reacts with a third molecule of styrene, producing two types of radicals responsible for the initiation of the
polymerization, propagation, and termination reactions.
When discussing the kinetics of polymerization of styrene, it is impossible not to mention the kinetic model of the thermal initiation proposed by Hui and Hamielec (1972). In their article, the authors made an experimental study of the thermal polymerization of styrene between the temperatures of 100 and
200oC and a range of conversion from 0 to 100%.
338 A. S. Almeida, K. Wada and A. R. Secchi
From the 80’s, with an increased industrial interest in the application of multi-functional initiators for reaction of free radicals, new studies were published about the kinetic behavior of styrene polymerization. The importance of these studies is based on the nature of the free-radical polymerization, where high conversions and high molecular weights cannot be, in general, obtained simultaneously. The practical advantages of these multi-functional initiators are, in principle, the reduction of the polymerization time and the increase of the molecular weight control, being unnecessary major modifications in the reactor. Villalobos et al. (1991) developed models for the kinetics of the polymerization using three types of bi-functional initiators. From the comparison between bi-functional initiators and one mono-bi-functional, it was concluded that distribution of molecular weights is controlled by the rate of polymerization with bi-functional initiators. The different kinetics of decomposition of the two peroxide groups of bi-functional initiators was considered by the authors by taking into account the change of the activation energy for homolysis of the second peroxide group, which takes place only after the homolysis of the first group.
In many industrial processes of polymers, data for the vapor-liquid equilibrium (VLE) are crucial. On this basis, many equations of state (EOS) and coefficients of activities models have been proposed in the last two decades. Loulli and Tassius (2000) used the cubic equation of state of Peng-Robinson; where the parameters a (energy) and b(co-volume) for the polymers were obtained by experiments. The EOS was applied to the low-pressure vapor-liquid equilibrium for various polymeric solutions through the use of an interaction parameter with three mixing rules: van der Walls, Zhong and Masuoka (ZM), and Huron-Vidal of first order (MHV1). These rules were used together with the cubic equation of state
and the model of Flory-Huggins. The parameters a
andbwere determined by fitting the model to PVT
data of pure polymer and considering that a/MW and
b/MV are independent of MW (average molecular
weight). They applied the VLE model in a large variety of solvent-polymer systems, and the best result was obtained with the ZM mixing rule.
In the present work, kinetic and thermodynamic models of styrene polymerization in solution, using data from an industrial plant, were developed. Based on these models, a dynamic mathematical model for a series of two auto-refrigerated reactors was built to predict the quality of the polymer product for
different process operating conditions. The reactors were modeled as reactive separation systems with two equilibrium stages. The reacting system considered is constituted, mainly, by the monomer (styrene), the solvent (ethyl-benzene) and the polymer (polystyrene). The heat of the exothermic reaction is removed, in the form of heat of vaporization, by the vapor phase stream leaving the reactor. For the phase equilibrium calculation, the Peng-Robinson EOS and the ZM mixture rule with the extension of Louli and Tassios (2000) for the energy and co-volume parameters for the polymer were used. The kinetic and binary interaction parameters were estimated with the use of available and limited data in the industry. In the next three sections, the kinetic, the thermodynamic, and the process models are presented, respectively.
KINETIC MODEL
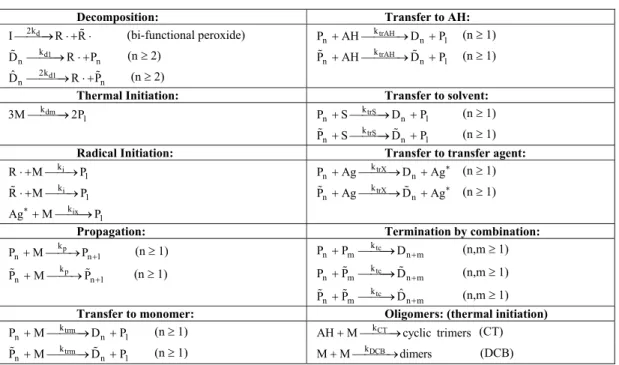
The polymerization of styrene can be initiated thermally and by bi-functional peroxide, following the conventional kinetics of free-radical initiation, propagation, termination, and chain transfer. The thermal initiation becomes substantial at polymerization temperatures above 100°C (Chen, 2000). The thermal initiation mechanism proposed by Hui and Hamielec (1972) is represented by a third-order kinetics with respect to the styrene monomer. The decomposition of the bi-functional initiator takes place by the bond scission of one peroxide group and not by the simultaneous bond scission of the two peroxide groups (Villalobos et al., 1991). It is also considered that the chain termination occurs exclusively by combination. Termination by disproportion is negligible in the polymerization of styrene (Chen, 2000). With the above assumptions, the mechanism of the polymerization reactions is
given in Table 1, where I is the bi-functional
peroxide; Ag is the chain transfer agent; Ag* is the radical transfer agent; AH is 1-phenyltetralin; Pn and Dn are the alive and dead polymers of size n without
a non-dissociated peroxide group; Pnand Dn are the
alive and dead polymers of size n with a
non-dissociated peroxide group; D is the temporarily ˆn dead (or dormant) polymer of size n with two
non-dissociated peroxide groups; Ris the primary
Table 1: Kinetics of styrene polymerization
Decomposition: Transfer to AH:
d
2k
Io R R (bi-functional peroxide) ktrAH
n n 1
P AHoD P (n t 1)
d1
k
n n
D o R P (n t 2) ktrAH
n n 1
P AHoD P (n t 1)
d1
2k
n n
ˆ
D o R P (n t 2)
Thermal Initiation: Transfer to solvent:
dm
k 1
3Mo2P ktrS
n n 1
P S oD P (n t 1)
trS
k
n n 1
P S oD P (n t 1)
Radical Initiation: Transfer to transfer agent:
i
k 1
R oM P ktrX
n n
P AgoD Ag (n t 1)
i
k 1
R oM P ktrX
n n
P AgoD Ag (n t 1)
ix
k 1
AgMoP
Propagation: Termination by combination:
p
k
n n 1
P MoP (n t 1) Pn PmktcoDn m (n,m t 1)
p
k
n n 1
P MoP (n t 1) ktc
n m n m
P P oD (n,m t 1)
tc
k
n m ˆn m
P P oD (n,m t 1)
Transfer to monomer: Oligomers: (thermal initiation)
trm
k
n n 1
P MoD P (n t 1) AHMkCTocyclic trimers (CT)
trm
k
n n 1
P MoD P (n t 1) MMokDCB dimers (DCB)
The gel effect must be taken into account for free-radical polymerization reactions with high conversions, where the termination reaction becomes controlled by diffusion, and the effective constant for termination decreases considerably with the increase of the monomer conversion. The correlation suggested by Hui and Hamielec (1972), as function of the conversion (X) and the reaction temperature (T), was used in the gel effect for the polymerization reaction of styrene, represented in Equation 1.
2 3tc tco 1 2 3
k k exp -2 A X ª¬ A X A X º¼ (1)
where
-3 1
A 2.57 - 5.05 x 10 T (K) (2)
-2 2
A 9.56 - 1.76 x 10 T (K) (3)
-3 3
A - 3.03 7.85 x 10 T (K) (4)
ktco is the kinetic constant without the gel effect.
The chain transfer to sub-products of the thermally initiated reaction must be considered in order to have an effective constant of transfer to monomer. The importance of the chain transfer to
sub-products was studied by Pryor and Coco (1970), showing that the degree of polymerization at low auto-initiated conversions is much bigger than at high conversions. In order to explain this kind of anomalous behavior, it was suggested that the transfer to monomer controls the chain termination in low-conversion processes. However, when the concentration of AH increases, the transfer to AH becomes more important for chain termination. On this basis, a large parcel of the chain transfer constant to styrene is, in reality, the result of the chain transfer to AH:
trm trm trAH
P apparent P real P
k k k AH
k k k M
§ · § ·
¨ ¸ ¨ ¸
© ¹ © ¹ (5)
However, because the kinetic constants of the intermediary reactions of thermal initiation are unknown, the empirical form of Hui and Hamielec (1972) is an alternative to the use of Equation 5. During an experimental study, the authors considered that all the constants are independent of the size of the polymer chain but can vary with the conversion and they suggest Equations 6 to 8:
trm trm
1 P apparent P real
k k
B X
k k
§ · § ·
¨ ¸ ¨ ¸
340 A. S. Almeida, K. Wada and A. R. Secchi
3 1
473.12 T B 1.013x10 log
202.5
§ ·
¨ ¸
© ¹ T < 473K (7)
1
1 1
1
0.01E 1 1
B ; E 0.9755exp 12180
1 2E T 473
§ § ··
¨ ¨ ¸¸
© © ¹¹
(8) forTt 473K
In this experimental study, Hui and Hamielec (1972) also considered that the propagation reactions are influenced by the conversion and that Equation 6 could be used to obtain the variation of the kinetic
constant (kp) with the conversion. However,
according to Chen (2000), it is not necessary to take into account the effect of the conversion on the propagation reaction for solution polymerization.
Undertaking a mass balance of the species, without considering their inflow and outflow at this stage, and by applying the method of moments while using the assumption of QSSA (quasi-steady-state approximation) for the radicals, the final kinetic model is obtained:
d
d I.V 1
2fk I
V dt (9)
3
d d1 o o dm
2 1 o o trX o o CT DCB
d M.V 1
ˆ
4fk I fk 2 2k M
V dt
c k Ag k M k M
P P
Q Q Q Q
(10)
trX o o
d Ag.V 1
k Ag
V dt Q Q (11)
trS o o
d S.V 1
k S
V dt Q Q (12)
trAH o o CT
d AH.V 1
k AH k M
V dt Q Q (13)
2 DCB
d DCB.V 1
k M
V dt (14)
CT
d CT.V 1
k M
V dt (15)
3 o
dm d d1 o o
2
trX o 2 o tc o tc o o
d V
1
ˆ
2k M 2fk I fk 2 2
V dt
k MAg c k k
Q
P P
Q Q Q Q Q
(16)
3 1dm d d1 o o 1
2 o o trX o o P o
2 1 trX 1 tc o 1 tc 1 o
d V 1
ˆ
2k M 2fk I fk 2
V dt
c k Ag k M
c k Ag k k
Q P P P
Q Q Q Q Q
Q Q Q Q Q Q
(17)
3 2dm d d1 o o 2
2 o o trX o o P 1 o
2 2 trX 2 tc 2 o tc 2 o
d V 1
ˆ
2k M 2fk I fk 2
V dt
c k Ag k M 2
c k Ag k k
Q P P P
Q Q Q Q Q Q
Q Q Q Q Q Q
(18)
o
d trX o 2 o
2
tc o tc o o d1 o
d V
1
2fk I k Ag c
V dt
ˆ
k k 2fk
Q Q Q
Q Q Q P
(19)
1
d P o 2 1
trX 1 tc o 1 tc 1 o d1 1
d V 1
2fk I k M c
V dt
ˆ
k Ag k k 2fk
Q Q Q
Q Q Q Q Q P
(20)
2
d P 1 o 2 2
trX 2 tc 2 o tc 2 o d1 2
d V
1
2fk I k M(2 ) c
V dt
ˆ
k Ag k k 2fk
Q Q Q Q
Q Q Q Q Q P
(21)
2 o
2 o trX o tc o
d V
1 1
c k Ag k
V dt 2
P Q Q Q
(22)
1
2 1 trX 1 tc 1 o
d V
1
c k Ag k
V dt
P
Q Q Q Q (23)
2
2 2 trX 2
2 tc o 2 1
d V
1
c k Ag
V dt
k
P
Q Q
Q Q Q
(24)
o
2 o trX o
tc o o d1 o
d V
1
c k Ag
V dt
k k
P
Q Q
Q Q P
(25)
1
2 1 trX 1
tc o 1 o 1 d1 1
d V
1
c k Ag
V dt
k k
P
Q Q
Q Q Q Q P
2
2 2 trX 2
tc o 2 1 1 o 2 d1 2
d V
1
c k Ag
V dt
k 2 k
P
Q Q
Q Q Q Q Q Q P
(27)
2 o
tc o d1 o
ˆ
d V
1 1
ˆ
k 2k
V dt 2
P
Q P (28)
1
tc 1 o d1 1
ˆ
d V
1
ˆ
k 2k
V dt
P
Q Q P (29)
22
tc o 2 1 d1 2
ˆ
d V
1
ˆ
k 2k
V dt
P
Q Q Q P (30)
where
1 p trm
c k Mk M;c2 ktrmMk Strs ktrAHAH;
Qk and Pk are the kth-order moments of alive and dead
polymer without a non-dissociated peroxide group;
k
Q and Pk are the kth-order moments of alive and dead polymer with a non-dissociated peroxide group;
k ˆ
P is the kth-order moment of temporarily dead (or dormant) polymer with two non-dissociated peroxide groups; V is the volume of the liquid phase; and f is the initiator efficiency.
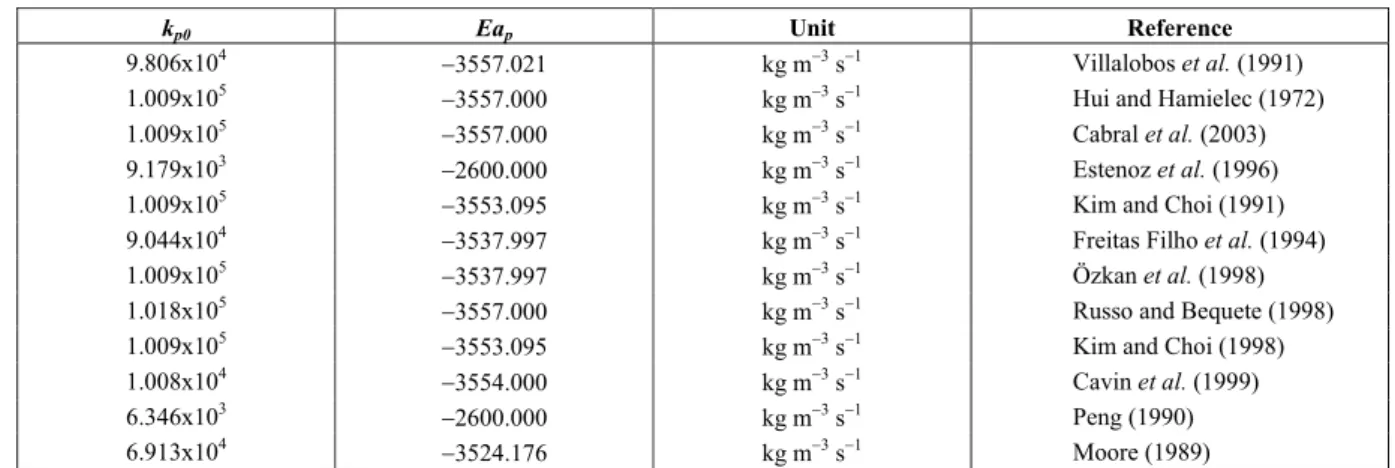
Different sets of kinetic parameters were found in the literature, showing a high variability in their values as illustrated in Table 2 for the propagation rate constants. In order to select an appropriate set of kinetic parameters, a sensitivity analysis was carried out among several combinations of parameters. The more suitable set of published kinetic constants employed to fit the available plant data is given in Table 3.
Table 2: Propagation rate constants, where kp=kp0 exp(-Eap/T), with T in Kelvin
kp0 Eap Unit Reference
9.806x10⁴ 3557.021 kg m3 s1 Villalobos et al. (1991)
1.009x10⁵
3557.000 kg m3 s1 Hui and Hamielec (1972)
1.009x10⁵
3557.000 kg m3 s1 Cabral et al. (2003)
9.179x10³ 2600.000 kg m3 s1 Estenoz et al. (1996)
1.009x10⁵
3553.095 kg m3 s1 Kim and Choi (1991)
9.044x10⁴
3537.997 kg m3 s1 Freitas Filho et al. (1994)
1.009x10⁵ 3537.997 kg m3 s1 Özkanet al. (1998)
1.018x10⁵
3557.000 kg m3 s1 Russo and Bequete (1998)
1.009x10⁵ 3553.095 kg m3 s1 Kim and Choi (1998)
1.008x10⁴ 3554.000 kg m3 s1 Cavin et al. (1999)
6.346x10³
2600.000 kg m3 s1 Peng (1990)
6.913x10⁴ 3524.176 kg m3 s1 Moore (1989)
Table 3: Kinetic constants, where k=k0 exp(-Ea/T), with T in Kelvin
k k0 Ea unit Reference
kd 3.470u1015 17128 s-1 Akzo (supplier)
kd1 1.817u1019 21361 s
-1
Villalobos et al. (1991)
kp 6.346u103 2600 kg m-3s-1 Peng (1990)
kdm 2.019u101 13810 kg
3
m-6s-1 Hui e Hamielec (1972)
ktrm 3.110u103 5631 kg m-3s-1 Kim e Choi (1989)
ktc 1.205u107 844 kg m
-3
s-1 Hui e Hamielec (1972)
ktrS 1.968u104 6302 kg m-3s-1 Moore (1998)
ktrX 4.263u108 4304 kg m
-3
s-1 Supplier
kCT 1.266u105 11078 s-1 Chen (2000)
kDCB 7.600u104 14087 kg m
-3
342 A. S. Almeida, K. Wada and A. R. Secchi
THERMODYNAMIC MODEL
The Peng-Robinson equation of state (Equation 31), with the values of the parameters a (energy) and
b (co-volume) determined experimentally by Loulli
and Tassius (2000) for the polymer, was used to predict the low-pressure vapor-liquid thermodynamic equilibrium.
2 2
RT a
P
VbV 2Vbb (31)
The parameters a and b were obtained by fitting
the model to PVT data of pure polymer and taking
into account that a/MW and b/MW are independent of MW (average molecular weight). The equations that express the mixing rule ZM (Loulli and Tassios, 2000) are as follow:
m
DD
a Q
1 DD (32)
m
Q b
1DD (33)
with
i j
ij i j
a
Q x x b
RT
§ ·
¨ ¸
© ¹
¦¦
(34)i i
i i
a
DD x
b RT
¦
(35)j i
i j ij
ij
a a
a 1
b b b 1 k
RT 2 RT RT
ª§ · § ·º
§ ·
« ¨ ¸»
¨ ¸ ¨ ¸ ¨ ¸
© ¹ «¬© ¹ © ¹»¼ (36)
these equations consider the interaction between polystyrene, styrene, and ethyl-benzene components through the binary parameters kij.
PROCESS MODEL
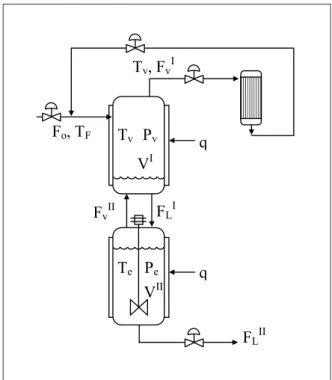
The mathematical model proposed for two auto-refrigerated reactors in series of an industrial plant is illustrated in Figure 1. Auto-refrigerated chemical
reactors are also known as chemical reactors with evaporative cooling. The vapor boiled from the liquid is condensed in a heat exchanger and, generally, the condensate is returned to the reactor. The condenser operates at lower pressure than the reactor since there must be a pressure gradient to drive the vapor from the reactor to the condenser. Several polymerization reactions are carried out in industry in auto-refrigerated reactors (Beckman, 1973; Henderson III and Cornejo, 1989; Toledo et al., 2005). In the studied process, the condensate is returned to the feed stream, before a heat exchanger that controls the feed temperature of the first reactor, see Figure 1.
Each reactor was modeled as a reactive distillation system with two equilibrium stages, as illustrated in Figure 2. The liquid phase in the bottom stage, where the polymerization reactions occur, was considered at its bubble point. No liquid holdup was considered in the top stage, acting as an instantaneous flash drum of the feed stream. The reactor temperature is controlled by manipulating the vaporization rate in the top stage. The heat of the exothermic reaction is removed, in the form of heat of vaporization, by the vapor phase stream leaving the reactor. The liquid stream from the top to the bottom stage provides the cooling of the reaction mixture, since it is at lower temperature due to the flashing. The following assumptions were also considered in the model:
The reacting medium is in perfect mixing.
The heats of initiation and termination reactions are negligible when compared to the heat of the propagation reaction.
The reactions are irreversible.
The cooler inlet temperature and the condenser
pressure are specified.
WO CHAIN TRANSFER
INITIATOR ADITIVE CHAIN TRANSFER
2º REACTOR
STYRENE
VACCUM
MATRIZ
PELLETIZING 1º REACTOR
CONDENSATOR
CONDENSATORS WO
CHAIN TRANSFER
INITIATOR ADITIVE CHAIN TRANSFER
2º REACTOR
STYRENE
VACCUM
MATRIZ
PELLETIZING 1º REACTOR
CONDENSATOR
CONDENSATORS
Figure 1: Simplified diagram of the styrene polymerization process.
q Fo, TF Tv Pv
Tv, FvI
q
FLII
Te Pe
FLI
FvII
VI
VII
344 A. S. Almeida, K. Wada and A. R. Secchi
For the auto-refrigerated CSTR, the energy balance equation for Stage I (adiabatic) in the quasi-stationary state is given by:
II II I I I I
o o V L V
F h F H F h F H 0 (37)
In relation to Stage II (non-adiabatic), the following energy balance was written:
II
II II II I I II L L pL L
II II II II
V r p L
dT
V c F (h h )
dt
F (H h ) ( H )r V q
U
' (38)
In these equations, hI, HI, hII,HII, are the liquid and vapor enthalpies in Stages I and II, respectively,
ho is the feed enthalpy; V and LII TII are the liquid
volume and temperature in Stage II; UIILand cIIpL are
the liquid specific mass and heat in Stage II; q is the heat exchanged with the thermal oil during startups
and shutdowns, and 'Hr is the heat of the
propagation reaction with rate rp. The overall mass
balance and component balances for each stage were written in the same way, using the kinetic rates given in Section 2.
Polymer Properties
The number and mass average molecular weights can be calculated by using the radical and polymer moments:
1 1 1 1 1
n M
0 0 0 0 0
ˆ
M M
ˆ
P P P Q Q P P P Q Q
(39)
2 2 2 2 2
w M
1 1 1 1 1
ˆ
M M
ˆ
P P P Q Q P P P Q Q
(40)
where MM is the monomer molecular weight. The viscosity of the reaction mixture is estimated by Mendelson’s correlation (Chen, 2000) for concentrations between 40 and 100% of polystyrene in ethyl-benzene and temperatures between 60 and 200°C:
15 10.7 3.4 w
a
3.31 10 X M
E 1 1
exp , 1Pa s
R T 473
P u
ª§ ·§ ·º
«¨ ¸©¨ ¸¹»
© ¹
¬ ¼
(41)
withEa 2300 exp 2.4X
.The thermal, rheological, and mechanical properties of solid polystyrene may depend upon the residual styrene (xM), dimer, trimer (xCT), oligomers
(methanol soluble), mineral oil (xoil), or polymer
molecular weights in the final product. The melt flow index (MFI), Vicat temperature, heat distortion temperature (HDT), and tensile strength (TS) of the polystyrene are estimated from Wooden’s correlations (Chen, 2000).
w
n
oil M
M
ln MFI 23.29 3.27 ln
1000
M
0.877 ln 0.233 100x 0.562x
1000
§ ·
¨ ¸
© ¹
§ ·
¨ ¸
© ¹
(42)
oilo
M CT
Vicat (195 5.71 100x
16.3x 2.8x ) /1.8 C
(43)
oilo
M CT
HDT (173.2 4.74 100x
15.8x 1.77x ) /1.8 C
(44)
n
oil
21895000 TS 1213650
M 1000
43210 100x , MPa
(45)
RESULTS
The models were implemented in MATLAB, version 5.3. In the first step, the binary interaction parameters were estimated using plant data of four different polymer grades (two grades, A and B, of high molecular weight, about 280,000, and two grades, C and D, of low molecular weight, between
170,000 and 240,000). The ethylbenzenestyrene
interaction parameter was estimated by using the flash model at the top stage and minimizing the difference between the reactor pressure and the calculated pressure, given the top stage temperature and vapor fraction. The styrenepolystyrene and the
ethylbenzenepolystyrene binary interaction
bottom stage (Wada et al., 2002). The obtained binary interaction parameters are given below.
styreneethylbenzene: 0.0728
styrenepolystyrene: 0.8959
ethylbenzenepolystyrene: 0.8818
The binary parameters between polystyrene and the other components are compatible with the ones
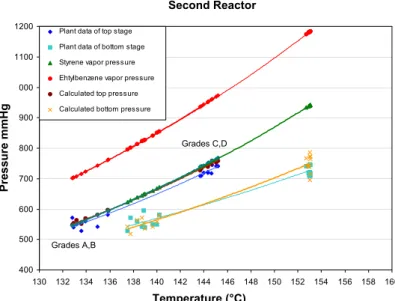
obtained by Louli and Tassios (2000) for polystyrene with aromatic solvents (benzene, toluene). The presence of different grades of polymer in the liquid phase is well represented by the dependency of the energy and co-volume parameters with the molecular weight of the polymer molecules, as can be observed in Figures 3 and 4. These figures present the plant data and calculated results for the top and bottom pressures of both reactors, as well as the vapor pressures of styrene and ethylbenzene at different top operating conditions.
First Reactor
300 400 500 600 700 800
120 122 124 126 128 130 132 134 136 138 140
Temperature (°C)
Pressu
re (mmHg
)
Plant data of top stage
Plant data of bottom stage
Styrene vapor pressure Ethylbenzene vapor pressure
Calculated top pressure Calculated bottom pressure
Grades A,B
Grades C,D
Temperature (°C) First Reactor
Pr
ess
u
re
mmHg
Figure 3: Reactor and vapor pressures versus reactor temperature for the first reactor.
Second Reactor
400 500 600 700 800 900 1000 1100 1200
130 132 134 136 138 140 142 144 146 148 150 152 154 156 158 160
Temperature (°C)
Pressu
re (mmHg
)
Plant data of top stage
Plant data of bottom stage Styrene vapor pres sure
Ehtylbenzene vapor pressure
Calculated top pressure Calculated bottom pressure
Grades A,B
Grades C,D
Temperature (°C) Second Reactor
Pres
sur
e
mm
Hg
346 A. S. Almeida, K. Wada and A. R. Secchi
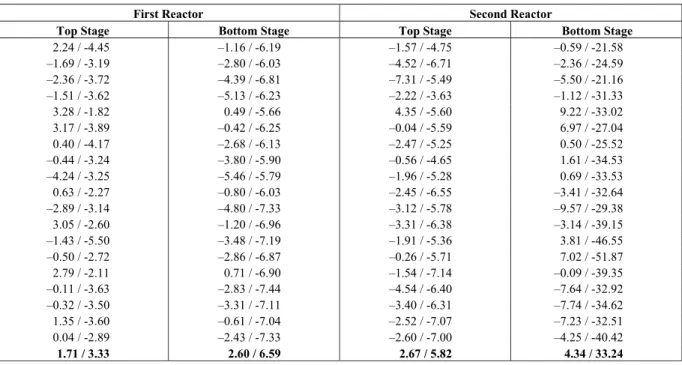
Due to the narrow region of coexistence of phases for this system, the fitted thermodynamic model presents a significant sensitivity to the interaction parameters. Despite this, the model describes satisfactorily the system behavior for the studied operating conditions, as shown in Table 4 for the relative errors between the reactor pressure and calculated pressure using the process model. In Table 4, the calculated pressures using the ideal gas model are also presented for comparison purposes, where it can be noticed a significant increasing in the relative error as the polymer concentration in the liquid phase increases, showing the importance of considering the polymer-species interactions.
In the second step, the propagation rate coefficient of the selected set of published kinetic parameters was re-estimated by using plant data in order to minimize the differences between the measured and calculated mass average molecular weight and conversion in the second reactor (where the plant data is available). The obtained kinetic constant for the propagation rate was:
kp= (6994 r 162) exp(-2600/T) , kg m-3s-1
In Table 5 the measured and calculated mass
average molecular weight and conversion in the second reactor are compared for three different products of each polymer grade, giving relative errors less than 5% and 7%, respectively. Before the parameter estimation, using data from Table 3, the relative errors were up to 15% for Mw and 22% for conversion.
Merging the kinetic and the thermodynamic models in the reactor model, the polymer properties and the reactor operating conditions were predicted for four different grades of resins. The main results of these simulations can be found in Figure 5, where two products of each grade are presented. Similar results were also obtained for formation of styrene dimer and trimer, density, viscosity, and tensile strength.
In Table 6, the relative errors of the simulation results are shown. The larger error observed in the MFI, Figure 5a, for the grade with lowest molecular weight (grade D) is attributed to the experimental error reported in the industrial laboratory for this grade. This assertion can be strengthened by the small error in the mass average molecular weight for that grade, Figure 5b. Satisfactory results were also obtained for the conversion, Figure 5c, Vicat temperature, Figure 5d, and other polymer properties.
Table 4: Reactor pressure relative errors (%): proposed model / ideal gas model.
First Reactor Second Reactor
Top Stage Bottom Stage Top Stage Bottom Stage
2.24 / -4.45 –1.16 / -6.19 –1.57 / -4.75 –0.59 / -21.58
–1.69 / -3.19 –2.80 / -6.03 –4.52 / -6.71 –2.36 / -24.59
–2.36 / -3.72 –4.39 / -6.81 –7.31 / -5.49 –5.50 / -21.16
–1.51 / -3.62 –5.13 / -6.23 –2.22 / -3.63 –1.12 / -31.33
3.28 / -1.82 0.49 / -5.66 4.35 / -5.60 9.22 / -33.02
3.17 / -3.89 –0.42 / -6.25 –0.04 / -5.59 6.97 / -27.04
0.40 / -4.17 –2.68 / -6.13 –2.47 / -5.25 0.50 / -25.52
–0.44 / -3.24 –3.80 / -5.90 –0.56 / -4.65 1.61 / -34.53
–4.24 / -3.25 –5.46 / -5.79 –1.96 / -5.28 0.69 / -33.53
0.63 / -2.27 –0.80 / -6.03 –2.45 / -6.55 –3.41 / -32.64
–2.89 / -3.14 –4.80 / -7.33 –3.12 / -5.78 –9.57 / -29.38
3.05 / -2.60 –1.20 / -6.96 –3.31 / -6.38 –3.14 / -39.15
–1.43 / -5.50 –3.48 / -7.19 –1.91 / -5.36 3.81 / -46.55
–0.50 / -2.72 –2.86 / -6.87 –0.26 / -5.71 7.02 / -51.87
2.79 / -2.11 0.71 / -6.90 –1.54 / -7.14 –0.09 / -39.35
–0.11 / -3.63 –2.83 / -7.44 –4.54 / -6.40 –7.64 / -32.92
–0.32 / -3.50 –3.31 / -7.11 –3.40 / -6.31 –7.74 / -34.62
1.35 / -3.60 –0.61 / -7.04 –2.52 / -7.07 –7.23 / -32.51
0.04 / -2.89 –2.43 / -7.33 –2.60 / -7.00 –4.25 / -40.42
1.71 / 3.33 2.60 / 6.59 2.67 / 5.82 4.34 / 33.24
Table 5: Comparative results for the second reactor using the estimated kPo
Product Mwexp x103 Mw x103 Error Xexp X Error
A 273.76 286.83 4.77% 64.6 65.63 1.59%
A 282.56 293.49 3.87% 66.1 64.04 3.12%
A 279.49 286.79 2.61% 63.7 63.86 0.25%
B 276.83 281.09 1.54% 64.1 63.02 1.68%
B 281.33 279.61 0.61% 65.5 64.23 1.94%
B 281.67 284.82 1.12% 67.3 64.73 3.82%
C 239.15 227.63 4.82% 66.0 61.94 6.15%
C 230.04 233.97 1.71% 65.1 63.04 3.16%
C 227.74 234.02 2.76% 65.9 63.08 4.28%
D 181.31 188.94 4.21% 66.1 63.50 3.93%
D 184.42 188.93 2.45% 67.0 65.74 1.88%
D 179.22 177.90 0.74% 66.6 64.12 3.72%
0.0 5.0 10.0 15.0 20.0 25.0
0 1 2 3 4 5 6 7 8 9
M
F
I (
g
/1
0
') Plant Predicted
(a) Melt flow index
100.0 150.0 200.0 250.0 300.0 350.0
0 1 2 3 4 5 6 7 8 9
M
w
(
D
al
to
n
x E
+
03
)
Plant Predicted
(b) Mass average molecular weight
35 40 45 50 55 60 65 70
0 1 2 3 4 5 6 7 8 9
Co
n
versi
o
n
(
%
)
Plant Predicted
(c) Conversion in 2nd reactor
80.0 85.0 90.0 95.0 100.0 105.0 110.0
0 1 2 3 4 5 6 7 8 9
Vi
c
a
t (°
C
)
Plant Predicted
(d) Vicat temperature
Figure 5: Model predictions versus industrial data of four grades of resins.
Table 6: Relative errors of the model predictions
point Grade Conv R2 MW R2 MFI Vicat
1 A 3.12 3.87 6.0 -0.9
2 A 0.25 2.61 15.6 -1.4
3 B 1.94 0.61 2.0 0.9
4 B 3.82 1.12 -4.3 1.1
5 C 3.16 1.71 6.0 -2.2
6 C 4.28 2.76 9.6 -2.9
7 D 1.88 2.45 -4.8 -1.3
348 A. S. Almeida, K. Wada and A. R. Secchi
CONCLUSIONS
The obtained kinetic model is particularly important in order to take into consideration the thermal initiation and the bi-functional initiator, as well as the transfer to sub-products like AH and the solvent. The thermodynamic model presented a significant sensitivity to the interaction parameters between the polymer and the other components and described satisfactorily the system behavior for the studied operating conditions. The mathematical model developed for the auto-refrigerated reactors was capable of predicting the main polymer properties and operating conditions with satisfactory accuracy.
ACKNOWLEDGMENTS
The authors would like to acknowledge the assistance given by the industrial board of INNOVA S.A., especially to Sergio de Oliveira Machado.
REFERENCES
Beckman, J., Design of Large Polymerization Reactors. Polymerization Kinetics and Technology, Advances in Chemistry Series 128; ACS Publisher, Washington, DC (1973).
Cabral, P. A., Melo, P. A., Biscaia Jr., E.C., Lima, E.L. and Pinto, J.C., Free-Radical Solution Polymerization of Styrene in a Tubular Reactor – Effects of Recycling, Polymer Engineering and Science, 43, n. 6, p. 1163-1179 (2003).
Cavin, L., Rouge, A., Meyer, Th. and Renken, A., Kinect Modeling of Free Radical Polymerization of Styrene Initiated by Bifunctional Initiator 2,5-dimethyl-2,5-bis(2-ethil hexanoyl peroxy)hexane, Polymer, 41, p. 3925-3935 (2000).
Chen, C., Continuous Production of Solid Polystyrene in Back-Mixed and Linear-Flow Reactors, Polymer Engineering and Science, 40, n. 2, p. 441-464 (2000).
Estenoz, D. A., Valdez, E., Oliva, H. and Meira, G.R., Bulk Polymerization of Styrene in Presence of Polybutadiene: Calculation of Molecular Macrostructure, Journal of Applied Polymer Science, 59, p. 861-885 (1996).
Flory, P. J., The Mechanism of Vinyl Polymerizations, Journal of the American Chemical Society, 59, n. 2, p. 241-253 (1937).
Freitas Filho, I. P., Biscaia Jr., E. C. and Pinto, J. C., Steady-State Multiplicity in Continuous Bulk
Polymerization Reactors – A general Approach, Chemical Engineering Science, 49, n. 22, p. 3745-3755 (1994).
Henderson III, L. S. and Cornejo, R. A., Temperature Control of Continuous, Bulk Styrene Polymerization Reactors and the Influence of Viscosity: An Analytical Study, Industrial and Engineering Chemistry Research, 28, p. 1644-1653 (1989).
Hui, A. W. and Hamielec, A. E., Thermal Polymerization of Styrene at High Conversions and Temperatures. An Experimental Study, Journal of Applied Polymer Science, 16, p. 749-769 (1972).
Kim, K. J. and Choi, K. Y., Modeling of Free Radical Polymerization of Styrene Catalized by Unsymmetrical Bifunctional Initiators, Chemical Engineering Science, 44, n. 2, p. 297-312 (1989). Louli, V. and Tassios, D., Vapor-Liquid Equilibrium
in Polymer-Solvent System with a Cubic Equation of State, Fluid Phase Equilibria, 168, p. 165-182 (2000).
Luyben, W. L., Temperature control of autorefrigerated reactors, Journal of Process Control, 9, p. 301-312 (1999).
Özkan, G., Hapoglu, H. and Alpbaz, M., Generalized Predictive Control of Optimal Temperature Profiles in a Polystyrene Polymerization Reactor, Chemical Engineering and Processing, 37, p. 125-139 (1998).
Mayo, F. R., Polymer Preparation., American Chemical Society, Div. Polym. Chem., 2, p. 55 (1961).
Moore, E. R., ed., Styrene Polymers, The Dow Chemical Company, Reprinted from Encyclopedia of Polymer and Engineering, vol. 16, p. 1-246, 2nd. Ed., John Wiley & Sons, Inc. (1989).
Peng, F. M., Polybutadiene Grafting and Crosslinking in High-Impact Polystyrene Bulk Thermal Process, Journal of Applied Polymer Science, 40, p. 1289-1302 (1990).
Pryor, A. and Coco, J. H., Computer Simulation of the Polymerization of Styrene. The Mechanism of Thermal Initiation and the Importance of Primary Radical Termination, Macromolecules, 3, n. 5, p. 500-508 (1970).
Russo, L. P. and Bequette, B. W., Operability of Chemical Reactors: Multiplicity Behavior of a Jacketed Styrene Polymerization Reactor, Chemical Engineering Science, 53, n. 1, p. 27-45 (1998).
Operational Performance Target: Autorefrigerated CSTR Polymerization Reactor, Computers and Chemical Engineering, 29, p.1447–1455 (2005). Villalobos, M.A., Hamielec, A.E. and Wood, P.E.,
Kinetic Model for Short-Cycle Bulk Styrene Polymerization through Bifunctional Initiators, Journal of Applied Polymer Science, 42,
p. 629-641 (1991).