Abstract
A human femur model, submitted to static loads, is analyzed through the utilization of three material constitutive relationships, namely: isotropic, transversally isotropic and orthotropic. The influence of bone anisotropy with respect to principal stress/strain distribution on human femur external surface was accessed through the use of analytical and finite element approaches. The models results show that the principal angles at a medial path bone surface have a good correlation with human femur bone lamellae angles.
Keywords
Bone anisotropy, principal stresses, principal strains, principal angles.
Bone Anisotropy – Analytical
and Finite Element Analysis
1 INTRODUCTION
Bone is a live tissue which is responsible for sustaining the human body. It can grow and self-repair. Bones are submitted to the action of the muscles loads and the gravity. Long bones, as femurs, for instance, provide stability and support for a person to remain standing or walking.
Many researches have been done in Biomechanics area. In order to position this paper along with the other bone anisotropy papers, a short overview of the Biomechanical works were provid-ed, freely classifying them in different areas/approaches. Among the papers that deal with the bone anisotropy, there are those that describe the structural bone details. These papers are
named here as micro/nano papers, as in Carnelli et al. (2013) and in Baumann et al. (2012).
Lucas Lisboa V ignoli a
Paulo Pedro Kenedi b
a
Department of Mechanical Engineering, Pontifical Catholic University of Rio de Janeiro, Rua Marques de São Vicente 225 - Gavea, Rio de Janeiro, RJ - CEP 22453-900 - Brazil.
b PPEMM - Programa de Pós-Graduação em Engenharia Mecânica e Tecnologia de Materiais - CEFET/RJ - Av. Maracanã, 229 - Maracanã - RJ - CEP 20271-110 – Brazil.
http://dx.doi.org/10.1590/1679-78251814
Latin American Journal of Solids and Structures 13 (2016) 51-72
Others papers only consider the macroscopic effects and are named here as macro papers, as it is
this manuscript. There are papers that use Finite Element software to model bone, named here as
numerical papers, as in Kenedi and Vignoli (2014), in San Antonio et al. (2012) like this
manu-script. Other papers use theoretical/analytical methodologies, as mechanics of solids, theory of
elasticity, homogeneization theory and so on. These papers are named here as analytical papers,
as in Toridis (1969) like this manuscript as well. Experimental approaches can be also used, through the utilization of sensors/transducers to measure diverse mechanical characteristics of bones, as for instance, to obtain better elastic material constants to describe such a complex
ma-terial as bone. These papers are named here as experimental papers, as in Allena and Clusel
(2014). Also there are papers that cover two or more areas; these papers are named here as
mul-ti-area papers.
This paper, Bone Anisotropy - Analytical and Finite Element Analysis, called for now on
ac-tual paper, is classified as a multi-area paper, which covers macro, analytical and numerical
are-as. The actual paper can be classified as a macro paper because it uses classical elastic material constants to describe a complex material as bones that although having a complex internal struc-ture, only utilize the summation of their mechanical effects. It can also be considered an analyti-cal paper because the actual paper uses the expressions obtained by theory of elasticity to de-scribe the principal stress/strain distribution and correspondent principal angles at a medial ex-ternal bone surface path. It can also be considered a numerical paper because it uses a finite ele-ment model as reference to the analytical one.
In this work, three constitutive relationships - orthotropic, transversally isotropic and isotropic - were used to estimate the principal stress/strain values and the correspondent principal angles,
on a path at medial external surface of a human femur, with the objective of verify if the Petrtýl
et al. (1996) and Cowin and Hart (1990) propositions that the principal stress angles at a medial
external surface of a human femur were compatible with the dominant osteonal direction.
There are many examples of the theory of elasticity applied to isotropic materials, as for in-stance, in Sokolnikoff (1956). For anisotropic materials, some important contributions are found in Lekhnitskii (1981) for general theory of elasticity, which is used as basis for this present ana-lytical model. As an improvement of the isotropic femur anaana-lytical stress analysis proposed by Kenedi and Riagusoff (2015) and of the FE analysis proposed by Kenedi and Vignoli (2014), this paper develops a stress and strain analysis of a human femur taking into account its natural ani-sotropy using expressions derived from the theory of elasticity Lekhnitskii (1981) and uses a FE software.
At next section, a short introduction to material anisotropy is presented, showing the differ-ences between the especially important constituve relations for this work: the isotropic, the trans-versally isotropic and the orthotropic.
2 MATERIAL ANISOTROPY
Bones, from a macroscopic point of view, can be classified as non-homogeneous, porous and
aniso-tropic tissue, Doblaré et al. (2004). At a human femur cortical and trabecular bone tissues can
Latin American Journal of Solids and Structures 13 (2016) 51-72
It is very difficult to obtain experimentally bone elastic mechanical properties. Some authors like
Taylor et al. (2002) have obtained orthotropic bone elastic properties indirectly, through the
uti-lization of modal analysis and Finite Element Method approaches. To overcome this difficulty authors like Jones (1998) and Krone and Schuster (2006) present different constitutive relation-ships to model bone behavior, among them, there are three constitutive relationrelation-ships that are especially important for this work: the isotropic, the transversally isotropic and the orthotropic.
The isotropic materials have only two independent mechanical elastic constants, the Young
modulus E and the Poisson ratio ν. The transversally isotropic materials have five independent
mechanical elastic constants, two Young modulli, one shear modulus and two Poisson ratios. The orthotropic materials have nine independent mechanical elastic constants, three Young modulli, three shear modulli and three Poisson ratios, Jones (1998).
These mechanical elastic constants are placed at the stiffness matrix S, which relates stresses
and strains. Hooke’s law can also be written in a different form using a compliance matrix C as
ejr =Cjrlm!
lm (1)
where ejr are the strain components, Cjrlm are the compliance matrix components and τlm are the
stress components. Note that e, C and τ are tensors.
The geometric compatibility and the equilibrium equations are represented, respectively, by equations (2) and (3)
e
lm=
1 2
!u
l
!x
m
+!
u
m
!x
l
" #$
%
&'
(2)
!! ij !x
j
+ fi =0 (3)
where u are the displacements, x are the coordinates and f are the body forces. Also note that
these equations can be expanded according to the coordinate system.
At next section the analytical model is described in details. The principal stresses and princi-pal strains expressions are explicitly presented as well as the correspondent principrinci-pal angles.
3 ANALYTICAL MODEL
For anisotropic materials the matricial strain-stress relation is presented in equation (1). For or-thotropic materials the compliance matrix can be simplified, as show explicitly in equation (4), Jones (1998):
C=
1
E
1
!!21
E
2
!!31
E
3
0 0 0
!!12
E
1 1
E
2
!!32
E
3
0 0 0
!!13
E
1
!!23
E
2 1
E
3
0 0 0
0 0 0 1
G
23
0 0
0 0 0 0 1
G
13 0
0 0 0 0 0 1
G
12
"
# $ $ $ $ $ $ $ $ $ $ $ $ $ $ $ $ $ $
%
& ' ' ' ' ' ' ' ' ' ' ' ' ' ' ' ' ' '
Latin American Journal of Solids and Structures 13 (2016) 51-72
Where, E1, E2 and E3 are, respectively, the Young modulli on directions 1, 2 and 3; G12, G13 and
G23 are, respectively, the shear modulli; ν12, ν13, ν21, ν23, ν31 and ν32 are Poisson ratios. Note that
to ensure the matrix symmetry, the condition !
i j Ei
(
)
= !j i Ej
(
)
must be satisfied.As mentioned previously, nine constants are necessary to characterize an orthotropic material, five for a transversally isotropic and just two for an isotropic material. The transversally isotropic material is a special case of orthotropy, where the material is isotropic along the cross section,
thus its independent constants are E1=E2,E3,!23=!13,!12 and G23=G13
.
Note thatG
12=E1
(
1+!12)
is an independent property. Another form of representing matricial stress-strainrelation is using stiffness componentsS, Jones (1998):
!
jr =Sjrlmelm (5)
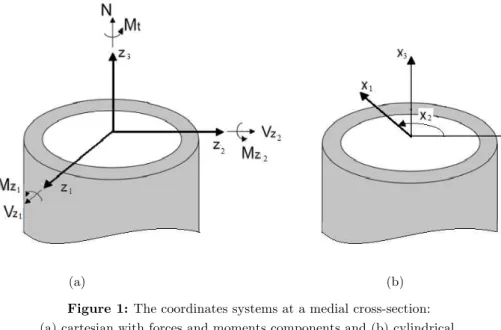
The analytical model presented in this work, Lekhnitskii (1981), has the following hypotheses: the model is applied to a hollow cylindrical bone; the body is orthotropic with the properties de-fined by a cylindrical coordinate system, where the mechanical properties are constant along each direction. Note that the internal loads and moments at a medial cross section centroid are repre-sented in a cartesian coordinate system. Figure 1 shows, at a medial cross section, the two coor-dinates system used in this manuscript: the cartesian and the cylindrical.
(a) (b)
Figure 1: The coordinates systems at a medial cross-section: (a) cartesian with forces and moments components and (b) cylindrical.
The internal loads and moments at a medial cross section centroid, represented at Fig. 1.a, can be obtained from the equivalent representation of the static loading positioned at the femur head region. See, for instance, the hollow circular bone model of Kenedi and Riagusoff (2015).
To get a solution for the stress and the strain field along the cylinder cross section, two stress
Latin American Journal of Solids and Structures 13 (2016) 51-72 ! 11= 1 x 1 !F !x 1 + 1 x 1
( )
2 !2F! x 2
( )
2 (6.a)! 22=
!2F
! x 1
( )
2 (6.b)! 12=!
"2F "x
1"x2 F x 1 # $% & '( (6.c)
!13=
1
x1
!"
!x2 (6.d)
!23=! "" "x
1
(6.e)
The stress !33 can be related to the other stress components using geometric compatibility,
presented in equation (2), or the identity, that can be verified by substitution, and is expressed in equation (7):
!2
! x
2
( )
2"x 1 ! !x 1 # $ % % & ' (
(e11+x1
!2
! x
1
( )
2 x1e22(
)
" !2
!x1!x
2
x1e12
(
)
=0 (7)With these stress functions, the identity and the equations presented previously, namely con-stitutive, geometric compatibility and equilibrium; it is possible to propose the stress distribution for each load: axial, bending, torsional and transversal shear, through the implementation of the boundary conditions Lekhnitskii (1981).
The axial force N applied on the cylinder has a triaxial state of stress as shown in equation
(8), where the radial normal stress must be zero on the free surface as there is no external pres-sure, Lekhnitskii (1981):
!11axial = Nh T 1!
1!"k+1
1!"2k x 1 R e " #$ % &'
k!1
!1!" k!1
1!"2k "
k+1 x1
R e " #$ % &'
!k!1 " # $ $ % & '
'
(8.a)
!22axial = Nh
T 1!
1!"k+1
1!"2k
k x1
R e " #$ % &'
k!1
+1!"
k!1
1!"2k
k"k+1 x1 R e " #$ % &'
!k!1
" # $ $ % & '
'
(8.b)
!33 axial
=NT !TCNh 3333
C
1133+C2233! 1!"k+1
1!"2k C
1133+kC2233
(
)
x1 R e " #$ % &'k!1
!1!" k!1 1!"2k
C
1133!kC2233
(
)
"k+1 x1 R e " #$ % &'!k!1
" # $ $ % & '
'
(8.c)
Where Re is the external radius, Ri is the internal radius,ρ= Ri/Re is the ratio between the
Latin American Journal of Solids and Structures 13 (2016) 51-72
At Appendix 1 it is defined the additional parameters h, T and k, that were created to get a
more compact expression presentation. At Appendix 2 is shown the error that occurs if it is con-sidered that the whole cross section has the same displacement, independent of the radial coordi-nates.
The stress distribution produced by the bending moment M in global coordinate z1 are,
Lekhnitskii (1981):
!
11
bend_z1
=
Mz
1Reg
K x1 Re ! "# $ %&'
1'!m+2
1'!2m
! "
# $
% & x1
R e ! "# $ %&
m'1
' 1'!
m'2
1'!2m
! "
# $
%
&!m+2 x1
R e ! "# $ %&
'm'1
( ) * * + ,
--sin
( )
x2(9.a)
!
22
bend_z1 =
Mz
1
Reg
K 3 x1 Re ! "# $ %&'
1'!m+2
1'!2m ! "
# $
% &
(
1+m)
x 1 R e ! "# $ %&
m'1 ' 1'!
m'2
1'!2m ! "
# $
%
&!m+2
(
1'm)
x 1 R e ! "# $ %&'m'1 ( ) * * + ,
--sin
( )
x2(
9.b)!
33 bend_z1
=! ! M z 1 K x
1sin
( )
x2" # $ %$ + Mz 1Reg
KC3333
(
C1133+3C2233)
x 1 R e & '( ) *+!1!!m+2
1!!2m
& '
( )
* + C
1133+
(
1+m)
C2233(
)
x1R e & '( ) *+
m!1
! ,
-. .
! 1!!
m!2
1!!2m
& '
( )
* +!m+2 C
1133+
(
1!m)
C2233(
)
x1R e & '( ) *+
!m!1/
0 1 1 2 3 $ 4$ sin x 2
( )
(9.c) ! 12 bend_z1=!
Mz 1Reg K x1 Re " #$ % &'!
1!!m+2
1!!2m
" # $ % & ' x 1 R e " #$ % &'
m!1
! 1!!
m!2
1!!2m
" #
$ %
&
'!m+2 x1 R e " #$ % &'
!m!1
( ) * * + ,
--cos
( )
x2 (9.d)Where m, g and K are additional parameters created to get more compact expressions and are
defined at Appendix 1. For the bending moment M applied on the global coordinate z2 the stress
expressions are, Lekhnitskii (1981):
!
11
bend_z2
=!
Mz
2Reg
K x1 Re " #$ % &'!
1!!m+2 1!!2m " # $ % & ' x 1 R e " #$ % &'
m!1
! 1!!
m!2
1!!2m " #
$ %
& '!m+2
x 1 R e " #$ % &'
!m!1
( ) * * + ,
--cos
( )
x2(10.a)
!22bend_z2=! Mz
1 Reg
K 3 x1 Re " #$ % &'!
1!"m+2
1!"2m " #
$ %
&
'
(
1+m)
x1 R e " #$ % &' m!1 ! 1!"m!2
1!"2m " #
$ %
&
'"m+2
(
1!m)
x1 R e " #$ % &'!m!1 ( ) * * + ,
--cos
( )
x2 (10.b)!
33
bend_z2
= !
Mz
2
K x
1cos
( )
x2 " # $ %$ + Mz 2Reg
KC3333
(
C1133+3C2233)
x 1 R e & '( ) *+!1!!m+2
1!!2m
& '
( )
* + C
1133+
(
1+m)
C2233(
)
x1R e & '( ) *+
m!1 ! ,
-. .
! 1!! m!2
1!!2m
& '
( )
* +!m+2C
1133+
(
1!m)
C2233(
)
x1R e & '( ) *+
!m!1/
Latin American Journal of Solids and Structures 13 (2016) 51-72 !
12 bend_z2
=
Mz 2
Reg
K x1 Re ! "# $ %&'
1'!m+2
1'!2m
! " # $ % & x 1 R e ! "# $ %&
m'1
' 1'! m'2
1'!2m
! "
# $
% &!m+2
x 1 R e ! "# $ %&
'm'1
( ) * * + ,
--sin
( )
x2(10.d)
The shear stress produced by torsional moment Mt is presented in equation (11) at global
coordinate z3, Lekhnitskii (1981). At Appendix 3 are shown the steps to reach it.
! 23 torsion = M t J x 1
(11)
Where J is the polar second moment of area. To compute the transverse shear effect, the
compo-nents Vz1 and Vz2 are summed vectorially. Geometrically, these relations can be written as
!=arctan
V z 1 Vz 2 ! " # # $ % & & (12.a) V
R = Vz
1
2+V
z
2
2
(
)
12 (12.b)The stress generated by the transverse forces VR in an orthotropic body can be estimated
as, Lekhnitskii (1965):
!
13
trans = VRg
KC3333 ! "# $ %& 1
1'!2n ! "
# $%& !
(
1'"2n)
x 12
'R e
'n+3
1'!n+3
(
)
x 1n'1
(
)*
)
{
'Ri n+3
1'!n'3
(
)
x1
'n'1+
, '
'!
p 1'!
2n
(
)
x1
m 'R
e m'n+1
1'!m+n+1
(
)
x1 n'1
(
)* 'Ri
m+n+1
1'!'m+n'1
(
)
x1
'n'1+
, ' '!n R
iRe
(
)
m+21'!2n
(
)
x1
'm 'R
e 'm'n+1
1'!' +n+1
(
)
x1
n'1
(
)* 'Ri
'm+n+1
1'!m+n'1
(
)
x1
'n'1+
,
}
sin(
x2+!)
(13.a)
!
23
trans = VRg
KC3333
! "#
$ %& ! 3x1
2
'nR
e
'n+31'!
n+3
1'!2n x
1 n'1
'nR
i n+31'!
n'3
1'!2n x
1
'n'1(
) * * + , -. / 0 10 +
+ C1133+C2233'
C3333
g
! "#
$ %&x1
2
'!
p 1+m
(
)
x1 m
'nR
e
m'n+11'!
+n+1 1'!2n
x
1 n'1
'nR
i
m+n+11'!' +n'1 1'!2n
x1'n'1
+ , -( ) * *' '!
n
(
RiRe)
m+2
1'm
(
)
x1
'm
'nR
e
'm'n+11'!' m+n+1
1'!2n
x
1 n'1
'nR
i
'm+n+11'! m+n'1
1'!2n x
1
'n'1
+ , -( ) * *' 'R e
'm+2 1'!
m+2
1'!2m
! "
# $
%
& C1133+
(
1+m)
C 2233+, ()x
1
m
'R
i
m+2 1'!
m'2
1'!2n
! "
# $
%
&+,C1133+
(
1'm)
C2233()x 1'm2
3 0 40
s x 2+!
(
)
(
13.b)Where n, α, αp and αn are constants created to reduce the expressions size and defined at
Appen-dix 1. Note that equations (13.a) and (13.b), for transversally isotropic and isotropic bodies, C2233
= C1133, and thus g = 0, so in turn α→ ∞, the stress distribution takes a simplified form that are
Latin American Journal of Solids and Structures 13 (2016) 51-72 !
13
trans_i =VR
I
! x 1
2!
!n+3 1!!
n+3
1!!2n " #
$ %
& 'x
1 n!1
!R
i
n+3 1!!
n!3
1!!2n " #
$ %
& 'x
1 !n!1
(
) * *
+
,
--sin
(
x2+!)
(14.a)
! 23 trans_i
=VR
I !
x
1 2
+! 3x
1 2!nR
e
!n+3 1!! n+3
1!!2n
" #
$ %
&
'x1n!1+nR i
n+3 1!! n!3
1!!2n
" #
$ %
& 'x
1
!n!1
(
) * *
+
, -(
) * *
+
,
--cos
(
x2+!)
(14.b)
Where I is the second moment of area, λ is a constant created to reduce the expressions size and
it is defined in Appendix 1. For this linear elastic study, the stress can be computed using the Superposition Method, Crandall (1978):
!11=!11axial +!11bendz_1
+!
11 bend
z_ 2
(15.a)
τ τ τ τ
22 22 22 22
1 2
= axial+ bendz_ + bendz_
(15.b)
! 33=!33
axial
+!
33 bendz
_1
+!
33 bendz
_ 2
(15.c)
!
12=!12
bnd
z_1 +!
12
bnd
z_ 2 (15.d)
!
13=!13
trans
(15.e)
!
23=!23
torsion
+!23trans
(15.f)
For a generic load, the stresses and strains can be analyzed in a 3x3 symmetric matrix. The eigenvalues and eigenvectors of these matrices have a special physical meaning: the eigenvalues are the principal stresses and principal strains and the eigenvectors are their respective angles. Mathematically, the eigenvalues are calculated as
!
i j!"#i j =0 (16)
e
i j!!"i j =0 (17)
Where σ and ε are the principal stresses and strains and δij is the Kronecker delta. Once the
ei-genvalues are obtained, the eigenvectors can estimated as
!
i j !"#i j
" #$
%
&'"# %&i =0 (18)
e ij !!"
i j "
#$
%
Latin American Journal of Solids and Structures 13 (2016) 51-72 !
1=
"
22+"33 2 +
"
22!"33 2
" #$
% &'
2 + "
23
( )
2(
) * *
+
,
-1 2
(20.a)
!
2=0 (20.b)
!
3=
"
22+"33 2 !
"
22!"33 2 " #$
% &' 2
+ "
23
( )
2 () * *
+
, -1 2
(20.c)
!1=e22+e33 2 +
e
22!e33 2
" #$
% &'
2 +
( )
e232
(
) * *
+
,
-1 2
(20.d)
!
2=e11 (20.e)
!
3=
e
22+e33
2 !
e
22!e33 2
" #$
% &'
2
+ e
23
( )
2(
) * *
+
,
-1 2
(20.f)
And the slope of the principal directions on the external surface are
!stress = 1
2
arctan 2!23 !33"!22
# $%
&
'( (21.a)
!strain= 1
2 arctan
2e
23
e
33"e22
# $%
&
'( (21.b)
Although the three principal strains are different of zero, there is no distortion caused by shear effect acting on the face perpendicular to the radial direction, thus the direction of the
mid-dle principal strain (ε2) coincides to the radial coordinate (x1) of Fig. 1.b.
At next section the Finite Element Model is presented, as well as the geometric constants, loads, material constants used to generate the example solved by both models analytical and F.E.
4 FINITE ELEMENT MODEL
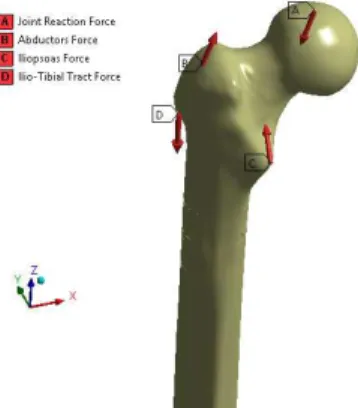
A numerical model was developed using the F.E. ANSYS software, through the utilization of a parasolid file of a human femur, that was obtained in a bone file repository, like Biomedtown (2015). The static loading is composed by the joint reaction force and three principal muscles forces, which are positioned at the femur head region, as shown at Figure 2, adapted from Taylor
Latin American Journal of Solids and Structures 13 (2016) 51-72 Figure 2: Human femur static loading model.
The bone distal region was fixed to ensure equilibrium requirements. To extract the results, one path, on a medial cross section along the bone external surface was created, as shown in Fig-ure 3.a. The purple arrow indicates the path orientation.
(a) (b)
Figure 3: (a) Path created to extract the results and (b) Mesh used on the F.E. simulations..
Figure 3.b shows the mesh used at the human femur bone. At medial section, where the path is located, the mesh was refined to access more accurate results. As the bone has a quite irregular shape, SOLID186 and SOLID187 elements were used, which exhibit a quadratic displacement behavior, and have twenty and ten nodes respectively, see Bathe (2007) and Lee (2012). As can be clear from Figure 3.b, the mesh was separated in three different parts: the medial region where the path was created, the proximal part (above the path) and the distal part (bellow the path).
Latin American Journal of Solids and Structures 13 (2016) 51-72
Joint reaction force P1(N) (–1,062; -130; -2,800) Abductors force P2 (N) (430; 0; 1,160) Iliopsoas force P3 (N) (78; 560; 525) Ilio-Tibial Tract force P4 (N) (0; 0; -1,200) P1 point of application A (mm) (50.7; -2.7; 133) P2 point of application B (mm) (-13.5; -6.5; 115) P3 point of application C (mm) (18.8; -29.3; 58.7) P4 point of application D (mm) (-24.6; -4.2; 83) cross section centroid (mm) (0.8; 2.4; -25) Re (external radius) (mm)* 15.5
Ri (internal radius) (mm)* 7.6
Table 1: Loading forces and geometric constants. (* approximate measure).
Note that P1 ,P2 ,P3 and P4 are applied, respectively, at points A, B, C and D of Figure 2.
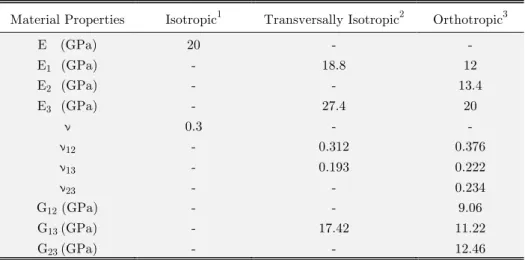
The range of cortical human femur bone mechanical properties on the literature is wide, which can be explained by the existing differences between people’s bones, as age, diseases, gender, if the bone specimen is fresh or frozen and so on. Table 2 shows the elastic mechanical properties obtained in technical literature, for the cylindrical coordinate system. Three bone material con-stituve relations are listed. Only the independent constants are represented (two for isotropic, five for transversally isotropic and nine for orthotropic).
Material Properties Isotropic1 Transversally Isotropic2 Orthotropic3
E (GPa) 20 - -
E1 (GPa) - 18.8 12
E2 (GPa) - - 13.4
E3 (GPa) - 27.4 20
ν 0.3 - -
ν12 - 0.312 0.376
ν13 - 0.193 0.222
ν23 - - 0.234
G12 (GPa) - - 9.06
G13 (GPa) - 17.42 11.22
G23 (GPa) - - 12.46
Table 2: Elastic mechanical properties.
1(Kenedi and Riagusoff, 2015), 2(Yoon and Katz, 1976) and 3(Korsa and Mares, 2012).
The numerical simulation was done with the use of orthotropic mechanical properties. The or-thotropic constitutive relationship represents the most general anisotropy case of used by analyti-cal and numerianalyti-cal models in this work. The isotropic and the transversally isotropic relationships can be modeled with the analytical approach proposed by Kenedi and Riagusoff (2015), or be also
Latin American Journal of Solids and Structures 13 (2016) 51-72
At next section both analytical and F.E. results are presented. The analytical model is used three times, one time with each constituve relations: the isotropic, the transversally isotropic and the orthotropic. The F.E. model only accesses the results for orthotropic approach.
5 RESULTS
In this section the results of the numerical F.E. model and the analytical model are shown. The
models results were presented in terms of principal stresses/strains, as well as, their respective principal angles, which are especially important to check if they can be related with human bone
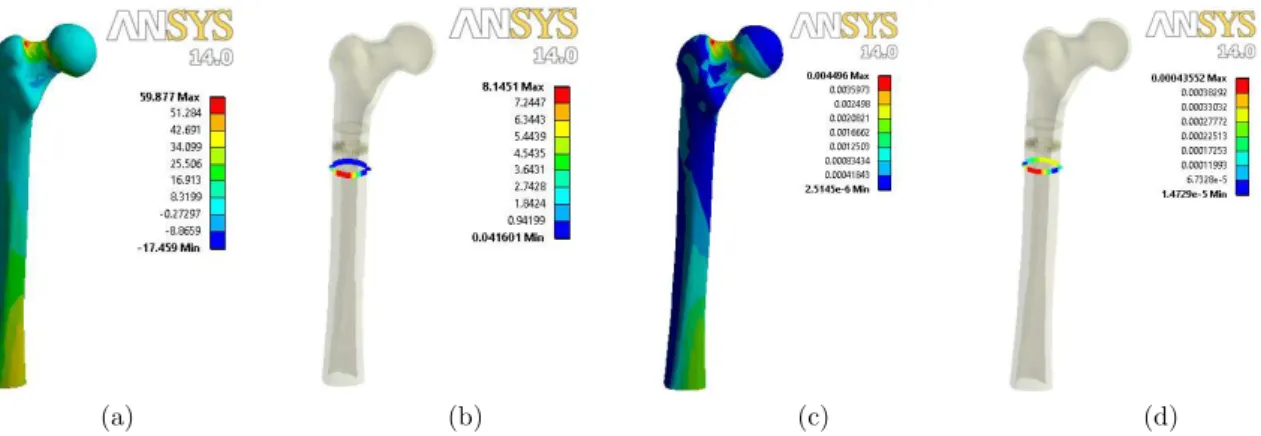
lamellae orientation, as in Petrtýl et al. (1996). Figure 4 shows the maximum principal stresses
(MPa)/strain (mm/mm) distribution for orthotropic human femur cortical tissue.
(a) (b) (c) (d)
Figure 4: Orthotropic cortical tissue: Maximum principal stresses distribution at: (a) external surface and (b) path; Maximum principal strain distribution at: (c) external surface and (d) path.
Note that using path approach, 0°≤ 0 ≤360°, it makes possible to access a more useful results
presentation. To validate the analytical model, as well as the hypotheses adopted, the results of the principal stresses and strains for both analytical and numeric models are plotted together at Figure 5. Note that it was utilized the more generic case of anisotropy covered by this work, the orthotropic one, for both analytical and numeric (F.E.) models.
(a) (b)
Latin American Journal of Solids and Structures 13 (2016) 51-72
Where the σ indexes 1, 2 and 3 refer to the maximum, intermediate and minimum principal
stress/strains. Figure 5 shows that the geometry simplification assumed during the analytical approach do not affected significantly the analytical model performance when compared to the numerical approach. Indeed the analytical model performance can be considered quite acceptable.
The elastic mechanical properties presented in Table 2 are used to compare the effect of the level of anisotropy for the principal stress and strains distributions at the medial external bone surface path, respectively at Figures 6 and 7.
(a) (b)
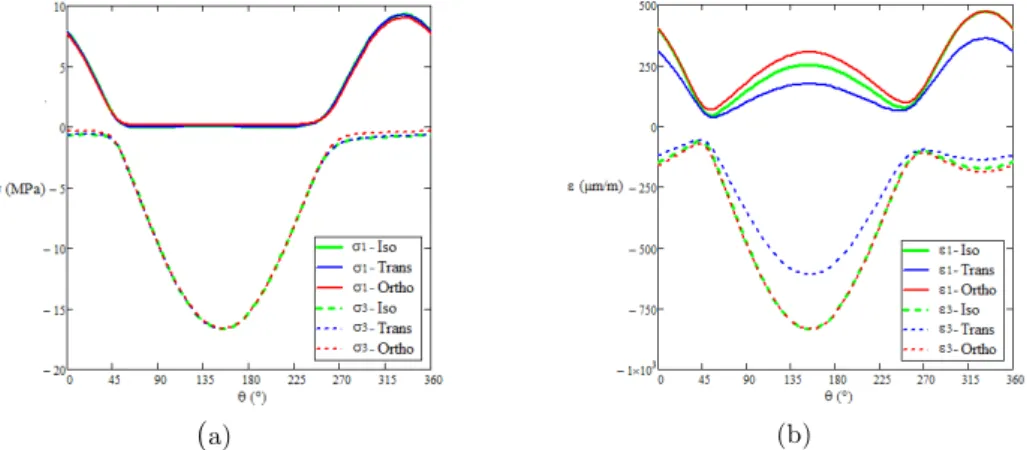
Figure 6: Analytical model results, at a medial external bone surface path, for three different constitutive relations, for principal (a) stresses and (b) strains.
Where Iso, Trans and Ortho represent, respectively, the isotropic, the transversally isotropic and the orthotropic constitutive relations used by the analytical model. Note that the path is along a free external surface, thus the intermediate principal stresses are always null.
At Figure 6, the principal stresses values are almost coincident for all the constitutive relations used by the analytical model, while the principal strains distribution, presents observable differ-ences between curves.
Figures 7.a and 7.b show, respectively, the principal stress and strains angles at the medial bone external surface path for the three constitutive relationships covered in this work.
(a) (b)
Figure 7: Analytical model results, for three constitutive relations, at a medial external
Latin American Journal of Solids and Structures 13 (2016) 51-72
At Fig. 7 the gray band represents the experimental results related by Petrtýl et al. (1996) for
the experimental slope of bone lamellae range. Also Fig. 7 shows two path angles, around θ =45°
and θ = 260°, where there are a vertical asymptotic behavior for both, stress and strain angles. The
analytical results shown at Figure 7 revels that the principal stress angles (Iso) and (Trans) have very similar behaviors, while (Ortho) has a noticeable difference. For principal strain angles, their behaviors are all slightly different.
At Fig. 6 the principal stress and strains are close to zero at path angles θ = 45° and θ = 260°,
which are where, at Fig. 7, the abrupt changes for both stress and strain angles occur. In these regions there is a remarkable bone lamellae angle change that apparently corresponds to the limit
of two opposite helical osteon systems, Petrtýl et al. (1996).
At next section the results obtained in this section are commented in a more complete way, stressing the principal results obtained in this research.
6 DISCUSSION
As mentioned previously, and commented more detailed by Bayraktar et al. (2004), the
meas-urement of bone properties is a difficult task, due to its huge dependence of conservation sample characteristics, irregular geometry, non-homogenous material distribution and anisotropy. Never-theless, using a macroscopic approach it is possible to model the complex bone mechanical behav-ior through the utilization of an orthotropic approximation, which can be classified, as proposed at Introduction Section, as a macro paper.
This approach has the advantage of considering the implicit non-uniform density distribution along the thickness, recognizing the elastic mechanical properties variation according to the direc-tion analyzed. See also Cowin (2001).
At Fig. 5 the principal stress and strain analytical and numeric results are compared, at a me-dial external bone surface path, for orthotropic constitutive relationship. The analytical model results show a good match with numerical model, used here as reference. Fig. 6 compares the analytical model principal stresses/strains results, at a medial external bone surface path, using the three constitutive relationships adopted: orthotropic, transversally isotropic and isotropic. The principal stress results revealed to be are quite close, whereas the principal strains showed some perceptible differences.
The proposed model, based in theory of elasticity, see Lekhnitskii (1981), has proven to be consistent to analyze orthotropic materials but rather laborious to be applied. For isotropic mate-rial a simpler model, based in solid mechanics, proposed by Kenedi and Riagusoff (2015) can be also used. Nevertheless both models demand the aid of mathematical software, as Mathcad.
The analytical model, using the three constitutive relationships, showed a similar performance for principal stress distribution. For principal strain distributions there were some diferences. The
principal stress angles (ϕstress) and the principal strain angles (ϕstrain), inside the path angles 45°≤
θ ≤ 260° agrees with the bone lamellae angles range related by Petrtýl et al. (1996), between -12º
and +12º. Outside the path angles 45°≤ θ ≤ 260°, there are no match with bone lamellae angles
Latin American Journal of Solids and Structures 13 (2016) 51-72
7 CONCLUSION
The objective of this paper is to propose an analytical model using an anisotropic theory of elas-ticity, Lekhnitskii (1981), applied to biomechanical tissues, to check if there is a correlation be-tween bone lamellae angles and principal stresses angles. The analytical model describes the prin-cipal stress/strain effect of axial and transversal forces, bending and torsion moments in a human femur medial cross section. The presented model was developed for orthotropic materials and can also be applied to transversally isotropic and isotropic materials as particular cases.
A finite element simulation with real femur geometry, submitted to the same load case of ana-lytical model, was carried out to validate the anaana-lytical model and their assumptions about the bone irregular geometry. To validate the model, only the orthotropic case was simulated. The path, at a medial external surface of a human femur, was used to obtain the principal stress and strains distribution as well its respective principal angles.
The range of principal stress angles (ϕstress) and principal strain angles (ϕstrain) values remain
inside the shaded area, limited by -12º and +12º angles of Fig. 7, only for path angles θ between
45° and 260°, where the principal stresses has their most negative values. This behavior is
com-patible with dominant osteonal range angles experimentally obtained by Petrtýl et al. (1996).
Outside the path angles θ between 45° and 260° occurs an abrupt change of both stress and
strain angles. In these regions have a remarkable bone lamellae angle change and apparently
cor-respond to the limit of two opposite helical osteon systems, Petrtýl et al. (1996). In this region
the principal stress and strain angles reached up to angles that ranged from -40° to +40°.
The results show that it is important to take into account significant differences, mainly in
principal strains values and principal strain angles, associated to the level of anisotropy of long bones cortical tissues. For a future work, the fatigue evaluation caused by dynamic load will also be taken into account.
References
Allena, R. and Cluzel, C. (2014). Identification of anisotropic tensile strength of cortical bone using Brazilian test. Journal of the mechanical behavior of biomedical materials, 38: 134-142.
Bathe, K. J. (2006). Finite Element Procedures, Prentice Hall.
Bayraktar H.H., Morgan E.F., Niebur, G.L., Morris, G.E., Wong, E.K., Keaveny, T.M. (2004). Comparison of the elastic and yield properties of human femoral trabecular and cortical bone tissue. J. Biomech, 37: 27-35.
Baumann, A.P., Deuerling, J.M., Rudy, D.J., Niebur, G.L. , Roeder, R.K. (2012). The relative influence of apatite crystal orientations and intracortical porosity on the elastic anisotropy of human cortical bone. J. Biomech, 45: 2743-2749.
Carnelli, D., Vena, P., Dao, M., Ortiz, C., & Contro, R. (2013). Orientation and size-dependent mechanical modu-lation within individual secondary osteons in cortical bone tissue. Journal of The Royal Society Interface, 10(81), 20120953.
Cowin, S.C. (2001). Bone Mechanics Handbook, Second Edition, CRC Press.
Cowin, S.C. and Hart, R.T. (1990). Errors in the orientation of the principal stress axes if bone tissue is modeled as isotropic, J. Biomech., Technical Note, (23), issue 4, pp. 349-352.
Latin American Journal of Solids and Structures 13 (2016) 51-72
Doblaré, M., García J. M. and Gómez, M. J. (2004). Modeling bone tissue fracture and healing: a review, Engi-neering Fracture Mechanics, (71), pp. 1809-1840.
https://www.biomedtown.org/biomed_town/LHDL/Reception/datarepository/repositories/BelRepWikiPages/TheSt andardizedFemurSolidModel. Accessed 12 August 2015
Jones, R.M. (1998) Mechanics of Composite Materials, Second Edition, Taylor & Francis Editions.
Kenedi, P.P., Riagusoff, I.I.T.(2015). Stress development at human femur by muscle forces, J Braz. Soc. Mech. Sci. Eng.,37(1), pp. 31-43..
Kenedi, P. P., Vignoli, L. L. (2014). Bone Anisotropy Influence - A Finite Element Analysis. In XXIV Brazilian Congress on Biomedical Engineering–CBEB
Korsa, R., Mares, T. (2012). Numerical Identification of Orthotropic Coefficients of the Lamella of a Bone’s Oste-on, Bulletin of Applied Mechanics, 8(31), pp. 45-53.
Krone, R. and Schuster, P. (2006). An Investigation on the Importance of Material Anisotropy in Finite-Element Modeling of the Human Femur, SAE International, 2006-01-0064.
Lee, H. H. (2012). Finite Element Simulations with ANSYS Workbench 14, SDC Publications. Lekhnitskii, S.G. (1987). Anisotropic Plates, Third Edition, Gordon and Breach Science Publishers. Lekhnitskii, S.G. (1981). Theory of elasticity of an anisotropic body, Mir.
Lekhnitskii, S.G. (1965). Theory of elasticity of an anisotropic elastic body, Holden-Day Series in Mathematical Physics.
Petrtýl, M., Herf, J. and Fiala, P. (1996). Spatial Organization of the Haversian Bone in Man, J. Biomech., (29), No. 2, pp. 161-169.
Raftopoulos, D.D., Qassem, W., (1987). Three-Dimensional Curved Beam Stress Analysis of the Human Femur. J. Biomed. Eng, Vol. 9, October, pp. 356-366.
Ramos A., Simões J.A. (2006). Tetrahedral versus hexahedral finite elements in numerical modelling of the prox-imal femur. Med Eng Phys 28:916–924.
Rudman K.E., Aspden R.M., Meakin, J.R. (2006). Compression or tension? The stress distribution in the proxi-mal femur. Biomed. Eng. 5(12):1-7.
San Antonio, T., Ciaccia, M., Muller-Karger, C. , Casanova, E. (2012). Orientation of orthotropic material prop-erties in a femur FE model: A method based on the principal stresses directions. Medical engineering &Physics, vol. 34, pp.914-919.
Sih, G.C., Paris, P.C., Irwin, G.R. (1965). On cracks in rectilinearly anisotropic bodies, International Journal of Fracture Mechanics, Volume 1, Issue 3, pp 189-203.
Sokolnikoff, I. S. (1956). Mathematical Theory of Elasticity, Second Edition, McGraw-Hill Book Company.
Taylor, W.R., Roland, E., Ploeg, H., Hertig, D., Klabunde, R., Warner, M.D., Hobato, M.C., Rakotomanana, L. and Clift, S.E. (2002). Determination of orthotropic bone elastic constants using FEA and modal analysis, J. Biomech., (35), pp. 767-773.
Taylor, M.E., Tanner, K.E., Freeman, M.A.R. and Yettram, A.L. (1996). Stress and strain distribution within the intact femur: compression or bending?, Med. Eng. Phys., vol. 18, pp. 122-131.
Toridis, T.G., (1969). Stress Analysis of the Femur. J. Biomech., vol. 2, , pp. 163-174.
Latin American Journal of Solids and Structures 13 (2016) 51-72
APPENDICES
Appendix 1
The analytical model constants to transform the original equations proposed by Lekhnitskii (1981) into a more compact form:
g = C2233!C1133
!1111+2!1122+2!1212!3!2222
(I.1)
(I.2)
k = !1111 !1122
! "#
$ %&
1 2
(I.3)
K =!Re
4
4
1!"4
(
)
!!Re4
g C3333
1!"4
(
)
C1133+3C22334 !
1!!m+2
(
)
21!!2m
C1133+
(
1+m)
C2233m+2
"
#
$ %
& ' ! (
) * * *
!
1!!m!2
(
)
21!!2m !
4 C1133+
(
1!m)
C2233m!2
" #
$ %
& ' +
,
(I.4)
I = !
R
e
4
4
!
"
# $
%
&
(
1'!4)
(I.5)m= 1+!1111+2!1122+2!1212
!2222
! "#
$ %&
1 2
(I.6)
n=
C
1313
C2323
! "#
$ %&
1 2
(I.7)
T =!Re2
(
1!"2)
+2!hRe2
C
3333
1!"2
2
(
C1133+C2233)
!1!!k+1
(
)
2C1133+kC2233k+1 !
"
# $ $
!
(
1!!k!1)
2
!2C1133!kC2233
k !1
%
& '
(I.8) h= C −C
−
2233 1133
1111 2222
Latin American Journal of Solids and Structures 13 (2016) 51-72 !=1
2
C
3333 3C
2233!C1133+6C2323
)
g +
9"
2222!"1111
(
)
"
# $ $
%
& ' '!
6C
2323
(
C1133+3C2233)
9C2323!C1313
(I.9)
!n =
1
2 1!m
(
)
2"2222!"1111" #$
%
&'C3333!2 1
(
!m)
C2323"#C1133+(
1!m)
C2233%& 1!m(
)
2C2323!C1313
R e
m!2
!Rim!2
R
e 2m
!R
i 2m
(
)
* +
,
- (I.10)
!p =1
2 1+m
(
)
2"2222!"1111" #$
%
&'C3333!2 1
(
+m)
C2323"#C1133+(
1+m)
C2233%& 1+m(
)
2C2323!C1313
R
e m+2
!R
i m+2
R
e
2m !R
i
2m
(
)
* +
,
- (I.11)
!ijkl =Cijkl !
Ckl33Cij33
C3333
(I.12)
!=3C2323!2C1133 9C
2323!C1313
(I.13)
Where β is a reduced compliance matrix.
Appendix 2
The traditional formulation for a prismatic isotropic body subjected to axial load at cross section centroid, for a cross section sufficiently far away for axial force application (Saint-Venant’s Prin-ciple) considers that the whole body cross section has the same displacement. For a prismatic orthotropic body this is not true. This appendix uses the theory developed by Lekhnitskii (1981) to show this point.
For an orthotropic hollow cylinder, using a combination of the geometrical compatibility and constitutive relations, the following equations can be written, considering the Figure 1.b cylindri-cal coordinate system:
!
1
!
1
=C1111!11+C1122!22+C1133!33 (II.1.a)
1
x
1
!u
2
!x
2 +u1
x
1
=C
2211!11+C2222!22+C2233!33 (II.1.b)
!
3
!
3 =C
Latin American Journal of Solids and Structures 13 (2016) 51-72
1
2 1
x
1
!u
3
!x
2
+!u2
!x
3 "
#$
%
&'=C2323!23 (II.1.d)
1
2
!u1
!x3+
!u3
!x1
" #$
%
&'=C1313!13
(II.1.e)
1 2
1
x
1
!u
1
!x
2
+!u2
!x
1
"u2
x
1
# $%
&
'(=C1212!12 (II.1.f)
If the loading is distributed equally on the cross section, the stresses distribution can be written as:
!
11=0 (II.2.a)
!22=0 (II.2.b)
!33= N
A (II.2.c)
!23=0 (II.2.d)
!
13=0 (II.2.e)
!
12=0 (II.2.f)
Substituting equation (II.2) into equation (II.1), generates:
!u 1 !x
1 =C
1133
N
A (II.3.a)
1
x 1
!u
2
!x
2 +u1
x 1
=C
2233
N
A (II.3.b)
!u
3
!x3=
C 3333
N
A (II.3.c)
1 2
1
x
1
!u
3
!x
2 +!u2
!x
3
" #$
%
&'=0 (II.3.d)
1 2
!u
1 !x
3
+!u3
!x
1 "
#$
%
Latin American Journal of Solids and Structures 13 (2016) 51-72
1
2 1
x 1
!u 1
!x 2
+!
u 2
!x 1
"u2 x
1
# $%
&
'(=0 (II.3.f)
Integrating the equations (II.3.c), (II.3.d) and (II.3.e):
u1=C1133N
A x1+U1 (II.4.a)
u
2=
(
C2233!C1133)
N
A x
1x2+U2 (II.4.b)
u
3=C3333
N
A x
3+U3x1 (II.4.c)
Where U1, U2 and U3 represent the rigid body motion. As an axial force means an axisymmetric
load condition on the cylinder the strains and displacements also must be axisymmetric, thus
cannot be a function of the tangential coordinate x2, as equation (II.4.b). Because of this, the only
condition wherein the load is equally distributed on the cross section is if (C2233-C1133) is equal to
zero, what implies that ν32 is equal to ν31, which characterize that the material must be isotropic
or transversally isotropic.
Appendix 3
In this appendix is provided an alternative way of presenting the torsion formulation, originally done by Lekhnitskii (1981). The stress functions presented in (6) of Section 3 are used and con-sidering that the load is axisymmetric:
!
11= 1 x
1
!F
!x
1
(III.5.a)
!
22=
!2F
! x 1
( )
2 (III.5.b)!12=0 (III.5.c)
!
13=0 (III.5.d)
!23=!
""
"x 1
(III.5.e)
τ33 is not directly associated with the stress functions but has a relation that can be obtained
using the geometrical compatibility, constitutive relation and the identity presents in equation (7). Thus, to obtain the complete solution of the stress distribution in an orthotropic cylinder
under torsion, it is necessary find the solution of three different functions: F, ψ and τ33. Applying
Latin American Journal of Solids and Structures 13 (2016) 51-72
!u1
!x1= C
1111 1
x1
!F
!x1
" #$
% &'+C1122
!2
F
! x
1
(
)
2 " # $ $ % & ''+C1133!33 (III.6.a)
1 x 1 !u 2 !x 2 +u1
x
1
=C2211 1
x 1 !F !x 1 " #$ % &'+C2222
!2
F
!
(
x1)
2" # $ $ % & '
'+C2233!33 (III.6.b)
!u3
!x3 = C 3311 1 x 1 !F !x 1 " #$ % &'+C3322
!2
F
! x
1
(
)
2" # $ $ % & '
'+C3333!33 (III.6.c)
1 2 1 x 1 !u 3 !x 2
+!u2
!x
3
" #$
%
&'=C2323 (
!! !x 1 " #$ % &' (III.6.d) 1 2 !u 1 !x 3 +! u 3 !x 1 " #$ %
&'=0 (III.6.e)
1
2 1
x
1 !u1 !x
2
+!u2
!x 1
"u2 x
1 #
$%
&
'(=0 (III.6.f)
Remembering that all the derivatives in relation to x2 must be zero and integrating the
equa-tions (III.6.c), (III.6.d) and (III.6.e)
u
3= C3311 1
x1
! !x1
" #$
% &'+C3322
!2 !x 1 2 " # $ % & '+C
3333
( )
!33( ) * * + ,
-.
x 3 (III.7.a)u2= C2323 2!! !x 1 " #$ % &'
(
dx3 (III.7.b)u
1= !
"u 3 "x 1 # $% & '(
)
dx3 (III.7.c)Finding u1 from equation (III.6.b)
u
1=C2211 !F !x1 " #$
%
&'+C2222 x1 !2
F
!
(
x1)
2 " # $ $ % & 'Latin American Journal of Solids and Structures 13 (2016) 51-72
It is possible to solve equations (III.7.a) and (III.7.c) to find u1:
C2211
! !1 " #$
%
&'+C2222 1
!2
!
(
1)
2 "# $ $
%
& '
'+C2233
(
1!33)
==(
)
C3311 (1
1 2
! !1+
1
1
!2
!12
"
#
$ %
& '+C3322
!3
! 13
"
#
$ %
& '+C3333
!!
33
!1 " #$
% &'dx3
*
+ , ,
-. / /dx3
)
(III.9)
From equation (III.9), it possible to conclude that the only solution for this equation is when
the right side of the equation is equal to zero because the left side cannot be a function of x3,
then e33 = 0, which results that the right side is also null, or e22=0. Using the identity presented
in equation (7) and some algebraic manipulations lead to:
!e
11
!x
1
=2!e22
!x
1
+x
1
!2e
22
!x
1
2 (III.10)
As e22 = 0, as discussed above, ∂e11/∂x1=0 to follow the identity introduced by equation (7),
which is represented in a simplified form at equation (III.10). It is possible to realize the
substitu-tion of the strain e11, obtained in (III.6.a), into (III.10) that the only possible solution is F =τ33
=0. Replacing (III.7.b) in (III.6.f)
2C
2323
!2 !
!x
1 2 "
1
x
1
!!
!x
1
#
$
% &
' (
)
dx3=0 (III.11)
Where the solution of this differential equation is
! =K
1
(
x1)
2+K2! (III.12)
Note that stress is proportional to!!
!x
1
, thus only one boundary condition is necessary, the value
of K2 is not necessary. Using the equilibrium condition
!
23x1
!
A=t (III.13)
Thus
1= M
t
J (III.14)
Where J =!
2 R
e
4!R
i
4
(
)
is polar second moment of area, what means that the stress distribution isequal to that one for isotropic cylinders.