DOI: 10.5433/1981-8920.2015v20n2p214
BIBLIOGRAPHY, METRICS AND DATA
VISUALIZATION:
HOW MAY WE COMPOSE
SHARED CONTEXTS OF INFORMATION?
BIBLIOGRAFIA, MÉTRICAS E VISUALIZAÇÃO DE
DADOS
Marina Boechat – [email protected] Doutora em Comunicação e Cultura pela Universidade Federal do Rio de Janeiro (UFRJ).
RESUMO
Introduction: We understand that the careful labor of composing bibliographical contexts is a fundamental concern for Bibliography, and collaborates to develop a deeper understanding of the intertextuality between documents. Nevertheless, the idea of context can assume many inflexions, connected to varied approaches towards bibliographic material. We believe quali-quantitative methods and data visualization can be used for assembling bibliographical contexts to form renovated points of view.
Objective: To discuss how the idea of context relates to bibliographic methods, and how quali-quantitative methods and data visualization may offer new possibilities for assembling, assessing and sharing contexts of information.
Methodology: Bibliographical revision, case discussion. We intend to apply concepts bred from the digital methods of social research to the problems of Bibliography, while we discuss the advantages of visualization.
Results: Quali-quantitative methods may advance bibliographical studies by proposing varied entry points and a bottom-up approach towards building context, while data visualization may display these contexts, giving new visibility to intertextual aspects.
Conclusions: The seminar Arte da Bibliografia, that took place last December in Rio de Janeiro, organized by IBICT/COEP and research group Ecce Liber, proposed a rediscovery of Bibliography as a science, born beside medieval studies and growing into a wider field. In this article, we seeked to outline some fundamental concerns of the field in order to update its relevance to today’s informational landscape. One fundamental concern of bibliography that we chose to focus on, the emphasis in creating knowledge contexts from documents, was explored in the form of different postures or procedures that may equip Bibliography, conciliating in its major facets, textual Bibliography and the quantitative tools derived from bibliometrics, with the use of quali-quantitative methods.
Marina Boechat
Bibliography, metrics and data visualization: how may we compose shared contexts of information?
1 INTRODUCTION
We understand that the careful labor of composing universes of knowledge in bibliographical contexts is a fundamental concern for Bibliography, either in a textual critique approach or in bibliometrics (FONSECA, 1979), collaborating for tracking the evolution of bibliographic material. The emphasis on this concern for context is, from our point of view, one of the characteristics that differentiate Bibliography from its sister sciences, like archivology or biblioteconomy. In this article we discuss the idea of context as it may relate to bibliographical material and explore some uses of quali-quantitative methods and data visualization for its analysis. We advance that these may propose new ways of composing bibliographical contexts for access and analysis, thus renovating the field.
First, we propose three approaches for the idea of context: it may point to the past when we search for the origins of the text as an artifact, of its fabrication and modifications; it may also point to the future, as in the context of use and circulation, and how it relates to many related institutions and actors, to other texts; and, finally, it can point to the very entrails of the text and to the discussion that is proposed in any bibliographical collection, its intertextuality.
Marina Boechat
Bibliography, metrics and data visualization: how may we compose shared contexts of information?
on the other side, to aggregated statistical analysis, much visibility for averages and, again, classifications, rather than relations and exchanges that compose intertextuality. These last may not involve a linear and critical reading of the content, but nevertheless, we believe we should pay closer attention to what some methods based on data analysis may offer in terms of proposing new entry points to the context that is formed by the texts. Visualization is key in this process, for building maps and aggregated visual contexts that may enrich the traditional experience with bibliographic material.
2 BIBLIOGRAPHICAL CONTEXT, INTERTEXTUALITY AND QUALI-QUANTITATIVE METHODS
Marina Boechat
Bibliography, metrics and data visualization: how may we compose shared contexts of information?
On the other hand, Fonseca describes the field of Bibliometrics as yet another kind of research that adds to the status of Bibliography as a science: the application of statistics to bibliographic material, that brings Bibliography close to scientometrics. According to him, such methods can be classified into microbibliography or macrobibliography. The first would be represented in the study of articles through citations, cross-references etc: small components of documents. The second would be like a census of national bibliographies.
So bibliographic research stands between a concrete science of statistical textual census, aiming at its distribution and quantitative evolution, and a historiographical, critical approach in textual bibliography. In a sense, both strands of Bibliography pay close attention to discrete aspects of documents, like the tiniest variations on typesetting or in term usage, from one copy to the other. Also, while both consider documents themselves as relatively stable and well-defined objects, their major concern stands in between documents: comparisons that layout transformations and evolutions. Therefore, we realize that procedures that may enable scholars to map intertextual relations are crucial for the bibliographical sense of context: tracking the evolution of related documents reveals aspects of the underlying and intertextual discussion that goes on between documents, and that guides the bibliographic sense of context.
Marina Boechat
Bibliography, metrics and data visualization: how may we compose shared contexts of information?
interactions, so they display the stabilized results, not the processes by which social forms emerge and are reinforced.
According to the authors, in the early days of Sociology, statistics came as a revolutionary tool, because, by calculating averages, probabilities and estimates, social scientists could now describe social structures, project and intervene. Nevertheless, this created an artificial separation between the micro level of the interactions and the macro level of the structures, and the demand for formulae that would explain how one level influenced the other. Also, a separation between the micro level, that could be studied by means of qualitative methods of research, and the macro level, that demanded a quantitative approach.
In societies that are heavily mediated by information and communication technologies, we come to a culture of the commentary (JOHNSON, 2001), where the conversation that was always present between different works, in the form of influences, references and appropriations, becomes more visible but, at the same time, there is a hyperproduction of documents, and those tend to be less compliant to disciplinary knowledge and classic hierarchical categorization. Therefore, there is a growth in the demand, not only for filters, but specially for instruments that might mediate the access to available data and might work as interfaces to organize information. Answers to this concern are developed in fields such as information sciences, human-computer interaction, communication and media studies, among others.
Marina Boechat
Bibliography, metrics and data visualization: how may we compose shared contexts of information?
social phenomena, something that was impossible before the existence and wide distribution of digital technologies.
We believe that Bibliography, while focusing on comparative analyses of textual devices and seeking to organize their evolution, faces a similar problem and may profit from a similar shift. We have textual bibliography as a branch of qualitative inquiry, and bibliometrics as the quantitative counterpart. Both rely on approaches that do not render intertextuality visible in a broader sense, and might be missing some very interesting views on the interactions that actually produce the evolution of bibliographical material. Of course, broader social interactions are not the scope of Bibliography, but we believe that describing the evolution of bibliographical documents and comparing them would be a much richer activity if those were considered more like traces and stabilizations of a broader intertextual discussion. In this case, it might lead to an approximation of the two strands of textual Bibliography and bibliometrics and, specially, to widening the range of the intertextual aspects to be explored: Bibliography could include the effects of the circulation of the documents in its radar, in terms of commentary, reinterpretations etc.
Marina Boechat
Bibliography, metrics and data visualization: how may we compose shared contexts of information?
that should be followed in order to assemble a coherent bibliographical context.
This takes us to another important issue: in an age where a multitude of channels give unparalleled access to information, the ways in which the idea of context is translated into practices has been going through some changes. We believe that the quest for stable and totalizing representations recedes into the background, because the whole of the informational sphere exceeds our cognitive capacities and it is always shifting. Börner and Polley (2014), for example, refer to a study where it was found that, as the internet grew and more cutting-edge scientific papers became available online, a group of scholars from an American university started citing more from their own community than from all the many available sources online. So, just when we expected that the internet would cross geographic barriers, scholars tended to reinforce local ties. Likewise, context, rather than overarching order, becomes central nowadays.
We believe that Bibliography offers a very important view into this matter, because its tradition has always dealt with building aggregated contexts of knowledge, even if in different perspectives. In the discussion that follows we will highlight some aspects of the idea of context, while rethinking the value of building it, as part of the procedures and an asset of Bibliography.
3 BIBLIOGRAPHY, INTERTEXTUALITY AND VISUALIZATION
Marina Boechat
Bibliography, metrics and data visualization: how may we compose shared contexts of information?
involves relinking them with the socio-technical networks from which they were bred, towards developing a wider understanding of the tensions and agencies involved in their production and reproduction. These networks include, of course, other objects, people and institutions. It also tends to emphasize a certain stability of these devices that are taken as well defined objects. They are artifacts that result of and act in this wider context, to which connections are traced mainly according to critical interpretations of their content. Second, there is the idea of context as related to where and when such devices may circulate, where and in what situations they could be used or be relevant. These appropriations also relink them to wider socio-technical networks, that include books, people, collections, institutions, technical infrastructures and so on and so forth. It points to the future. Both of these aspects are presenting fairly well defined objects whose story and uses can be traced and evaluated by a critical and interpretative approach towards their content. They are referring to intertextuality, but being mostly from a critical point of view, and will be highly permeated by relations that are external to the content,
building a context for the text.
Finally, the third aspect of the idea of context is related to emphasizing the constituting relations and building the context from there. It involves a bottom-up approach that builds categories based on occurrences and other aspects. It also involves laying out a network of connections that does not necessarily match institutional borders, for example. The focus is on building a universe from its intrinsic relations, even though classification will occur, and this intrinsic aspect of context will always influence and be influenced by the others aspects. In this sense, the first two aspects of context are somehow semantical, relying on careful interpretation, while the third is more grammatical. It would build a context of text.
Marina Boechat
Bibliography, metrics and data visualization: how may we compose shared contexts of information?
Nevertheless, these wider contexts are always present. For example, if someone decides to apply scientometric methods to a specific collection of a library, say, the collection on astronomy, there will always be some tension between the bottom-up categories the researcher wants to produce, and the top-down, critical categories of the scientific community and of the institutional priorities of the library that gathered that specific collection in a certain way. So the three aspects of context are talking at the same time about intertextuality and about institutions and social networks of belonging and appropriation, and bibliography relates to them, especially in the case of textual bibliography.
Marina Boechat
Bibliography, metrics and data visualization: how may we compose shared contexts of information?
a perspective like textual Bibliography, different automatized methods based on data analysis may be incorporated, in order to allow for different points of view for different dimensions of the material and for building a more plural view.
Marina Boechat
Bibliography, metrics and data visualization: how may we compose shared contexts of information?
Figure 1 - The history of science fiction.
Source: Shelley (2012).
Figure 2 - The history of science fiction - detail.
Source: Shelley (2012).
Marina Boechat
Bibliography, metrics and data visualization: how may we compose shared contexts of information?
necessity of creating relevant partial contexts or localizing entry points from where contexts may be organized becomes the central concern. Information is excessive and scattered, so it is not enough to filter the relevant parts: it is necessary to create relevance by contextualization. Each map, diagram, page or navigation menu intends to be a general and useful schema for some set of information and opens the path for a game of approximations, setting apart and localizing from which contexts may be organized and experienced.
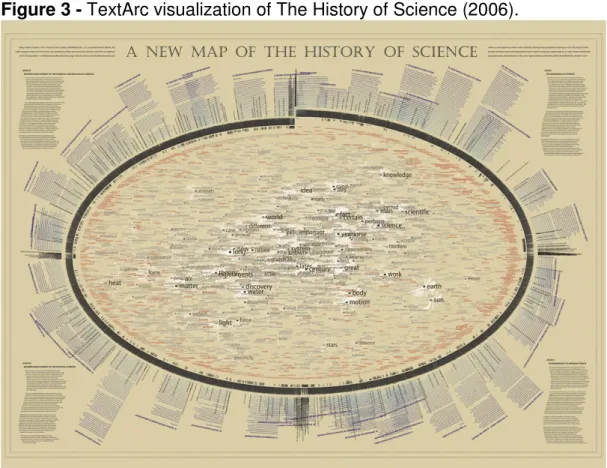
Figure 3 - TextArc visualization of The History of Science (2006).
Source: Bradford Paley (apud BÖRNER; POLLEY, 2014).
In the visualization in figure 3, we have an interesting effort of converting a large scientific compendium into a visual landscape: according to Börner and Polley (2014), it displays the text of four
volumes of the Henry Smith Williams’s A History of Science (1904) in the
Marina Boechat
Bibliography, metrics and data visualization: how may we compose shared contexts of information?
correspondent corner, while the introduction to each major school or movement is displayed in columns that radiate from the center, also matching each book’s quadrant. The word cloud in the center represents the terms found in all four books, while the ones in larger font size occur more often. The words towards the middle would have occurred throughout the text, while the others may float closer to the bits of text where they were most common. The words in red are the ones with capitalized first letters, typically proper nouns like names of places or people, and will in general float to the borders.
Marina Boechat
Bibliography, metrics and data visualization: how may we compose shared contexts of information?
(2003) posits that nowadays our idea of space does not emphasize extension: space is seen as a collection of many places. And a place, in this sense, takes form in the relation of many locations, it comes from assuming a point from where one would act in space. Space and also text or information get to be composed as a set of variables, subject to endless managing and rearranging.
We understand that network maps are among the forms that best represent this attitude, because, besides not being necessarily hierarchical, they map out landmarks and their relations, not exactly privileging extensions, but relative positioning and density. According to Börner and Polley (2014), they do not have a preset reference system, like many other graphs: this will be defined by the choices made according to the data available. So these visualizations are very close to data, in the sense that they do not derive of much pre-interpretation, and leave much space for interpretation and further refining in other visualizations or views that might be produced from it.
Nowadays, the movement that recedes and encompasses more, related to totalizing views, and its complementary movement, of closing in on the detail, becomes more and more a modulation of transitory and utilitarian perspectives in interfaces of computer software. In the first two aspects of context (of origin and of circulation), the limits of the representation would relate and be outlined by external references, whether collections, institutions or predefined categories and critical standpoints. Therefore, there is an effort to account for the whole of this space that needs charting. Besides, when the context is built through deploying relations, the limits of the representation are outlined through the exhaustion of those relations: a network, for example, grows until all relevant relations are traced.
Marina Boechat
Bibliography, metrics and data visualization: how may we compose shared contexts of information?
Marina Boechat
Bibliography, metrics and data visualization: how may we compose shared contexts of information?
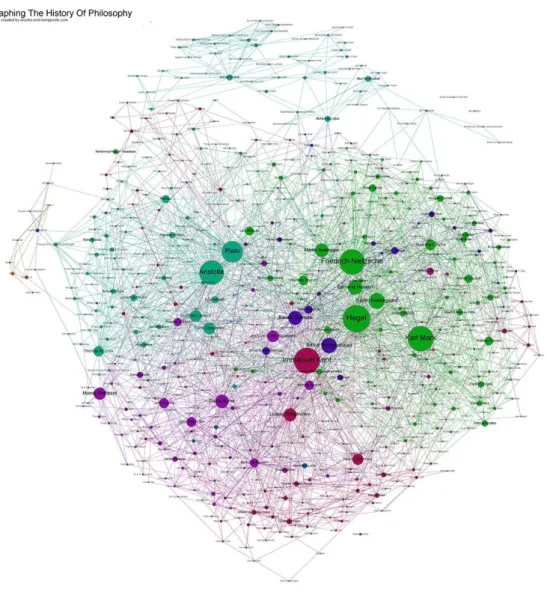
Figure 4 - Graphing the history of philosophy.
Source: Raper (2012).
Figure 5 -Graphing the history of philosophy - detail.
Marina Boechat
Bibliography, metrics and data visualization: how may we compose shared contexts of information?
With all the details presented in the map, it is possible to evaluate the categories and attributions made by the community of Wikipedia as a connected whole. This allows many different entry points into the main theme and builds a new layer of appreciation. For example, by coloring the different philosophical traditions, one can discuss the exchanges of influence between them, and even elaborate on the adequacy of such philosophical divisions. On the other hand, it is also possible to reassess the links of influence of Wikipedia themselves, that were built mostly from a top-down perspective, that is, based on critical, disciplinary appreciation, and now can be evaluated from a different point of view. For example, Adam Hogan (2015), in his blog Design and Analytics (2012), brings up an interesting discussion about this network: judging by the centrality and the size of the node of Hegel, he would probably be the most influential philosopher in history, which seems curious, considering the fundamental place ancient greek philosophers like Plato have in western philosophy. So, is he really king? Moreover, did the editors of Wikipedia themselves have any previous consideration of how this aggregated result would look like when they went, point by point, defining the influences of each philosopher? Probably not. It was only visible… well, by visualization, by assembling a visual context to these scattered bits of information.
Marina Boechat
Bibliography, metrics and data visualization: how may we compose shared contexts of information?
along the chosen timeframes: how the main keyword, self-organization, was associated to different terms, which gives us hints about how its interpretation evolved. This tracks a powerful theoretical category in the making and in the evolution, giving us an integrated view of an aspect of
the corpus.
Figure 6 - The whole is always smaller than its parts, figure 4a.
Source: Monads (2012).
Marina Boechat
Bibliography, metrics and data visualization: how may we compose shared contexts of information?
new set of tools to test and renovate descriptive analyses. It means that both perspectives may be used to check on one another, like in the case of the network on the history of philosophy according to Wikipedia.
5 FINAL REMARKS
The seminar “Arte da Bibliografia”, that took place last December in Rio de Janeiro, organized by IBICT/COEP and the research group Ecce Liber, proposed a rediscovery of Bibliography as a science, born beside medieval studies and growing into a wider field. In this article, we seeked to outline some fundamental concerns of the field in order to update its relevance to today’s informational landscape. One fundamental concern of bibliography that we chose to focus on, the emphasis in creating knowledge contexts from documents, was explored in the form of different postures or procedures that may equip Bibliography, conciliating in its major facets, textual Bibliography and the quantitative tools derived from bibliometrics, with the use of quali-quantitative methods.
Marina Boechat
Bibliography, metrics and data visualization: how may we compose shared contexts of information?
Books are dense and meaningful, but text, in large amounts, can break literacy. We see it happen in the extreme example of the Babel library imagined by Borges (2001): it contained countless books with the same length, with all the possible letter combinations, whether they formed intelligible text or not. Therefore, most were filled with gibberish text, and a people could go through their entire lives in the library without ever finding a book with meaningful content. In this extreme, intertextuality, if ever possible, would be unreachable. In a less extreme and more realistic situation, linear texts do not give away their structure in plain sight and top-down categories may hide interesting and meaningful aspects and connections. Visualizations can offer many entry points for readership, easing into the complexity of today’s informational landscape through multiple entries, while avoiding simplification.
REFERENCES
BORGES, Jorge Luís. Ficciones. Argentina: Buenos Aires, 2001.
BÖRNER, Katy; POLLEY, David E. Visual insights: a practical guide to
making sense of data. MIT Press: London, 2014.
FONSECA, Edson Nery da. A bibliografia como ciência: da crítica textual
à Bibliometria. Revista Brasileira de Biblioteconomia e
Documentação, Brasília, v. 12, n. 1-2, jan./jun. 1979.
FOUCAULT, Michel. Outros espaços. In: ______. Ditos e escritos. Rio
de Janeiro, Forense Universitária, 2003. v. 4.
HOGAN, Adam. Visualizing the history of philosophy as a social
network: the problem with hegel. Disponível em:
<http://www.designandanalytics.com/visualizing-the-history-of-philosophy-as-a-social-network-the-problem-with-hegel>. Acesso em: 5 jan. 2015.
JOHNSON, Steven. Cultura da interface: como o computador
Marina Boechat
Bibliography, metrics and data visualization: how may we compose shared contexts of information?
LATOUR, Bruno, JENSEN, Pablo, VENTURINI, Tommaso. The whole is always smaller than its parts: a digital test of gabriel tarde's monads.
British Journal of Sociology, London, v. 63, n. 4, p. 590-615, Dec. 2012.
MONADS, Gabriel Tard’s. The whole is always smaller than its parts. 2012. Disponível em:
<http://www.medialab.sciences-po.fr/publications/monads/figure-4a/>. Acesso em: 5 jan. 2015.
RAPER, Simon. Graphing the history of philosophy. 2012.
Disponível em: <http://www.coppelia.io/2012/06/graphing-the-history-of-philosophy>. Acesso em: 20 jan. 2015.
SHELLEY, Ward. The history of science fiction. 2012. Disponível em:
<http://www.wardshelley.com/paintings/pages/HistoryofScienceFiction.ht ml>. Acesso em: 20 jan. 2015.
VENTURINI, Tommaso; LATOUR, Bruno. The Social fabric: digital
traces and quali-quantitative methods. 2010. Disponível:
<http://www.medialab.sciences-po.fr/publications/Venturini_Latour-The_Social_Fabric.pdf>. Acesso em: 5 mar. 2015.
WARTENA, Christian; ROGIER, Brussee; WOUT, Slakhorst. Keyword
extraction using word co-occurrence. 2010. Disponível em: <http://ieeexplore.ieee.org.ez78.
periodicos.capes.gov.br/stamp/stamp.jsp?tp=&arnumber=5592000>. Acesso em: 20 jan. 2015.
WILLIAMS, Henry Smith. A history of science. New York: Harper
Collins, 1904.
Title
Bibliografia, métricas e visualização de dados
Resumo
Introdução: Entendemos que o trabalho cuidadoso de compor contextos bibliográficos é uma preocupação fundamental da Bibliografia e colabora para uma melhor compreensão da intertextualidade entre documentos. A idéia de contexto pode, no entanto, assumir muitas inflexões, conectadas com as diversas abordagens ao material bibliográfico. Defendemos que os métodos quali-quantitativos e a visualização de dados podem ser usados para recompor contextos bibliográficos a partir de pontos de vista renovadores.
Marina Boechat
Bibliography, metrics and data visualization: how may we compose shared contexts of information?
podem oferecer novas possibilidades para recompor, avaliar e compartilhar contextos de informação.
Metodologia: Revisão bibliográfica, discussão de casos. Pretendemos aplicar conceitos dos métodos digitais de pesquisa social para problemas da Bibliografia, enquanto discutimos as vantagens das visualizações.
Resultados: Métodos quali-quantitativos podem fazer progredir os estudos bibliográficos ao propor pontos de entrada variados e uma abordagem emergente, de baixo para cima, para a composição de contexto, enquanto a visualização de dados pode dar nova visibilidade para seus aspectos intertextuais.
Conclusão: O seminário A Arte da Bibliografia, realizado em dezembro no Rio de Janeiro, organizado pelo IBICT / COEP e pelo grupo de pesquisa Ecce Liber, propôs a redescoberta da Bibliografia como ciência e nasceu ao lado dos estudos medievais do campo. Neste artigo, tratamos de algumas das preocupações fundamentais do domínio, a fim de atualizar a sua relevância atual. Uma das principais preocupações da literatura que optamos por focar é a ênfase na criação de contextos de conhecimento dos documentos, que podem ser equiparados à Bibliografia, reconciliando em seus principais aspectos, referências textuais e ferramentas quantitativas derivadas de bibliometria, como usando métodos qualitativos e quantitativos.
Palavras-chave: Visualização de dados. Bibliografia. Intertextualidade. Contexto.
Titulo
Bibliografía, métricas y visualización de datos
Resumen
Introducción: Comprendemos que el cuidadoso trabajo de componer universos de conocimiento es una preocupación fundamental de los estudios bibliográficos y colabora para una mejor comprensión de la intertextualidad entre los documentos. Sin embargo, la idea de contexto puede tomar variadas inflexiones, conectadas com diversos enfoques sobre el material bibliográfico. Proponemos que los métodos cuali-cuantitativos y la visualización de datos pueden recomponer contextos bibliográficos a partir de puntos de vista renovadores.
Objetivo: Discutir como la idea de contexto relaciona con métodos bibliográficos y como métodos cuali-cuantitativos y la visualización de datos puede ofrecer nuevas posibilidades para recomponer, evaluar y compartir contextos de información.
Metodología: Revisión bibliográfica, discusión de casos. Pretendemos aplicar conceptos de los métodos digitales de la investigación social en los problemas de la Bibliografía, mientras discutimos las ventajas de las visualizaciones.
Marina Boechat
Bibliography, metrics and data visualization: how may we compose shared contexts of information?
visualización de datos puede dar nueva visibilidad a sus aspectos intertextuales.
Concluisiones: El seminario “Arte de la Bibliografía”, celebrado en diciembre en Río de Janeiro, organizado por IBICT / COEP y grupo de investigación Ecce Liber, propusieron el redescubrimiento de la Bibliografía como ciencia, nacido al lado de los estudios medievales y creciente en el campo más amplio. En este artículo, nos ocupamos de algunas de las preocupaciones fundamentales de la materia con el fin de actualizar su relevancia en el paisaje informativo de hoy. Una de las preocupaciones clave de la bibliografía que hemos elegido para centrarse es el énfasis en la creación de contextos de conocimiento de los documentos, que puede equipar la Bibliografía, conciliando en sus principales facetas, Bibliografía textual y las herramientas cuantitativas derivadas de Bibliometría, con el uso de métodos cualitativos y cuantitativos.
Palabras clave: Visualización de datos. Bibliografía. Intertextualidad. Contexto.