Original Article
ANALYSIS OF THE BRAZILIAN CHAMPIONSHIP FIRST DIVISION PERFORMANCE BETWEEN 2003 AND 2014
ANÁLISE DO DESEMPENHO DO CAMPEONATO BRASILEIRO DE PRIMEIRA DIVISÃO ENTRE 2003 E 2014
Domingos Rodrigues Pandeló Junior1, Roberto Melchior2
e Paulo Henrique Silva Marques de Azevedo1
1
Universidade Federal de São Paulo, Santos-SP, Brasil.
2Faculdade de Educação Física de Santos, Santos-SP, Brasil.
RESUMO
O objetivo do presente artigo é avaliar o desempenho dos times da primeira divisão do futebol brasileiro, com base em dados do campeonato brasileiro, no período entre 2003 e 2014. A técnica multivariada utilizada para a análise foi a construção de uma medida de dissimilaridade e de similaridade, bem como a análise de alguns indicadores. Como principais resultados observou-se uma grande concentração de desempenhos acima da média em clubes das regiões sul e sudeste. Além disso, observou-se que o São Paulo Futebol Clube foi o time com melhor desempenho no período de pontos corridos.
Palavras-chave: Desempenho. Análise. Similaridade. Dissimilaridade. Futebol. Campeonato brasileiro.
ABSTRACT
The aim of this paper is to evaluate the performance of teams in the first division of brazilian soccer, based on data of the brazilian championship, between 2003 and 2014. The multivariate technique used for the analysis was the construction of a measure of dissimilarity and similarity as well as the analysis of some indicators. The main results show that there was a large concentration of high performances in clubs of south and southeast regions. Furthermore, it was observed that the São Paulo Futebol Clube was the team with better performance in the period.
Keywords: Performance. Analysis. Similarity. Dissimilarity. Soccer. Brazilian championship.
Introduction
Football has a special magic for most of the people. In Brazil, the magic of the ball reaches dimensions which are difficult to explain1. The Brazilian championship is one of the most balanced in the world, with many teams in theoretical conditions (technical) to fight for the title, according to what can be seen in the results of the researched years. In the last years, more intensively, there was a further movement of football towards the gym and the science. In this way, more and more researchers dedicate themselves to study football, in its multiple facets2.
analysis of tactical performance and final results (tie, victory and defeat), finding significant differences and possible justifications between tactical performance and final result.
The performance forecast could help sponsors in decision taking, such as choosing the team to invest their money in. It could also influence players decisions concerning the choice of teams with potential to reach first positions. The aim of this article is to assess first division teams of Brazilian football performances, based on results obtained in first division Brazilian championships, within 2003 and 2014, through indicators that can mirror the teams performances.
Methods
Data used in this paper were obtained from the site Futdados13 and transferred to the software SPSS 21 Pro. Work was carried out with data from 2003 to 2014, since the current qualifying system came into being in 2003 in Brazilian championship. Calculations were performed only for first division championship. The multivariate technique used in the analysis was the development of a dissimilarity and similarity measure, as well as some indicators analysis.
The available variables for analysis were the number of points, matches, victories, ties, defeats, goals scored for and against, goal difference and number of times the team has participated in the championship (in the first division) over the period considered.
In order to facilitate analysis, four performance indicators were created: the relation between the number of wins and the total of matches (D1), the relation between the number of ties and the total of matches (D2), the relation between the number of defeats and the total of matches (D3) and the utilization rate (D4), defined as the complement of total of defeats divided by the sum of ties and wins. The creation of the indicators came up to standardize data, thus the number of editions of each team, the number of players, among other aspects, would not be influenced by a greater or lesser participation in terms of number of championships in the first division of Brazilian championship. Therefore, based on table 1 the four indicators were created to calculate the similarity and dissimilarity measure 41 clubs were included in the samples altogether.
Dissimilarity Measure
The Euclidian distance was used as dissimilarity measure. The Euclidian distance for individuals i and j, using p parameters, is obtained by the formula14:
In the present paper, i and j are the taken clubs. It is noted that in this case the template reaches a differentiated formula, as we are dealing with multiple analysis (41 clubs were considered altogether). Concerning the parameters used, they were four: D1, D2, D3 and D4, defined previously.
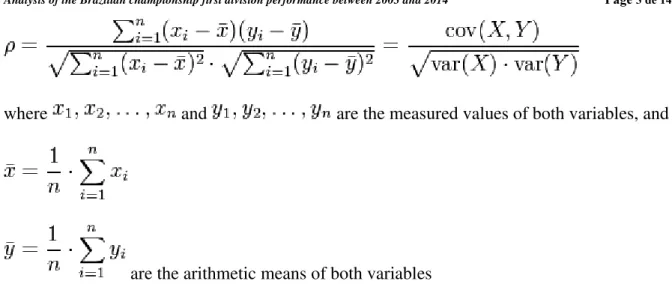
Similarity Measure
where and are the measured values of both variables, and
are the arithmetic means of both variables
In the case of the current study, it is a correlation measure among the variables considered, for the considered parameters (D1, D2, D3 and D4). The analysis of table 1 gives provides an idea of the concentration of teams, with better performance, in the South (26,83% of the total) and Southeast (43,90%). Both regions make 71,73% of the teams which disputed the first division of Brazilian championship in the period considered. However, the central - west region (7,32%), northeast (19.51%) and North (2,44%) had a quite smaller participation.
Table 1. Championship data
Team Points Matches Victories Ties Defeats
Gols scored
Gols against
Gols
Table 1. Continuing....
Team Points Matches Victories Ties Defeats
Gols scored
Gols against
Gols
difference Editions
São Caetano 215 172 65 41 66 209 199 10 4 Náutico 200 190 54 38 98 224 318 -94 5 Criciúma 188 168 50 38 80 195 266 -71 4 Avaí 154 137 39 37 61 178 223 -45 4 Guarani 147 130 36 39 55 140 180 -40 3 Paysandu 146 134 41 31 62 193 245 -52 3 Fortaleza 142 126 36 34 56 155 200 -45 3 Portuguesa 127 114 31 38 45 137 157 -20 3 Atlético-GO 120 114 30 30 54 138 169 -31 3 Ceará 86 76 20 26 30 82 108 -26 2 Barueri 77 76 19 23 34 98 116 -18 2 Chapecoense 72 61 19 15 27 58 68 -10 2 Santo André 41 38 11 8 19 46 61 -15 1 Brasiliense 41 42 10 11 21 47 67 -20 1 América MG 37 38 8 13 17 51 69 -18 1 Ipatinga 35 38 9 8 21 37 67 -30 1 Santa Cruz 28 38 7 7 24 41 76 -35 1 Joinville 21 23 5 6 12 17 25 -8 1 América-RN 17 38 4 5 29 24 80 -56 1
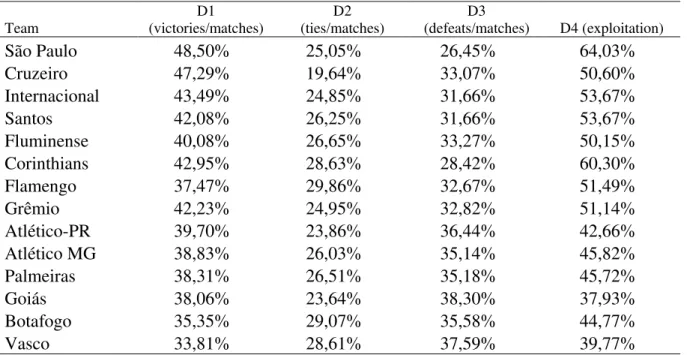
Table 2 shows the four indicators created for the analysis. The major aim of table 2 was to create relative indicators, which would not consider the number of participations of teams in competitions, but its effectiveness, or ineffectiveness, in terms of wins, ties, defeats and performance.
Table 2. Indicators of Effectiveness and Ineffectiveness
Team
D1 (victories/matches)
D2 (ties/matches)
D3
(defeats/matches) D4 (exploitation)
São Paulo 48,50% 25,05% 26,45% 64,03%
Cruzeiro 47,29% 19,64% 33,07% 50,60%
Internacional 43,49% 24,85% 31,66% 53,67%
Santos 42,08% 26,25% 31,66% 53,67%
Fluminense 40,08% 26,65% 33,27% 50,15% Corinthians 42,95% 28,63% 28,42% 60,30%
Flamengo 37,47% 29,86% 32,67% 51,49%
Grêmio 42,23% 24,95% 32,82% 51,14%
Atlético-PR 39,70% 23,86% 36,44% 42,66% Atlético MG 38,83% 26,03% 35,14% 45,82% Palmeiras 38,31% 26,51% 35,18% 45,72%
Goiás 38,06% 23,64% 38,30% 37,93%
Botafogo 35,35% 29,07% 35,58% 44,77%
Table 2. Continuing....
Team
D1 (victories/matches)
D2 (ties/matches)
D3
(defeats/matches) D4 (exploitation)
Coritiba 35,06% 26,75% 38,18% 38,24%
Figueirense 33,77% 27,53% 38,70% 36,86%
Vitória 32,27% 24,82% 42,91% 24,84%
Ponte Preta 30,26% 26,57% 43,17% 24,03%
Paraná 37,62% 20,95% 41,43% 29,27%
Juventude 33,81% 23,81% 42,38% 26,45%
Sport 30,99% 29,11% 39,91% 33,59%
Bahia 27,78% 29,80% 42,42% 26,32%
São Caetano 37,79% 23,84% 38,37% 37,74%
Náutico 28,42% 20,00% 51,58% -6,52%
Criciúma 29,76% 22,62% 47,62% 9,09%
Avaí 28,47% 27,01% 44,53% 19,74%
Guarani 27,69% 30,00% 42,31% 26,67%
Paysandu 30,60% 23,13% 46,27% 13,89%
Fortaleza 28,57% 26,98% 44,44% 20,00% Portuguesa 27,19% 33,33% 39,47% 34,78% Atlético-GO 26,32% 26,32% 47,37% 10,00%
Ceará 26,32% 34,21% 39,47% 34,78%
Barueri 25,00% 30,26% 44,74% 19,05%
Chapecoense 31,15% 24,59% 44,26% 20,59% Santo André 28,95% 21,05% 50,00% 0,00% Brasiliense 23,81% 26,19% 50,00% 0,00% América Mineiro 21,05% 34,21% 44,74% 19,05% Ipatinga 23,68% 21,05% 55,26% -23,53% Santa Cruz 18,42% 18,42% 63,16% -71,43% Joinville 21,74% 26,09% 52,17% -9,09% América-RN 10,53% 13,16% 76,32% -222,22%
Results and Discussions
The analysis of Table 1 shows that 6 out of 41 clubs analysed: São Paulo, Cruzeiro, Internacional, Santos, Fluminense and Flamengo have participated in 13 editions of Brazilian championship through qualifying system, considered. On the other hand, Corinthians, Grêmio, Atlético Mineiro and Atlético Paranaense have taken part in 12 editions. Another aspect that calls attention is that 71% of the clubs considered in the analysis belong to the South and Southeast regions of Brazil. In the case of considering clubs which have had 5 or more participations, in the first division, in the period analyzed, only Goiás, Vitória, Sport and Bahia would represent regions other than South / Southeast. Therefore, a major concentration, in terms of power, of clubs from the South and Southeast can be inferred, concerning the first division Brazilian championship.
between the number of wins and the total of matches. The index D2 measures the relation between the number of ties and the total of matches. The index D3 measures the relation between the number of defeats and the total of matches. And finally, index D4 is an exploitation measure, considering the total of wins and ties in relation to the number of matches.
Once points for wins and ties are scored the exploitation rate gives an idea of the effectiveness of the club in the search for points. It is clean that the victory must be the major objective, as it scores more points than ties (3 points against 1 point), but ultimately, depending on the situation, a tie can be considered a reasonable result. From the effectiveness point of view, in terms of results, the total amount of points (TP) can be obtained through the victory (V), tie (E) or defeat (D). Obviously, the defeat would be the less effective result, in terms of score for the championship, but it is a result that invariably occurs, even with teams that might become champions. As victory scores 3 points, we assume that the victory is the higher effectiveness index, the tie would be the second best effectiveness index and defeat would be the worst. This ways in terms of effectiveness, we would have an index of 1 for victory, 1/3 for tie and 0 for defeat.
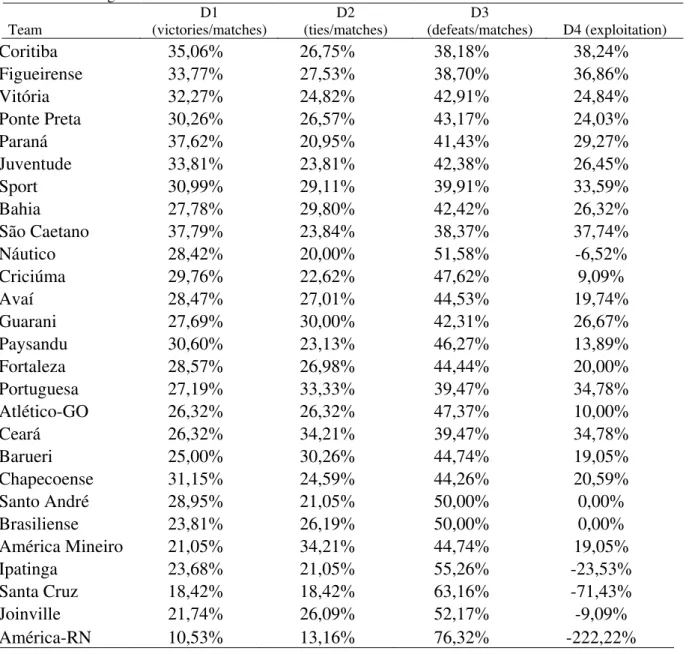
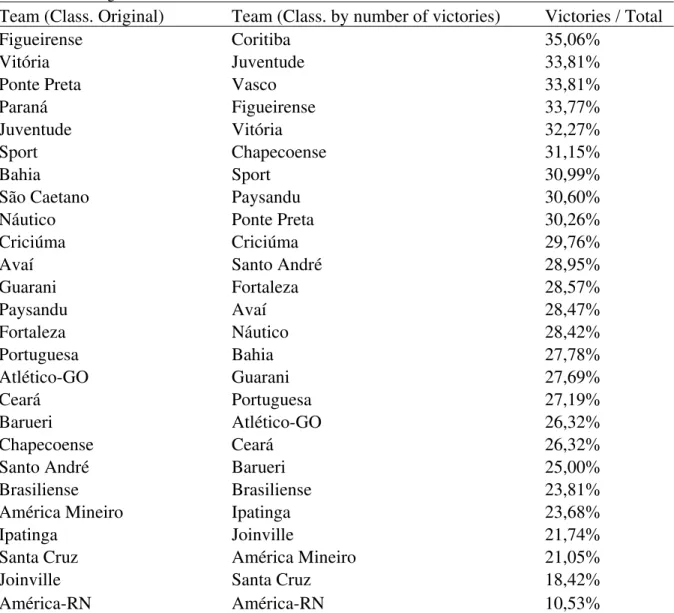
Table 3 shows the effectiveness in terms of victory for number of matches. In column 1 we have the original classification, based on the number of points the club has in the 13 editions of the considered Brazilian championship. In column 2 we have the classification based on the percentage of wins in relation to the number of matches. In the 3 first positions there is no change in the columns order, but from position 4 on some changes are noticed. From the championship point of view, as whole, the second column is extremely important as it shows the teams effectiveness in terms of victory that, as previously observed, is where the highest score for the championship occurs. Evidently, the team that reaches the greatest consistency in terms of victory and, at the same time, the lowest number of defeats. If we look at the 10 first clubs, concerning the total number of points, through original classification (column 1), we can see that only Flamengo had an expressive fall in positions when comparing to column 2. In the case of Flamengo it was a fall of 7 positions. Grêmio and Corinthians had the larger positive variations, gaining 3 and 2 positions, respectively.
Table 3. Percentage of victories
Team (Class. Original) Team (Class. by number of victories) Victories / Total
São Paulo São Paulo 48,50%
Cruzeiro Cruzeiro 47,29%
Internacional Internacional 43,49%
Santos Corinthians 42,95%
Fluminense Grêmio 42,23%
Corinthians Santos 42,08%
Flamengo Fluminense 40,08%
Grêmio Atlético Paranaense 39,70%
Atlético Paranaense Atlético Mineiro 38,83%
Atlético Mineiro Palmeiras 38,31%
Palmeiras Goiás 38,06%
Goiás São Caetano 37,79%
Botafogo Paraná 37,62%
Vasco Flamengo 37,47%
Table 3. Continuing..
Team (Class. Original) Team (Class. by number of victories) Victories / Total
Figueirense Coritiba 35,06%
Vitória Juventude 33,81%
Ponte Preta Vasco 33,81%
Paraná Figueirense 33,77%
Juventude Vitória 32,27%
Sport Chapecoense 31,15%
Bahia Sport 30,99%
São Caetano Paysandu 30,60%
Náutico Ponte Preta 30,26%
Criciúma Criciúma 29,76%
Avaí Santo André 28,95%
Guarani Fortaleza 28,57%
Paysandu Avaí 28,47%
Fortaleza Náutico 28,42%
Portuguesa Bahia 27,78%
Atlético-GO Guarani 27,69%
Ceará Portuguesa 27,19%
Barueri Atlético-GO 26,32%
Chapecoense Ceará 26,32%
Santo André Barueri 25,00%
Brasiliense Brasiliense 23,81%
América Mineiro Ipatinga 23,68%
Ipatinga Joinville 21,74%
Santa Cruz América Mineiro 21,05%
Joinville Santa Cruz 18,42%
América-RN América-RN 10,53%
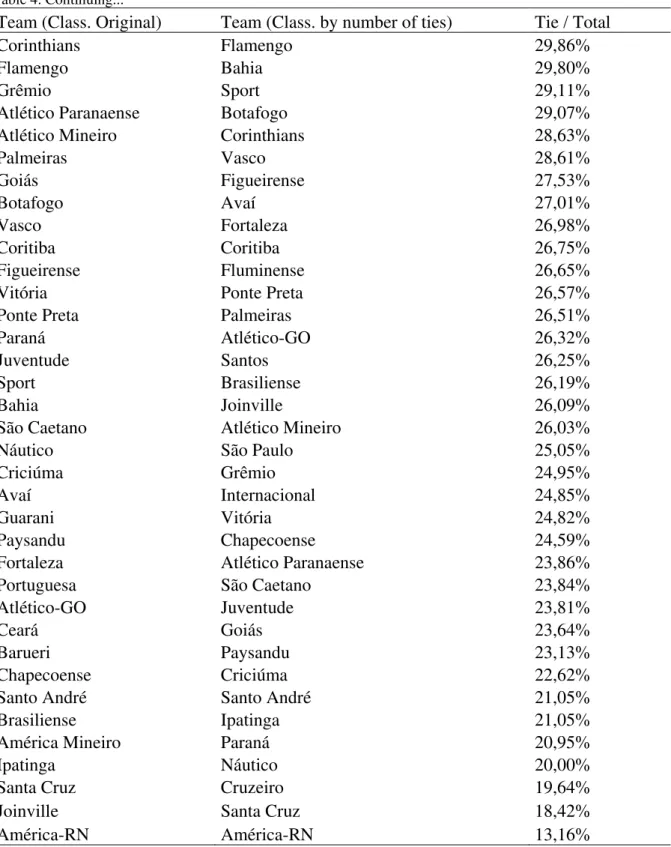
When the percentage of ties is analyzed in relation to the total number of matches, in Table 4, we can see that, on the whole, the smaller clubs play more aiming the tie or show a lower potential for victory. Looking at the table we can see that among the 10 teams which have drawn the most, only Flamengo and Corinthians are placed, in the original classification, among the 10 teams with highest scores in Brazilian championship, within the considered period. From the point of view of match strategy, perhaps the option of tie, as tatics, implies in giving up the victory, avoiding the risk of defeat. However, depending on the aim of the club, according to its specificities, this can be a great strategy, in order to bitter use the available resources.
Table 4. Percentage of tie
Team (Class. Original) Team (Class. by number of ties) Tie / Total
São Paulo Ceará 34,21%
Cruzeiro América Mineiro 34,21%
Internacional Portuguesa 33,33%
Santos Barueri 30,26%
Table 4. Continuing...
Team (Class. Original) Team (Class. by number of ties) Tie / Total
Corinthians Flamengo 29,86%
Flamengo Bahia 29,80%
Grêmio Sport 29,11%
Atlético Paranaense Botafogo 29,07%
Atlético Mineiro Corinthians 28,63%
Palmeiras Vasco 28,61%
Goiás Figueirense 27,53%
Botafogo Avaí 27,01%
Vasco Fortaleza 26,98%
Coritiba Coritiba 26,75%
Figueirense Fluminense 26,65%
Vitória Ponte Preta 26,57%
Ponte Preta Palmeiras 26,51%
Paraná Atlético-GO 26,32%
Juventude Santos 26,25%
Sport Brasiliense 26,19%
Bahia Joinville 26,09%
São Caetano Atlético Mineiro 26,03%
Náutico São Paulo 25,05%
Criciúma Grêmio 24,95%
Avaí Internacional 24,85%
Guarani Vitória 24,82%
Paysandu Chapecoense 24,59%
Fortaleza Atlético Paranaense 23,86%
Portuguesa São Caetano 23,84%
Atlético-GO Juventude 23,81%
Ceará Goiás 23,64%
Barueri Paysandu 23,13%
Chapecoense Criciúma 22,62%
Santo André Santo André 21,05%
Brasiliense Ipatinga 21,05%
América Mineiro Paraná 20,95%
Ipatinga Náutico 20,00%
Santa Cruz Cruzeiro 19,64%
Joinville Santa Cruz 18,42%
América-RN América-RN 13,16%
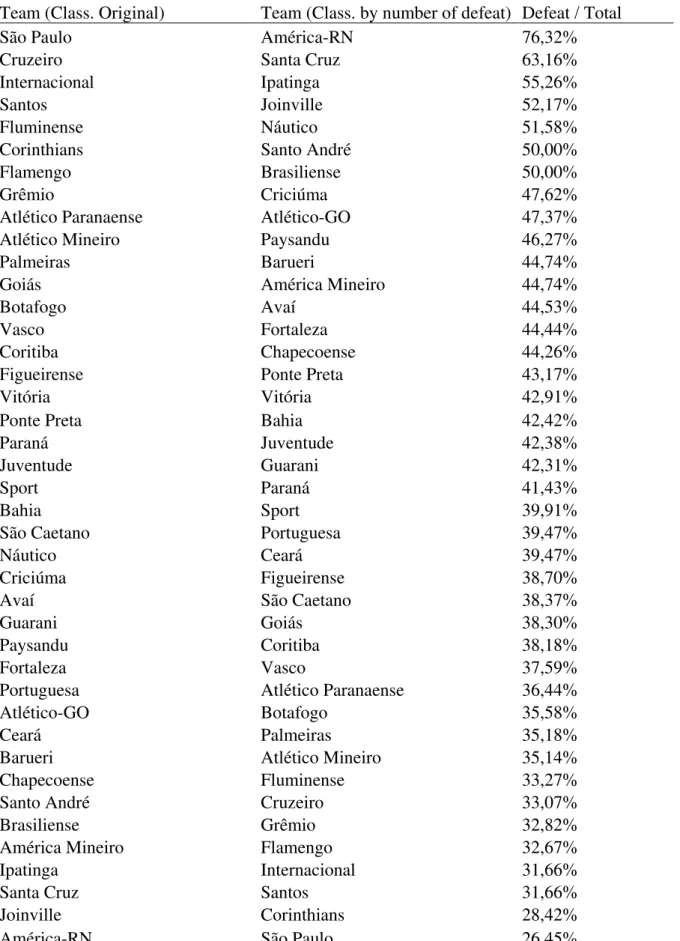
Table 5. Percentage of defeat
Team (Class. Original) Team (Class. by number of defeat) Defeat / Total
São Paulo América-RN 76,32%
Cruzeiro Santa Cruz 63,16%
Internacional Ipatinga 55,26%
Santos Joinville 52,17%
Fluminense Náutico 51,58%
Corinthians Santo André 50,00%
Flamengo Brasiliense 50,00%
Grêmio Criciúma 47,62%
Atlético Paranaense Atlético-GO 47,37%
Atlético Mineiro Paysandu 46,27%
Palmeiras Barueri 44,74%
Goiás América Mineiro 44,74%
Botafogo Avaí 44,53%
Vasco Fortaleza 44,44%
Coritiba Chapecoense 44,26%
Figueirense Ponte Preta 43,17%
Vitória Vitória 42,91%
Ponte Preta Bahia 42,42%
Paraná Juventude 42,38%
Juventude Guarani 42,31%
Sport Paraná 41,43%
Bahia Sport 39,91%
São Caetano Portuguesa 39,47%
Náutico Ceará 39,47%
Criciúma Figueirense 38,70%
Avaí São Caetano 38,37%
Guarani Goiás 38,30%
Paysandu Coritiba 38,18%
Fortaleza Vasco 37,59%
Portuguesa Atlético Paranaense 36,44%
Atlético-GO Botafogo 35,58%
Ceará Palmeiras 35,18%
Barueri Atlético Mineiro 35,14%
Chapecoense Fluminense 33,27%
Santo André Cruzeiro 33,07%
Brasiliense Grêmio 32,82%
América Mineiro Flamengo 32,67%
Ipatinga Internacional 31,66%
Santa Cruz Santos 31,66%
Joinville Corinthians 28,42%
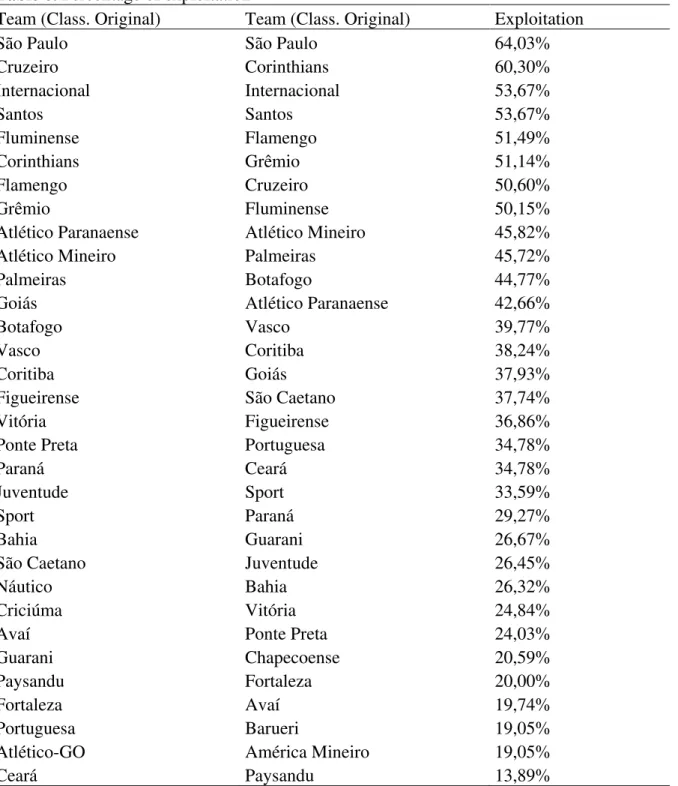
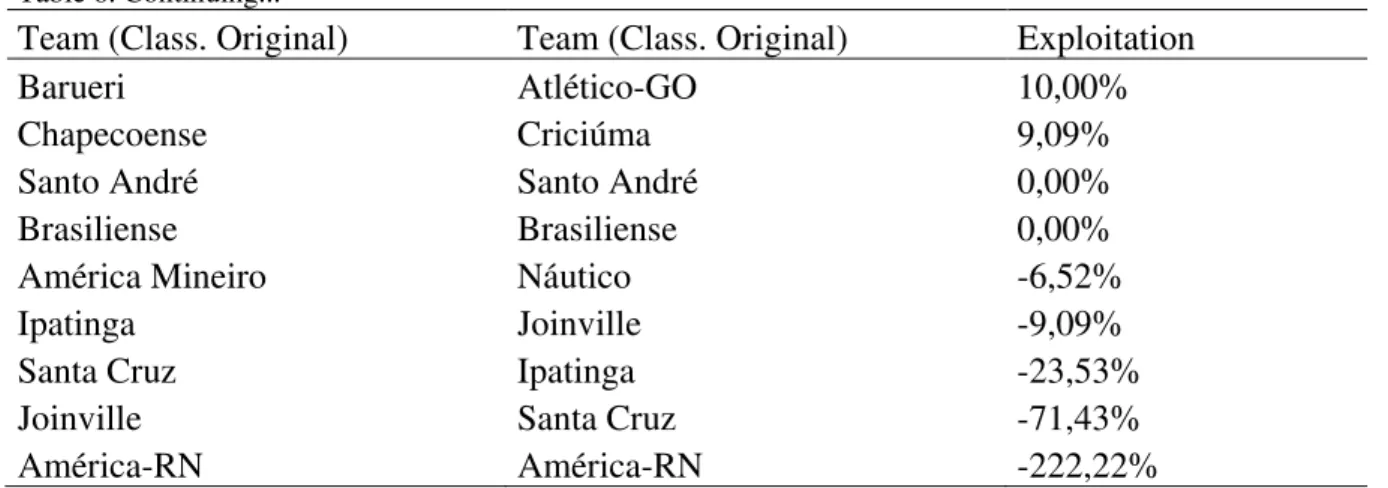
Table 6 measures the exploitation rate of each team. As defined previously, the index measures the complement for the division of the number of defeats (D) by the total of ties (E) and wins (V). This way, the exploitation rate is given by 1 - [ D / (E + V)].
As expected, the exploitation rate is one of the most effective rates to measure the club performance in a championship for points. The analysis of table 6 calls attention for the position of Corinthians, which jumps from the 6th position in the original classification, considering the total of points, to the 2nd position, when the exploitation rate is considered. Cruzeiro, on the other hand, shows an opposite pattern, having a sharp fall since it changes the 2nd position in the original classification for the 7th place, based on the exploitation rate.
Table 6. Percentage of exploitation
Team (Class. Original) Team (Class. Original) Exploitation
São Paulo São Paulo 64,03%
Cruzeiro Corinthians 60,30%
Internacional Internacional 53,67%
Santos Santos 53,67%
Fluminense Flamengo 51,49%
Corinthians Grêmio 51,14%
Flamengo Cruzeiro 50,60%
Grêmio Fluminense 50,15%
Atlético Paranaense Atlético Mineiro 45,82%
Atlético Mineiro Palmeiras 45,72%
Palmeiras Botafogo 44,77%
Goiás Atlético Paranaense 42,66%
Botafogo Vasco 39,77%
Vasco Coritiba 38,24%
Coritiba Goiás 37,93%
Figueirense São Caetano 37,74%
Vitória Figueirense 36,86%
Ponte Preta Portuguesa 34,78%
Paraná Ceará 34,78%
Juventude Sport 33,59%
Sport Paraná 29,27%
Bahia Guarani 26,67%
São Caetano Juventude 26,45%
Náutico Bahia 26,32%
Criciúma Vitória 24,84%
Avaí Ponte Preta 24,03%
Guarani Chapecoense 20,59%
Paysandu Fortaleza 20,00%
Fortaleza Avaí 19,74%
Portuguesa Barueri 19,05%
Atlético-GO América Mineiro 19,05%
Table 6. Continuing...
Team (Class. Original) Team (Class. Original) Exploitation
Barueri Atlético-GO 10,00%
Chapecoense Criciúma 9,09%
Santo André Santo André 0,00%
Brasiliense Brasiliense 0,00%
América Mineiro Náutico -6,52%
Ipatinga Joinville -9,09%
Santa Cruz Ipatinga -23,53%
Joinville Santa Cruz -71,43%
América-RN América-RN -222,22%
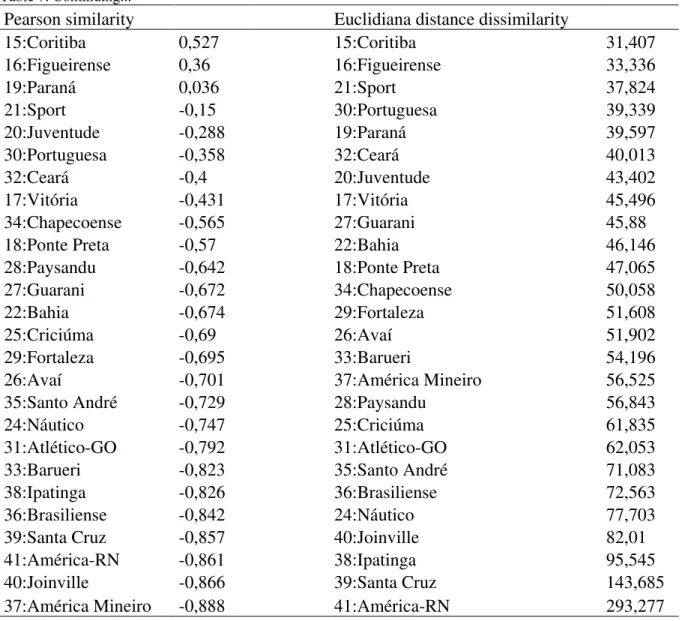
Similarity and Dissimilarity measures
The ultimate goal of this study is to analyze the performance of series A teams, in Brazilian championship, based on multivariate analysis measures. The measures chosen were the similarity and dissimilarity analysis. They are classification and grouping techniques. As dissimilarity measure Euclidian distance will be used and Pearson correlation coefficient will be used as similarity measure. Therefore, the bigger the dissimilarity measure, the further from the best performance the team will be. On the other hand, the bigger the similarity measure, the closer to the best performance the team will be.
Table 7 analysis shows some differences in classifications between similarity and dissimilarity measures. This may occur since they are techniques which use different methodology for calculating. However, no one can expect big changes when assessing both results. In all the analysis developed in this study, São Paulo Futebol Clube (SPFC) ranked first position, thus both the similarity and the dissimilarity measures were elaborated using SPFC as reference. It is important to emphasize that it was not the authors choice, but instead a result of the analysis concerning the position of the team.
Table 7. Measure of similarity and dissimilarity
Pearson similarity Euclidiana distance dissimilarity
1:São Paulo 1 1:São Paulo 0
6:Corinthians 0,989 6:Corinthians 7,834
4:Santos 0,986 3:Internacional 12,64
3:Internacional 0,982 4:Santos 13,311
5:Fluminense 0,967 8:Grêmio 15,686
8:Grêmio 0,967 2:Cruzeiro 15,966
7:Flamengo 0,952 5:Fluminense 17,679
2:Cruzeiro 0,907 7:Flamengo 18,455
11:Palmeiras 0,905 10:Atlético Mineiro 22,397 10:Atlético Mineiro 0,904 11:Palmeiras 22,742 13:Botafogo 0,863 9:Atlético Paranaense 25,206 9:Atlético Paranaense 0,793 13:Botafogo 25,369
14:Vasco 0,601 12:Goiás 30,537
12:Goiás 0,551 14:Vasco 30,676
Table 7. Continuing...
Pearson similarity Euclidiana distance dissimilarity
15:Coritiba 0,527 15:Coritiba 31,407
16:Figueirense 0,36 16:Figueirense 33,336
19:Paraná 0,036 21:Sport 37,824
21:Sport -0,15 30:Portuguesa 39,339
20:Juventude -0,288 19:Paraná 39,597
30:Portuguesa -0,358 32:Ceará 40,013
32:Ceará -0,4 20:Juventude 43,402
17:Vitória -0,431 17:Vitória 45,496
34:Chapecoense -0,565 27:Guarani 45,88
18:Ponte Preta -0,57 22:Bahia 46,146
28:Paysandu -0,642 18:Ponte Preta 47,065 27:Guarani -0,672 34:Chapecoense 50,058
22:Bahia -0,674 29:Fortaleza 51,608
25:Criciúma -0,69 26:Avaí 51,902
29:Fortaleza -0,695 33:Barueri 54,196
26:Avaí -0,701 37:América Mineiro 56,525 35:Santo André -0,729 28:Paysandu 56,843
24:Náutico -0,747 25:Criciúma 61,835
31:Atlético-GO -0,792 31:Atlético-GO 62,053 33:Barueri -0,823 35:Santo André 71,083 38:Ipatinga -0,826 36:Brasiliense 72,563 36:Brasiliense -0,842 24:Náutico 77,703 39:Santa Cruz -0,857 40:Joinville 82,01 41:América-RN -0,861 38:Ipatinga 95,545 40:Joinville -0,866 39:Santa Cruz 143,685 37:América Mineiro -0,888 41:América-RN 293,277
Conclusions
Finally, it is clear that, within the period considered and considering the points. São Paulo Futebol Clube had the best performance according to various criteria. What also calls attention is the performance of Sport Clube Corinthians Paulista, in terms of effectiveness, that can be checked both by its exploitation rate and the similarity measure, or even by the dissimilarity measure..
References
1. Valentin BR, Coelho M. Sobre as escolinhas de futebol: processo civilizador e práticas pedagógicas. Motriz Rev Edu Fis 2005;11(3):185-197.
2. Reilly T, Gilbourne D. Science and football: a review of applied research in the football codes. J Sports Sci 2003;21(9):693-705.
3. Añon IC, Yamanaka GK, Machado JC, Scaglia A. Performance da equipe da Espanha e seus adversários nos jogos da Copa do Mundo FIFA 2010. RBF 2013;06(1):33-44.
4. Marcelino R, Sampaio J, Mesquita I. Investigação centrada na análise do jogo: da modelação estática à modelação dinâmica. Rev Port Cien Desp 2011;11(1):481–499.
5. De Araujo CTP, Tavares L, Alvares LG, Neto FL, Suzuki AK. Modelagem estatística para a previsão de jogos de futebol: Uma aplicação no campeonato brasileiro de futebol 2014. Revista da Estatística UFOP 2015;4(2):12-20.
6. Almeida LG, Oliveira ML, Silva CD. Uma análise da vantagem de jogar em casa nas duas principais divisões do futebol profissional brasileiro. Rev bras educ fís esporte
2011;25(1):49-54.
7. Haas DJ. Productive Efficiency of English Football Teams - A Data Envelopment Analysis Approach. Manage Decis Econ 2003;24(5):403-410.
8. Gómez R, Mendo H. Revisión de Indicadores de Rendimento en Fútbol. RICCAFD 2012;1(1):1-14.
9. Lago-Ballesteros J, Lago-Peñas C. Performance in Team Sports: Identifying the Keys to Success in Soccer. J Hum Kinet 2010;25(1):85-91.
10. Lago-Peñas C, Lago-Ballesteros J, Rey E. Differences in performance indicators between winning and losing teams in the UEFA Champions League. J Hum Kinet
2011;27(1):135-146.
11. Vázquez AV, Gayo AA, Pita HB, Fernández CA. Diseño y aplicación de una batería multidimensional de indicadores de rendimiento para evaluar la prestación competitiva en el fútbol de alto nivel. Int J Sport Sci 2011;7(23):103-112.
12. Carvalho FM, Scaglia AJ, Costa IT. Influência do Desempenho Tático sobre o Resultado Final em Jogo Reduzido de Futebol. Rev Educ Fis UEM 2013;24(3):393-400.
13. Futdados.com [Internet]. Pontos corridos: Campanhas acumuladas desde 2003 - Todas as equipes. [acesso em: 17 jun 2015]. Disponível em:
http://futdados.com/pontos-corridos-campanhas-acumuladas/.
14. Dattorro J. Convex Optimization & Euclidean Distance Geometry. Palo Alto, Califórnia: Meboo Publishing; 2008.
Received on Oct, 04, 2015. Reviwed on May, 15, 2016. Accepted on Jun, 02, 2016.