Development of a quantitative competitive reverse transcriptase
polymerase chain reaction for the quantification of growth hormone
gene expression in pigs
Maurício Machaim Franco
1,2, Juliana Franco Almeida
1, Guilherme Rocha Lino de Souza
1,
Robson Carlos Antunes
1and Luiz Ricardo Goulart
11
Laboratório de Genética Molecular, Instituto de Genética e Bioquímica,
Universidade Federal de Uberlândia, Uberlândia, MG, Brazil.
2
Laboratório de Genética Molecular Animal, Embrapa Recursos Genéticos e Biotecnologia,
Brasília, DF, Brazil.
Abstract
After the advent of the genome projects, followed by the discovery of DNA polymorphisms, basic understanding of gene expression is the next focus to explain the association between polymorphisms and the level of gene expression, as well as to demonstrate the interaction among genes. Among the various techniques for the investigation of transcriptional profiling involving patterns of gene expression, quantitative PCR is the simplest analytical laboratory technique. The objective of this work was to analyze two strategies of a competitive PCR technique for the quantification of the pig growth hormone (GH) gene expression. A pair of primers was designed targeting exons 3 and 5, and two competitive PCR strategies were performed, one utilizing a specific amplicon as a competitor, and the other utilizing a low-stringency PCR amplicon as a competitor. The latter strategy proved to be easier and more efficient, offering an accessible tool that can be used in any kind of competitive reaction, facilitating the study of gene expression patterns for both genetics and diagnostics of infectious diseases.
Key words: pig, GH gene, gene expression, RT-PCR. Received: June 6, 2002; accepted: November 8, 2002.
Introduction
The sequencing of genomes opens a new perspective to the functional studies of various genes. Among the most important technologies in use, the recent application of microarrays allows to study more complex gene interac-tions, although requiring heavy investments and sophisti-cated computational tools, and the methods used to analyze the data can have a great influence on the interpretation of the results.
On the other hand, quantitative PCR and its technical variations focus on the individual analysis of genes, also presenting the advantage of great sensitivity, easy perfor-mance and low cost. The simplest way of identifying genes of potential interest is to study the transcriptional profiling after detection of gene polymorphisms, in order to find an association between them. However, because of many in-teractions among genes, polymorphisms may have no
ef-fect on a given gene expression profile, due to confounding factors, which block the true effect of SNPs (single nucleo-tide polymorphisms) in the final gene expression of a phe-notype. Therefore, the analysis of differential gene expression profiles may be done regardless of observed polymorphisms, demonstrating their biological function and relevance.
Recently, several modifications in quantitative PCR have been described, and the most important of them is probably the competitive PCR (Gilliland et al., 1990), which uses a mixture of a genomic competitor template and a target RNA (gene) sample, to determine its expression pattern. This strategy allows an accurate identification of the number of transcribed molecules, in addition to the con-comitant verification of successful PCR reactions and the detection of false-negatives.
The growth hormone gene of swine is a single-copy gene, localized on chromosome 12, and its great influence on economically important traits has led to a variety of studies regarding its molecular constitution (Schellanderet al.1994).
Send correspondence to Maurício Machaim Franco. Embrapa Re-cursos Genéticos e Biotecnologia, Avenida W/5 Norte Final, Prédio Biotecnologia, Sala 7, 70770-900 Brasília, DF, Brazil. E-mail: mfranco@cenargen.embrapa.br.
The pig GH gene, also named pGH (porcine growth hormone) or somatotropin, was isolated and characterized by Vize and Wells in 1987, and the association of this gene with quantitative traits has been widely investigated ever since.
Nielsen and Larsen (1991) studied RFLPs (restriction fragment length polymorphisms) of the GH gene in Danish and Swedish pig populations, and found pGH polymorphisms withDraIandTaqIenzymes. They demon-strated that there are alterations in the blood concentration of pGH, suggesting genetic differences at the GH locus or at other loci which codify proteins involved in the GH gene expression. Nielsen et al. (1995) used DSCP (double-strand conformation polymorphism) markers at the pGH promoter region, and found an association between gene polymorphisms and alterations of plasma GH levels, lead-ing them to suggest that this gene may be a QTL (quantita-tive trait locus) for GH levels.
The purpose of this work was to analyze two strate-gies of a competitive RT-PCR technique for the quantifica-tion of the pig GH gene expression.
Material and Methods
Genomic DNA extraction
The genomic DNA used as a template for the optimiza-tion and template competitor producoptimiza-tion was obtained from blood samples by adding 1 mL of lysis buffer [20 mM Tris-HCl pH 7.5, 5 mM ethylene-diamine-tetracetic acid (EDTA) pH 7.5, 640 mM sucrose, 10 mM MgCl2, 4% Triton
X-100] to 500µL of leucocytes, and kept on ice for 10 min. Lysed cells were precipitated (white pellet) by centrifugation at 7200 G for 1 min at 4 °C, followed by two or more washes with lysis buffer diluted 1:1 v/v in water. The pellet was sub-mitted to digestion by 10µL of proteinase K (10 mg/mL) and 200µL PK buffer (10 mM Tris-HCl pH 7.5, 1 mM EDTA pH 7.5 and 1% sarkosyl), and incubated overnight at 50 °C. After overnight incubation, 500 µL of 8 M guanidine isothiocyanate/0.49 M ammonium acetate were added to the digestion solution and shaken for 1 h at room temperature to dissolve the pellet. The DNA was precipitated with 800µL of 100% isopropanol, centrifuged at 7200 G for 10 min, and the supernatant was discarded. Two more washes with 60% isopropanol were performed, followed by centrifugation at 7200 G for 2 min. The DNA was dried and then re-dissolved in 0.2 mL of TE (10 mM Tris-HCl pH 7.5 and 1 mM EDTA), followed by incubation at 65 °C for 1 h for complete dilution.
Optimization of the PCR conditions and production of genomic and low-stringency competitor amplicons
The primers were designed using the Primer Designer - version 2.0 Scientific & Educational Software Program (copyright 1990,91), according to the published GH gene sequence (Vize and Wells, 1987). The primer sequences were: 5’-CGATCGCAGAGGTACTCCATCCAGAA-3’
(forward) and 5’-CGATCGTATGTCTCAGCCTTGTGC AG-3’ (reverse), localized in exons 3 and 5, respectively.
Since the forward primer anneals in exon 3, and the reverse primer in exon 5 of the pGH gene, genomic DNA and cDNA can be co-amplified with the same primers, but with different expected sizes.
Different concentrations of MgCl2(1.5 and 2.0 mM)
and 25µM TMAC (tetramethylammonium chloride) were used with 1.0 U of Taq DNA polymerase (Cenbiot Enzimas, Centro de Biotecnologia - UFRGS, Porto Alegre, Brazil), 1X PCR buffer, 400µM dNTP, 0.2 µM of each antisense and sense primers and 150 ng of genomic DNA, in a final volume of 20µL to optimize the specific amplifi-cation conditions of the GH gene, using genomic DNA as template. TMAC, a denaturant agent, was utilized to obtain a more specific reaction.
After preheating at 95 °C for 4 min, 35 amplification cycles were performed at 95 °C for 30 s, 66 °C for 40 s and 72 °C for 1 min. Final incubation was performed at 72 °C for 10 min.
The genomic amplicon was cut from the agarose gel, macerated, filtrated through a glass-wool plug by centri-fugation at 6000 G, and collected in a 1.5 mL microtube. Purification was achieved by adding 2µL of 7.5 M ammo-nium acetate and 2µL of glycogen (10 mg/mL) to a volume of 8µL, that was then mixed and incubated with the same volume of 100% ethanol for 3 h at -20 °C. The DNA solu-tion was centrifuged at 19000 G for 5 min, and the pellet was subsequently washed with 70% ethanol.
Another competitor template was obtained by means of a second strategy (Zimmermann and Mannhalter, 1996), using low-stringency PCR to obtain unspecific fragments using the same primers. After preheating at 95 °C for 4 min, 35 amplification cycles were performed at 95 °C for 30 s, 55 °C for 40 s, and 72 °C for 45 s. Final incubation was per-formed at 72 °C for 4 min. The PCR reaction conditions were: 1.0 U of Taq DNA polymerase (Cenbiot Enzimas, Centro de Biotecnologia - UFRGS, Porto Alegre, Brazil), 1X PCR buffer, 1.5, 2.0, 2.5 and 3.0 mM MgCl2, 400µM
dNTP, 0.5 µM of each of both primers, and 30 ng of genomic DNA, in a final volume of 20µL. After agarose gel electrophoresis, a 298-bp amplicon was chosen as com-petitor for the competitive RT-PCR. This low-stringency competitor amplicon was purified by using the same proto-col as for the genomic amplicon.
All PCR products were submitted to 1.5% agarose gel electrophoresis, stained with ethidium bromide, and photo-graphed under UV illumination.
RNA extraction and optimization of the RT-PCR conditions for amplification of the GH cDNA
manu-facturer’s protocol, with a weight ratio of 1.5 mL Trizol/sample.
Conditions for GH cDNA amplification were opti-mized by using samples with different concentrations of to-tal RNA (1000, 500, 250, 125, 62.5, 31.25, 15.625, and 7.8125 ng), 0.08µM of each antisense and sense primers, mixed with the Ready-to-goTM RT-PCR Beads kit (Amersham Pharmacia Biotech, Inc). The reverse tran-scription and PCR amplification reactions were subse-quently performed under the following conditions: 42 °C for 30 min, 95 °C for 5 min, 30 cycles at 95 °C for 30 s, 66 °C for 40 s, and 72 °C for 1 min. Final incubation was performed at 72 °C for 10 min.
The RT-PCR products were submitted to 1.5% agarose gel electrophoresis, stained with ethidium bromide, and photographed under UV illumination.
Competitive RT-PCR
For the competitive RT-PCR optimization, several concentrations (100, 10, 8, 6, 4, 2, 1, and 0.8 ng) of the puri-fied amplicon (891-bp) were previously tested with a fixed concentration of 30 ng of total RNA and 0.08µM of each primer. In view of the excessive amplification of the puri-fied amplicon in the preliminary test, other concentrations (10, 2.5, 0.625, 0.156, and 0.04 ng) were used for better res-olution, and mixed with 75 ng of total RNA (target) and 0.08µM of each primer. The reverse transcription and PCR amplification reactions were performed using the same conditions as described for the GH cDNA production.
Another competitive RT-PCR reaction was set up, with the 298-bp template as competitor, but with 10 ng of total RNA (target), thirteen dilutions of the competitor tem-plate (100, 10, 8, 6, 4, 2, 1, 0.8, 0.6, 0.4, 0.2, 0.1, and 0.01 ng), and 0.08µM of each primer. A similar reaction was also performed with a concentration of 20 ng of total RNA (target), and eight competitor template dilutions (0.8, 0.6, 0.4, 0.2, 0.1, 0.01, 0.005, and 0.001 ng). The reverse transcription and the PCR amplification reactions were per-formed at 42 °C for 30 min, 95 °C for 5 min, 30 cycles at 95 °C for 30 s, 58 °C for 40 s, and 72 °C for 1 min. Final in-cubation was performed at 72 °C for 10 min.
The total RNA samples used in these experiments were not treated with RNase-free DNaseI. However, a con-trol procedure was performed with the same RNA samples in semi-quantitative RT-PCR reactions, to verify sample quality and to test genomic contamination. To this effect, PCR multiplex reactions were performed, using both GH andβ-actin primers simultaneously, with total RNA with-out previous RT (reverse transcription). The reaction con-ditions were the same as described for the competitive RT-PCR with the low-stringency competitor (298-bp) and 25 ng of total RNA. All competitive RT-PCR reactions were performed with the Ready-to-goTMRT-PCR Beads kit (Amersham Pharmacia Biotech, Inc), and the RT-PCR products were submitted to 1.5% agarose gel
electrophore-sis, stained with ethidium bromide, and photographed under UV illumination.
Reaction controls and normalization of samples with
β-actin gene
A pair of primers was also used to amplify a 264-bp fragment of theβ-actin gene (Matteri and Carroll 1997), representing a constitutive gene. All reactions were per-formed under the same conditions as described for compet-itive RT-PCR with the 298-bp competitor. This control test was done to normalize samples, in view of their qualitative and quantitative differences after nucleic acid extraction, and to correct differential amplifications during reverse transcription. Negative controls (reaction components without DNA/RNA templates) were also performed for all experimental conditions, in order to control cross-contamination.
Densitometric readings and statistical analysis
After the optimization of the PCR and RT-PCR reac-tions, size determinations (base pairs) for the low-stringency competitor template and the quantification of gene expression were done by densitometry, using the ImageMasterTM VDS Software version 2.0 (Pharmacia Biotech, Inc). The quantification of the GH gene expres-sion was based on densitometric readings of the competitor amplicon at a known concentration (Gillilandet al. 1990). A linear regression analysis was performed to calculate the target RNA concentration, by utilizing Microsoft Excel 97 software.
Results
The expected sizes of the specific GH genomic DNA and the GH cDNA amplicons were, respectively, 891 bp and 418 bp, including primer sequences, as showed in Fig-ures 1 and 2. An increasing intensity of amplicons was ob-served, as the concentration of MgCl2 increased, or by
adding 25 µM TMAC with a smaller concentration of MgCl2; but all conditions produced good amplifications.
Since there were no differences in amplicon quality, and
considering cost-effectiveness, the reaction conditions cho-sen were those shown in lane 1 (Figure 1), consisting of: 1.0 U Taq DNA polymerase (Cenbiot Enzymes, Centro de Biotecnologia - UFRGS, Porto Alegre, Brazil), 1X PCR buffer, 1.5 mM MgCl2, 400 µM dNTPs, 0.2µM of each
antisense and sense primers, 150 ng genomic DNA, in a fi-nal volume of 20µL.
Figure 2 shows the results of the GH cDNA amplifi-cation optimization, using different concentrations of total RNA. The amplification pattern obtained was as expected; 1000 ng of total RNA inhibited the target RNA due to its excess, and 7.8125 ng were insufficient for a good amplifi-cation. Dilutions of 250 ng to 31.25 ng were adequate tem-plate concentrations to obtain good amplifications. As shown in Figure 2, with 62.5 ng of RNA, there was no am-plification; however, this may be due to a possible manipu-lation error during PCR mix or electrophoresis loading.
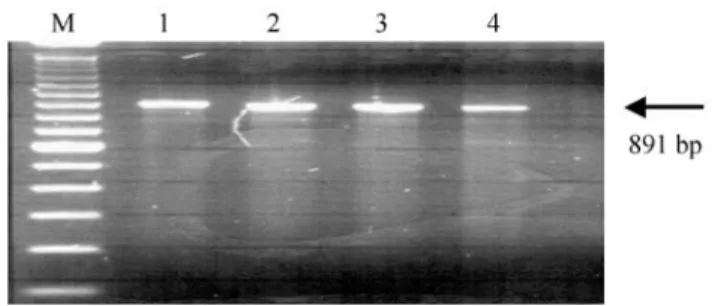
Figure 3 shows RT-PCR reactions carried out with RNA templates in a single test tube with both GH eβ-actin primers. PCR reactions were also performed (lanes 2, 4, 6, 8, and 10) using total RNA as template, to check for genomic DNA contamination. No amplification was ob-served, demonstrating that the samples had no genomic DNA contaminants.
Using several concentrations of the 891-bp purified product as competitors, the competitive RT-PCR optimiza-tion showed the expected pattern of decreasing amplifica-tion, but the 30 ng of total target RNA were insufficient to compete (Figure 4).
The results of the competitive RT-PCR using 75 ng of total RNA are presented in Figure 5. Both genomic DNA and cDNA have similar sequences; therefore, they can form heteroduplexes of an intermediate molecular weight, which may impair analysis (Figure 5).
Figure 6 shows the low-stringency PCR results, indi-cating the 298-bp band that was excised and purified as the unspecific competitor template.
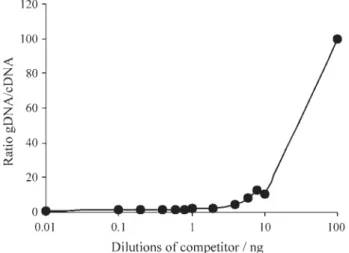
The results of the competitive RT-PCR using thirteen dilutions of the 298-bp competitor template and a fixed concentration (10 ng) of the target RNA are shown in Fig-ure 7, and the gDNA/cDNA ratio as a function of the known competitor template quantity is shown in Figure 8.
Due to the excessive amplification of the competitor and the weak amplification signal of the target RNA, an-other competitive RT-PCR reaction was set up with differ-ent competitor dilutions, using 20 ng of total RNA (Figures 9 and 10).
Since the competitor template had a different size, and larger fragments exhibit greater intensity, the amplicon intensity (densitometry) of the larger band had to be ad-justed by a correction factor obtained as follows: F = com-petitor DNA size in base pairs/cDNA size = 298/418 = 0.7129.
Figure 4- GH genomic and cDNA amplicons separated in 1.5% agarose gel electrophoresis. Lane M: 100-bp DNA molecular weight markers; Lanes 1-8: Competitive RT-PCR products using 100 ng, 10 ng, 8 ng, 6 ng, 4 ng, 2 ng, 1 ng, and 0.8 ng of 891-bp purified DNA as competitor tem-plate, and 30 ng of total RNA. The 418-bp band represents the GH mRNA.
Figure 3- GH cDNA andβ-actin cDNA amplicons separated by 2% agarose gel electrophoresis. Lane M: 100-bp DNA molecular weight markers; Lanes 1, 3, 5, 7, and 9: RT-PCR reactions for the GH (418-bp) andβ-actin (264-bp) genes with no RNase-free DNAseI-treated RNA; Lanes 2, 4, 6, 8, and 10: PCR reaction with total RNA as template for genomic DNA contamination control.
Figure 2- GH cDNA amplicons separated by 1.5% agarose gel electro-phoresis. Lane M: 100-bp DNA molecular weight markers; Lanes 1-8: RT-PCR products using 1000 ng, 500 ng, 250 ng, 125 ng, 62.5 ng, 31.25 ng, 15.625 ng, and 7.8125 ng of total RNA as template. The 418-bp band represents the GH mRNA.
Figure 9 shows the gDNA/cDNA function curve, by using a fixed concentration of 20 ng of total RNA, and a concentration range of the competitor, for which a linear re-lation was obtained (0.001 to 0.8 ng of competitor tem-plate). The point of equivalence of target and competitor templates was not obtained. A 1:1 band ratio was expected for gDNA and cDNA, that would allow the determination of the gene concentration in this study. Although it was not possible to attain equivalence, a linear regression analysis was performed to calculate the target RNA concentration by utilizing Microsoft Excel 97 software.
The set values used for the linear regression analysis were obtained by densitometric readings of the competitive RT-PCR amplicons, as shown in Figure 10 (Equation: Y = 4.7061X + 0.548; R2= 0.9744)
When ratio Y has the value 1, it means that the quanti-ties of gDNA and cDNA are similar, and our final concen-tration of target RNA was 0.096 ng. If 1 µg of a 1 kb fragment has 1.52 pmol and 9.1 x 10¹¹molecules, then 1µg of the 418 bp fragment has 3.64 pmol and 21.79 x 10¹¹ mol-ecules. Consequently, 0.096 ng should have 2.092 x 10⁸ molecules of GH mRNA in 20 ng of total RNA.
Figure 6- Low-stringency amplicons separated by 1.5% agarose gel elec-trophoresis Lane M: 100-bp DNA molecular weight markers; Lanes 1-3: PCR products using 1.5 mM MgCl2; Lanes 4-6: PCR products using 2.0 mM MgCl2; Lanes 7-9: PCR products using 2.5 mM MgCl2; Lanes 10-12: PCR products using 3.0 mM MgCl2. The 298-bp band (arrow) was used as competitor template.
Figure 7- GH cDNA and the unspecific competitor amplicons separated by 1.5% agarose gel electrophoresis Lane M: 100-bp DNA molecular weight markers; Lanes 1-13: Competitive RT-PCR products using 100 ng, 10 ng, 8 ng, 6 ng, 4 ng, 2 ng, 1 ng, 0.8 ng, 0.6 ng, 0.4 ng, 0.2 ng, 0.1 ng, and 0.01 ng of 298-bp purified DNA as competitor template, and 10 ng of total RNA. The 418-bp band represents the GH mRNA, and the 298-bp band the competitor obtained by low-stringency PCR.
Figure 8- Plotted gDNA/cDNA ratio after amplification, versus competi-tor dilutions added to mixture (100 ng, 10 ng, 8 ng, 6 ng, 4 ng, 2 ng, 1 ng, 0.8 ng, 0.6 ng, 0.4 ng, 0.2 ng, 0.1 ng, and 0.01 ng).
Figure 9- Plotted gDNA/cDNA ratio after amplification, versus competi-tor dilutions added to mixture (0.8 ng, 0.6 ng, 0.4 ng, 0.2 ng, 0.1 ng, 0.01 ng, 0.005 ng, and 0.001 ng), and regression equation.
When this technique is used to quantify gene expres-sion, and quantities are to be compared between two or more animals, an internal control is necessary to normalize qualitative and quantitative differences of the RNA sam-ples, and to check for the RT reaction efficiency, as shown in lane 10 for theβ-actin gene (Figure 10). The negative controls, showed in lane 9, have all RT-PCR reagents, ex-cept RNA or DNA samples.
Discussion
It seemed likely that the concomitant amplification of the 891-bp genomic template and of the 418-bp cDNA would allow to quantify gene expression by using the com-petitive RT-PCR technique with DNA as a competitor (Gillilandet al. 1990). However, since the two fragments had very discrepant lengths, it was not possible to optimize the procedure with good reproducibility and, moreover, heteroduplexes were observed due to sequence similari-ties. This great difference between template sizes of the DNA competitor and the cDNA target with the primer de-signed for this experiment made the optimization of the competitive RT-PCR reaction difficult. Unfortunately, a primer flanking only one intron of the GH gene could not be obtained for this purpose.
The 418-bp band of the cDNA comprises a portion of exon 3, of exon 4, and of exon 5. In addition to these exons, the 891-bp fragment comprises introns 3 and 4; therefore, the exon regions are homologous, allowing heteroduplex formation. To prevent this, the number of PCR cycles should be reduced, or denaturing reagents that can separate partially homologous fragments should be used. None of these alternatives were tried, since this reaction has pre-sented unstable results. For this reason, another competitor was produced.
Another competitor template, with a similar length and a different cDNA sequence, was obtained, to be effi-ciently amplified with the target cDNA. This product was obtained by a low-stringency reaction, allowing a reliable optimization, with good reproducibility, offering an excel-lent strategy for the quantification of pGH gene expression.
The results showed neither unspecific band amplifi-cation, nor heteroduplex formation, which had occurred when the 891-bp fragment was used as competitor tem-plate.
Figure 2 shows that RNA template dilutions from 250 ng to 31.25 ng were adequate to obtain good amplifica-tions of the GH cDNA; however, these diluamplifica-tions were opti-mized for the genomic DNA competitor (891-bp). Therefore, another RT-PCR reaction condition was opti-mized for the low-stringency competitor, with total RNA
concentrations varying from 10 e 20 ng, resulting in good amplifications (Figures 7 and 10).
The competitive RT-PCR experiment was shown to be viable, fast and simple to perform by using a low-stringency DNA competitor, which is in agreement with Gillilandet al.(1990). The use of one-step RT-PCR with standardized reagents, and the use of an internal control, such as theβ-actin gene, allowed us to use DNA as a com-petitor, assuring a good estimate of the gene expression.
This technique proved to be efficient for the quantifi-cation of specific mRNA, demonstrating that this method-ology is suitable for routine studies of gene expression and diagnostics. Our results suggest that it is possible to use this methodology for any pair of primers, and for any gene, since the primers anneal within an exon or in different exons.
Special precaution is recommended regarding the size differences of the cDNA and the competitor template, since they need to be co-amplified with the same efficiency, in the same test tube.
Acknowledgments
We would like to thank Rezende Alimentos SA for the donation of biological specimens.
References
Gilliland G, Perrin S and Bunn HF (1990) Competitive PCR for quantitation of mRNA. In: Innis MA, Gelfand DH, Sninsky JJ and White, TJ (eds) PCR Protocols. A Guide to Methods and Applications. Academic Press Inc. San Diego, Califor-nia 92101. Academic Press Limited, pp 60-69.
Matteri RL and Carroll JA (1997) Somatotroph function in the neonatal pig. Domestic Animal Endocrinology 14(4):241-249.
Nielsen VH and Larsen NJ (1991) Restriction fragment length polymorphisms at the growth hormone gene in pigs. Animal Genetics 22:291-294.
Nielsen VH, Larsen NJ and Agergaad N (1995) Association of DNA polymorphism in the growth hormone gene with basal-plasma growth hormone concentration and production traits in pigs. Journal of Animal Breeding and Genetics 112:205-212.
Schellander K, Peli J, Kneissl F, Schmoll F and Mayr B (1994) Variation of the growth hormone gene in RYR 1 genotyped Austrian pig breeds. Journal of Animal Breeding and Genet-ics 111:162-166.
Vize PD and Wells JRE (1987) Isolation and characterization of the porcine growth hormone gene. Gene 55:339-344. Zimmermann K and Mannhalter JW (1996) Technical aspects of
quantitative competitive PCR. BioTechniques 21:268-279.