RAPOPORT EFFECT IN SOUTH AMERICAN CARNIVORA
(MAMMALIA): NULL MODELS UNDER GEOMETRIC AND
PHYLOGENETIC CONSTRAINTS
DINIZ-FILHO, J. A. F. and TÔRRES, N. M.
Departamento de Biologia Geral, ICB, Universidade Federal de Goiás, C.P. 131, CEP 74001-970, Goiânia, GO, Brazil
Correspondence to: José Alexandre F. Diniz-Filho, Departamento de Biologia Geral, ICB, Universidade Federal de Goiás, C.P. 131, CEP 74001-970, Goiânia, GO, Brazil, e-mail: diniz@icb1.ufg.br
Received November 27, 2001 – Accepted February 13, 2002 – Distributed August 31, 2002 (With 2 figures)
ABSTRACT
Rapoport effect predicts that species geographic range sizes will increase toward higher latitudes, probably reflecting adaptations to extreme climatic conditions that increase species tolerance. Re-cently, studies about spatial patterns in species richness and geographic range size may be associ-ated with the geometry of species’ ranges. In this context, null models can be used to search for the causal mechanisms associated with these patterns. In this paper, we analyzed Rapoport effect using a null model to evaluate how phylogenetic structure and geometric constraints simultaneously affect latitudinal extents of 40 species of South American terrestrial Carnivora. The latitudinal extents of Carnivora tended to decrease toward Southern latitudes, in the opposite direction expected under a simple Rapoport effect, but in accordance to geometric expectations of position of midpoints in the continent. Using 5000 simulations, it was possible to show that the null regression coefficients of latitudinal extents against midpoints are positively biased, reflecting the geometric constraints in the latitudinal extents. The results were equivalent in phylogenetic and non-phylogenetic analyses. The observed regression coefficient was significantly smaller (line is less inclined) than expected by chance alone, demonstrating that the geometric constraints in the latitudinal extents exist even after controlling for phylogenetic structure in data using eigenvector regressions. This suggests that the “spirit” of Rapoport effect (sensu Lyons & Willig, 1997) could be maintained, i.e., that latitudinal extents in
Southern region of the continent are relatively larger than those in Northern regions, even after con-trolling for phylogenetic effects.
Key words: Rapoport effect, null models, Carnivora, geographic range size, latitudinal extent.
RESUMO
Efeito Rapoport em Carnivora sul-americanos: modelos nulos sob restrições geométricas e filogenéticas
entre extensão latitudinal e ponto médio latitudinal, por espécie, são positivamente enviesadas, indicando restrição geométrica. Os resultados são coerentes nas análises filogenéticas (incluindo um autovetor filogenético no modelo de regressão) e não-filogenéticas, indicando que o coeficiente angular observado é significativamente menor do que o esperado de acordo com os modelos nulos. Assim, o “espírito” do efeito Rapoport pode ser mantido, ou seja, as extensões latitudinais nas regiões mais ao sul do continente tendem a ser relativamente maiores do que estas, indicando provavelmente maior tolerância a variações ambientais, mesmo após o controle dos efeitos filogenéticos.
Palavras-chave: efeito Rapoport, modelos nulos, Carnivora, distribuição geográfica, extensão
lati-tudinal.
INTRODUCTION
Rapoport effect predicts that species geogra-phic range sizes will increase toward higher la-titudes, probably reflecting adaptations to extreme climatic conditions that increase species tolerance and, consequently, permit dispersion to larger areas (Stevens, 1989). This controversial biogeographical pattern has been widely discussed in the last few years, specially because of its presumable link with latitudinal gradients in species richness (Stevens, 1989). Despite many recent papers showing that no clear causal link between Rapoport effect and latitudinal gradient exists (Gaston, 1999; Kerr, 1998; Taylor & Gaines, 1999), the pattern of in-crease in geographic range toward higher latitudes and the associated ecological and evolutionary processes explaining it still demands interest by themselves. Gaston et al. (1998) showed that at
least five processes could be involved with this pattern.
Recently, studies about species richness and geographic range size at large scales recognized that spatial variation in these variables may be associated with the geometry of species’ ranges in relation to continental boundaries, the so-called “mid-domain effect” (Colwell & Lees, 2000). These ideas have been particularly stimulated by the application of analytical methods and computer-intensive simulation strategies to generate null mo-dels for variation in species richness and range overlap at large geographical scales (Colwell & Hurt, 1994; Lyons & Willig, 1997; Willig & Lyons, 1998; Lees et al., 1999; Colwell & Lees, 2000). Beyond
trying to predict expected species richness, the recognition of the existence of these constraints ensures that, for some regions of the world, Rapoport pattern could hardly be found by simple geometric effects (Lyons & Willig, 1997).
of null model was called “pseudo-random” null model, in which the latitudinal midpoint is fixed and only geographic ranges are randomized within the geometric constraints. In the pseudo-random model, the idea is that biological characteristics of the species that determine its latitudinal midpoint (related to species niche and other life-history traits) are maintained, and only tolerance around this midpoint is randomized. This is interesting because these non-random patterns of the spatial distribution of the midpoints, that would reflect unique adaptive biological and ecological characteristics of the assemblage under analyses, are taken into account by the null model (see Koleff & Gaston, 2001). But, at the same time, the phylogenetic effects associated with these characteristics are also maintained in the pseudo-random model even after randomizations and, consequently, bias in statistical estimates must be avoided (see Harvey & Pagel, 1991; Blackburn & Gaston, 1998; Diniz-Filho, 2000). For example, a fixed life-history strategy that is conservative within a clade can determi-ne similar midpoints at high latitudes, creating a bias in statistical analyses.
Although some recent papers have included phylogenetic comparative analyses to evaluate Rapoport’s effect using Rohdes’ et al. (1993)
method (see Gaston et al., 1998; Ruggiero, 1999),
no one tested simultaneously how phylogenetic effects and geometric constraints affect randomized geographic ranges. In this paper, we applied a null model based on the original idea of Lyons & Willig (1997), evaluating how phylogenetic structure and geometric constraints affect latitudinal extents of South American Carnivora. To do this, we modified original Rohdes’ et al. (1993) band method and
analyzed randomized extends using a phylo-geographic extension of the phylogenetic eigen-vector regression (PVR) (Diniz-Filho et al., 1998,
1999).
MATERIAL AND METHODS
Data set
The latitudinal extent of the geographic range (latitudinal range) was recorded for each of the 40 species of terrestrial Carnivora (Fissipeds), whose midpoints are in the South American domain, as the difference between southern and northern extremes along latitude. Data were
ob-tained from Eisenberg (1989), Redford & Eisenberg (1992, 1999), Wilson & Reeder (1993) and Emmons (1997). The maximum (potential) latitu-dinal extent associated with each midpoint was obtained, as in Lyons & Willig (1997), as the geographic distance from each midpoint to southern or northern extremes of the continent. Also, since some species are found in the extremes of the continent, there is no need to distinguish between the different ways used by Lyons & Willig (1997) to define maximum potential extents (the entire continent or the distributional maximum extents for the taxon under analysis) (see also Koleff & Gaston, 2001). The phylogenetic relationship for these 40 species was derived from the “supertree” recently constructed by Bininda-Emonds et al.
(1999) for worldwide Carnivora.
Simulations and analyses
Rapoport effect can be measured by distinct methods (see Ruggiero, 1999; Gaston et al., 1998).
In this paper, we simply regressed latitudinal extent against latitudinal midpoint, using then a modification of Rohdes’ et al. (1993) method.
Instead of dividing the continent into bands and estimating the average range of species whose midpoint is within the limits of the class, each latitudinal extent was paired directly with its latitudinal midpoint, which is then equivalent to using very small latitudinal intervals to define the bands (smaller than the average distance between species midpoints). Rohdes’ et al. (1993) method
was used in this paper for two reasons: 1. It avoids spatial autocorrelation of Steven’s (1989) method, that is caused because the large-ranged species are counted repeatedely to estimate average geographic ranges across the latitudinal bands. 2. It possesses higher statistical power (Lyons & Willig, 1997). Our modification of Rohdes’ et al. (1993)
caused by bands whose average estimates of extents are based on a few species (the well-known gradients in species diversity, for example, can produce this effect). On the other hand, our modification also increases the statistical problems caused phylogenetic structure in the analyses because, instead of latitudinal bands, phylo-genetically non-independent species are used individually (see Harvey & Pagel, 1991; Blackburn & Gaston, 1998; Diniz-Filho, 2000).
Random latitudinal extents were then gene-rated for each of the 40 species with fixed latitudinal midpoints (the pseudo-random null model of Lyon & Willig, 1997), and 5000 replicates of this procedure were performed. For each simulation, regression coefficients were then initially estimated simply by regressing the randomized latitudinal extents for each species on their latitudinal midpoints. Under no continental boundaries, an average zero regression coefficient is expected but, since there are limits in the maximum latitudinal extents at a given latitudinal midpoint, a biased positively distribution is ex-pected (we are attributing negative values to southern latitudes). However, as previously discussed, our modification of Rohdes’ et al.
(1993) method can increase bias caused by phylogenetic structure in data that must be taken into account when analyzing data generated by null model.
We used Phylogenetic Eigenvector Re-gression (PVR) (Diniz-Filho et al., 1998, 1999,
2000) to control phylogenetic patterns in data. The PVR starts by obtaining principal coordinates from the phylogenetic distances (D) among species derived from the phylogeny. These principal coordinates are vectors that express the interspecific variation across multivariate phylogenetic space, and are used then as predictors in a standard multiple regression of the form
Y = Vβββββ+εεεεε
where V is the matrix with some of the eigenvectors extracted in principal coordinate analysis of D and βββββ that is the vector with partial regression coefficients. The number of eigenvectors to be used in the analysis can be estimated by analyzing the distribution of eigenvalues by different methods (see Diniz-Filho et al., 2000, and Diniz-Filho,
2000, for computational details).
We then re-analyzed each of the 5000 simulations with a variation of the original PVR method (Diniz-Filho et al., 1999), using as
predictors in the multiple regression both latitudinal midpoints (spatial component), and phylogenetic eigenvectors extracted from D (phylogenetic component), to determine, by the partial regression coefficients, the combined effects of these factors in the latitudinal variation in randomized latitudinal extents.
RESULTS
Latitudinal midpoint
0 2000 4000 6000 8000 10000 12000
–50 –40 –30 –20 –10 0 10
Latitudinal
extent
(km)
Max
imum
latitu
dina
l ext
ent
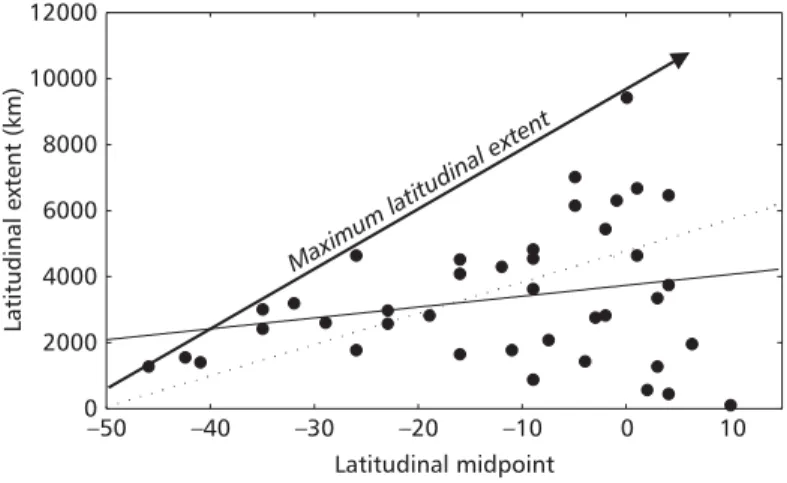
Fig. 1 — Relationship between latitudinal extent and latitudinal midpoint for 40 species of Carnivora in South America. The solid arrow shows the maximum possible extent in the continent (caused by the geometry of the estimate), the solid line indicates the regression line of the real data and the dashed arrow indicates the average regression line across the 5000 simulations. Negative values in the X-axis indicate latitudes in southern hemisphere.
But, more importantly, since we used Lyons & Willig’s (1997) pseudo-simulation model, any phylogenetic structure associated with both latitudinal extent and latitudinal midpoint it can bias these analyses. Eigenanalysis of D matrix
derived from phylogeny revealed that three eigenvectors could be used to express deep time phylogenetic structure in data, according to broken-stick criterion (see Diniz-Filho et al., 1998, 2000,
for details). Including these eigenvectors in the previous regression model (using the observed latitudinal extent as response variable) significantly increased R2 in real data set from 5.6 to 39.4%. Partial regression coefficient of latitudinal midpoint turns to be significantly different from zero (b =
47.14 ± 20.17; p = 0.025) and, out of the three eigenvectors used, only the first one possess significant effect on latitudinal extent (b = 2830.5 ±
693.1: p = 0.00065). The average coefficient of determination of multiple regressions in the simulations was equal to 38.9% (± 10.1%).
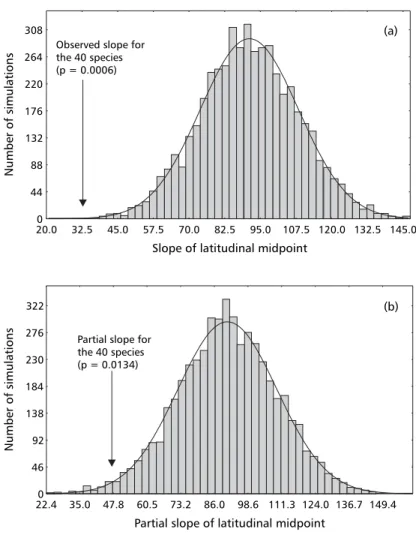
Partial regression slope distribution for spatial (latitudinal) effects, after controlling for phylogenetic structure in data, indicated significant effects in the simulations (Fig. 2b). These partial coefficients are still positively biased, with average regression coefficient equal to 90.8 ± 18.72, and ranging from 22.6 to 160.8, reflecting that geometric constraints in the latitudinal extents exist even after controlling
for phylogenetic structure in data. The probability of obtaining the observed partial regression coefficient estimated for the 40 species from this null distribution was equal to 67/5000 (p = 0.0134). So, the partial regression coefficient for spatial effects is also significantly smaller (the line is less inclined) than expected by chance alone, even after controlling for phylogenetic effects. The increase in Type I error from 0.0006 to 0.0134, when phylogenetic effects were incorporated, did not qualitatively change the conclusions of the analyses, but indicated that, for other datasets with original Type I errors higher than observed here (closer to 5%), conclusions may be changed because part of the variation among simulations can be attributed to phylogenetic effects associated with latitudinal midpoints.
DISCUSSION
The geometry of the continent may impose strong forces limiting geographic range sizes that can counteract ecological and evolutionary pro-cesses invoked to explain Rapoport effect (Gaston
et al., 1998). So, as occurs in other areas of recent
ecological research, null models may be useful to overcome this problem and establish the expected distribution of the statistics under these constraints (see Gotelli & Graves, 1996; Bell, 2001).
Confidence intervals of the null distribution obtained from the simulated data excludes zero (p < 0.05), in such a way that, under simple geometric constraints, the relationship between latitudinal extend and latitudinal midpoints are
usually strongly positive for Neotropics, as predicted by Lyons & Willig (1997). Since the regression coefficient observed for the 40 species of Carnivora was significantly smaller than all simulated regression coefficients (see Figs. 1 and 2a), it is possible to conclude that species in the Southern regions of the continent possess relatively large extents, as expected if the “spirit” of the Rapoport effect could be maintained (Lyons & Willig, 1997). In other words, although the geographic ranges of temperate species (i.e., whose range centered south from 25oS) are, in absolute terms, smaller than those of tropical species, they tend to occupy a greater proportion Slope of latitudinal midpoint
0 44 88 132 176 220 264 308
20.0 32.5 45.0 57.5 70.0 82.5 95.0 107.5 120.0 132.5 145.0
Observed slope for the 40 species (p = 0.0006)
(b)
Partial slope of latitudinal midpoint
0 46 92 138 184 230 276 322
22.4 35.0 47.8 60.5 73.2 86.0 98.6 111.3 124.0 136.7 149.4
Partial slope for the 40 species (p = 0.0134)
(a)
Number
of
simulations
Number
of
simulations
of the total space available to them than the latter ones. Thus, in relative terms, they can be consi-dered to have larger ranges than their northern counterparts.
Since null explanation for spatial pattern in latitudinal extent was rejected after the simulation, the observed pattern is now in agreement with previous results from Ruggiero (1994), supporting ecological and evolutionary processes associated with Rapoport effect in South American Carnivora. Although it is usually difficult to find a primary cause for large-scale biogeographical patterns such as Rapoport effect, most of the mechanisms discussed by Gaston et al. (1998) are based on
interspecific variation in environmental tolerance. It is expected to affect range expansion proces-ses, create differential extinction or impose different biogeographic boundaries structuring in species assemblages (see mechanisms 2, 3 and 5 in Gaston
et al., 1998).
A test of these different, but not mutually exclusive mechanisms, is beyond the scope of this paper. The more important point is that our modification of Rohdes’ et al. (1993) method
permits to incorporate phylogenetic structure in both real and simulated data, since paired variables (i.e., latitudinal extents and midpoints) are measured across species that share distinct ancestor on a phylogenetic scale. So, comparative methods must be used to avoid bias in parameter estimates and correct the inflated Type I errors. In this paper, the results are qualitatively equivalent to the non-phylogenetic analyses, indicating that latitudinal extents in Southern region of South America are relatively larger than those in Northern regions, even after controlling for phylogenetic effects. However, in other datasets, at least part of the variation among simulations can be attributed to phylogenetic effects associated with fixed latitudinal midpoints, that in turn creates a constraint in simulated ranges.
Acknowledgments — The authors wish to thank an anonymous
reviewer for suggestions that greatly improved previous versions of this paper. Our research program on macroecology, biodiversity and quantitative ecology have been continuously supported by the Conselho Nacional de Desenvolvimento Científico Tecnológico (CNPq, proc. 520804/99-6 and 300762/ 94-1, to J. A. F. Diniz-Filho, and PIBIC/CNPq/UFG to N. M. T.) and by FUNAPE/UFG.
REFERENCES
BELL, G., 2001, Neutral macroecology. Science, 293:
2413-2418.
BININDA-EMONDS, O. R. P., GITTLEMAN, J. L. & PURVIS, A., 1999, Building large trees by combining phylogenetic information: a complete phylogeny of the extant Carnivora (Mammalia). Biol. Rev., 74: 143-175. BLACKBURN, T. M. & GASTON, K., 1998, Some methodo-logical issues in macroecology. Am. Nat., 151: 68-83. COLWELL, R. K. & LEES, D. C., 2000, The mid-domain effect: geometric constraints on the geography of species richness. Trends Ecol. Evol., 15: 41-81.
COLWELL, R. K. & HURTT, G. C., 1994, Nonbiological gradients in species richness and a spurious Rapoport effect. Am. Nat., 144: 570-595.
DINIZ-FILHO, J. A. F., 2000, Métodos filogenéticos comparativos. Holos, Ribeirão Preto, 162p.
DINIZ-FILHO, J. A. F., SANT’ANA, C. E. R. & BINI, L. M., 1998, An eigenvector method for estimating phylogenetic inertia. Evolution, 52: 1247-1262. DINIZ-FILHO, J. A. F., ARIAS, M. C. & FUCHS, S., 1999,
Phylogeographic autocorrelation of phenotypic evolution in honey bees (Apis mellifera L.). Heredity, 83: 671-680.
DINIZ-FILHO, J. A. F., COELHO, A. S. G. & SANT’ANA, C. E. R., 2000, Statistical inference of correlated evo-lution among macroecological traits using phylogenetic eigenvector regression. Ecol. Austral., 10: 27-36.
EISENBERG, J. F., 1989, Mammals of the Neotropics.
University of Chicago Press, Chicago,1st vol., 449p.
EMMONS, L. H., 1997, Neotropical rainforest mammals: a field guide. University of Chicago Press, Chicago, 2nd
ed., 323p.
GASTON, K. J., 1999, Why Rapoport’s rule does not generalise. Oikos, 84: 309-312.
GASTON, K. J. & BLACKBURN, T. M., 2000, Pattern and process in macroecology. Blackwell, London, 377p.
GASTON, K. J., BLACKBURN, T. M. & SPICER, J. I., 1998, Rapoport’s rule: time for an epitaph? Trends Ecol. Evol., 13: 70-74.
GOTTELI, N. J. & GRAVES, G. R., 1996, Null models in ecology. Smithsonian Institute Press, Washington, D. C., 368p.
HARVEY, P. H. & PAGEL, M. D., 1991, The comparative method in evolutionary biology. Cambridge University press, Cambridge, 239p.
KERR, J. T., 1998, Weak links: ‘Rapoport’s rule’ and large-scale species richness patterns. Global Ecol. Biogeog., 8: 47-54.
LEES, D. C., KREMEN, C. & ANDRIAMAMPIANINA, L., 1999, A null model for species richness gradients: bounded range overlap of butterflies and other rainforest endemics in Madagascar. Biol. J. Linn. Soc., 67: 529-584.
LYONS, S. L. & WILLIG, M. R., 1997, Latitudinal patterns of range size: methodological concerns and empirical evaluations for New World bats and marsupials. Oikos, 79: 568-580.
MOURELLE, C. & EZCURRA, E., 1997, Rapoport’s rule: a comparative analysis between south and north American columnar cacti. Am. Nat., 150: 131-142.
REDFORD, K. H. & EISENBERG, J. F., 1992, Mammals of the Neotropics. University of Chicago Press, Chicago, 2nd vol., 430p.
REDFORD, K. H. & EISENBERG, J. F., 1999, Mammals of the Neotropics. University of Chicago Press, Chicago, 3th vol., 609p.
ROHDES, K., HEAP, M. & HEAP, D., 1993, Rapoport’s rule does not apply to marine teleosts and cannot explain latitu-dinal gradients in species richness. Am. Nat., 142: 1-16.
RUGGIERO, A., 1994, Latitudinal correlates of the sizes of mammalian geographical ranges in South America. J. Biogeogr., 21: 545-559.
RUGGIERO, A., 1999, Búsqueda de patrones en macroecología: la regla de Rapoport. Ecol. Austral, 9: 45-63.
STEVENS, G. C., 1989, The latitudinal gradient in geogra-phic range: how so many species coexist in the tropics?
Am. Nat., 133: 240-256.
TAYLOR, P. H. & GAINES, S. D., 1999, Can Rapoport rule be rescued? Modeling causes of the latitudinal gradient in species richness. Ecology, 80: 2474-2482.
WILLIG, M. R. & LYONS, S. K., 1998, An analytical model of latitudinal gradients of species richness with an empi-rical test for marsupials and bats in the New World.
Oikos, 81: 93-98.
WILSON, D. E. & REEDER, D. M., 1993, Mammal species of the world: a taxonomic and geographic reference.