Contrast sensitivity to angular
frequency gratings is not higher
than to Cartesian gratings
Departamento de Psicologia, LabVis, CFCH,
Universidade Federal de Pernambuco, Recife, PE, Brasil Y. Zana and
A.C.G.T. Cavalcanti
Abstract
When contrast sensitivity functions to Cartesian and angular gratings were compared in previous studies the peak sensitivity to angular stimuli was reported to be 0.21 log units higher. In experiments carried out to repeat this result, we used the same two-alternative forced-choice paradigm, but improved experimental control and precisionby increasing contrast resolution from 8 to 12 bits, increasing the screen refresh rate from 30 Hz interlaced to 85 Hz non-interlaced, linearizing the voltage-luminance relation, modulating luminance in frequencies that minimize pixel aliasing, and improving control of the subject's exposure to the stimuli. The contrast sensitivity functions to Cartesian and angular gratings were similar in form and peak sensitivity (2.4 cycles per visual degree (c/deg) and 32 c/360º, respectively) to those reported in a previous study (3 c/deg and 32 c/360º, respectively), but peak sensitivity to angular stimuli was 0.13 log units lower than that to Cartesian stimuli. When the experiment was repeated, this time simu-lating the experimental control level used in the previous study, no difference between the peak sensitivity to Cartesian and angular stimuli was found.This result agrees with most current models that assume Cartesian filtering at the first visual processing stage. The discrepancy in the results is explained in part by differences in the degree of experimental control.
Correspondence Y. Zana
Departamento de Psicologia LabVis, CFCH
Universidade Federal de Pernambuco Av. Acad. Hélio Costa, s/n 50670-901 Recife, PE Brasil
Fax: +55-81-3271-8271 E-mail: [email protected]
Research supported by CNPq (Nos. 301290/00-8 and 478384/2001-7).
Received August 20, 2002 Accepted September 5, 2003
Key words
•Contrast sensitivity functions •Cartesian and polar
coordinates
•Radial and angular gratings
Introduction
In 1968 Campbell and Robson (1) sug-gested that the human visual system has groups of independent filters sensitive to a narrow band of Cartesian frequencies and that the contrast sensitivity function (CSF) corresponds to the sensitivity envelope of all these channels. According to this hypothesis, the visual system executes an analysis or a decomposition of an image into its elemen-tary components, a kind of Fourier analysis of the retinal image (2). Accordingly,
detec-tion threshold is determined by the Fourier amplitude of the spatial components, and not by the total contrast of the image.
sym-metrically circular and their luminance would vary as a function of the cylindrical J0 Bessel function. Kelly thought that these stimuli would be more “natural” and provide a fixa-tion center that Cartesian gratings do not offer. It was argued, on mathematical grounds, that the contrast sensitivity to this kind of stimuli would not be different from that to sine gratings. Later, Kelly and Magnuski (4) compared the CSFs to Carte-sian and radial J0 grating stimuli. Surpris-ingly, it was found that the sensitivity to Cartesian gratings was higher than that for radial J0 (except at frequencies below one cycle per visual degree, c/deg). It was specu-lated that the differences in the CSFs could be explained by the circular symmetry or the local contrast variations, both present in the radial J0 stimuli. To identify which of the two factors is responsible for the results, the CSF of radial cosine stimuli was measured. This kind of stimulus was selected because it is circularly symmetric like the J0 stimuli but lacks the local contrast variations. If its CSFs were equal to that of the J0 gratings, it could be concluded that the circular symmetry is responsible for the differences from the Car-tesian gratings. If, on the other end, the CSFs were equal to that of the Cartesian gratings, it could be concluded that the local contrast variations are responsible for the differences in CSFs between the radial J0 and Cartesian stimuli. The result was an intermediate dif-ference and it was concluded that the circu-lar symmetry, as well as the local contrast variations, are responsible for the differ-ences. To explain these results, the stimuli were analyzed into their Fourier spectral components. It was shown that the maxi-mum amplitude Fourier component of radial J0 gratings varied inversely with the fre-quency while that of the Cartesian gratings also varied, but to a lesser extent. The rela-tion between the radial J0 and Cartesian grating maximum amplitude Fourier compo-nent varied as a function of the 1st power, while that of the cosine gratings varied as a
function of the 0.5 power. Similar relations were found between the CSF of the radial J0 or the radial cosine stimuli and the Cartesian gratings. The authors concluded that the de-tection threshold of radial gratings could be explained by a peak detection model.
In 1990 Simas and Dodwell (5) suggested the existence of spatial filters, whose el-ementary stimuli would be defined in angu-lar frequencies, and that are orthogonal to presumed radial Bessel filters. Simas and colleagues evaluated this hypothesis in a series of studies (5-9). They measured the CSF to stimuli defined as angular coordi-nates, such that luminance varied sinusoid-ally with angle within a circle (5,8) and found that the CSF had approximately one log unit gain and plateau peak sensitivity between 13 and 32 cycles. In the second study (8) they also compared the result with the CSF to Cartesian gratings. Interestingly, the peak sensitivity was approximately 0.21 log units lower than that for angular gratings. However, this result is not predicted by the model that assumes that detection threshold is explained by the peak Fourier amplitude of the image, since in angular stimuli the total contrast energy is divided between Fou-rier components of different frequencies and orientations, while in Cartesian stimuli the contrast energy is concentrated in a single Fourier component.
Due to the importance of the issue and the fact that this result has never been reported to have been reproduced by other investigators, we proposed to replicate their experimental design, but with several control improvements, as will be discussed below. The results indi-cate that contrast sensitivity to angular stimuli is lower than that to Cartesian stimuli, as predicted by the peak detection model.
Material and Methods
Subjects and equipment
ex-periments. Both were corrected myopes and practiced prior to data collection. The stimuli were generated on a color monitor by a graphics board used at a resolution of 1024 x 768 pixels at a frame rate of 85 Hz non-interlaced. The graphics board had 256 lu-minance level for each channel. To increase the number of luminance levels available to 4096, the red and blue color channels of the graphics board were attenuated and bined in a resistance network (10). The com-bined monochrome signal was connected to the green input of the monitor to produce a luminance-modulated image. An OptiCAL photometer (Cambridge Research Systems, Rochester, Kent, England) was used to meas-ure the voltage-luminance function, from which the 4096-level look-up table was con-structed. The final linear correlation of the screen luminance was 0.9998. Luminance measurements in the stimuli area guaranteed that spatial non-linearity was below 4%.
Stimulus definition
CSFs were measured for the same two stimulus classes tested previously (8). Al-though Simas et al. (8) did not specify the equations used to generate their stimuli, we used the following equations to generate the gratings, based on their descriptions and ex-amples:
Cartesian stimuli: L(x,y) = L0[1 + csin(2πf u + θ)]
u(x,y) = xcosφ - ysinφ
angular stimuli: L(x,y) = L0[1 + ccos(2πfa + θ)] a(x,y) = tan-1 y
x
where L0 is the mean luminance of the stimuli,
c is the contrast, θ is the phase, f is the spatial frequency, and φ is the grating orientation. Frequencies were between 0.48 and 15.34 c/deg for the Cartesian stimuli and between 2 and 32 c/360º for the angular stimuli. Stimulus phases and orientations were the same as those used previously (8), i.e., verti-cal grating bars and angular gratings with
maximum luminance set to the right. The average luminance of the stimulus was 6.5 cd/m2 and viewing was binocular
from a distance of 105 cm. We set the back-ground luminance at 4.8 cd/m2, since in the
previous study (8) the background luminance was set at approximately 76% of the mean stimulus luminance. Environment illumina-tion was around 0.5 cd/m2.
Procedure
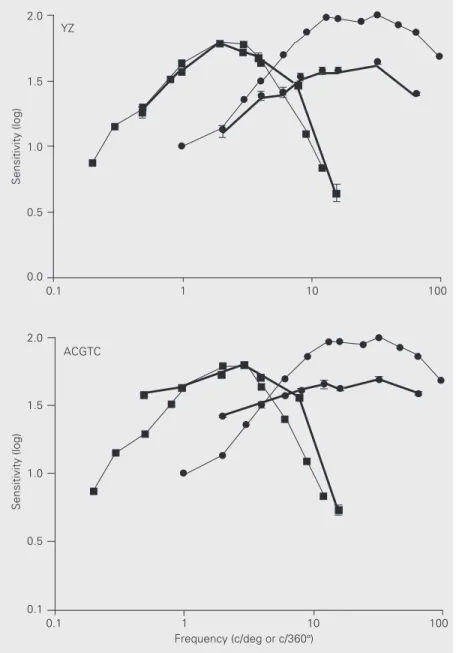
measured for both subjects were similar and the CSFs peaked at approximately 3 c/deg and 32 c/360º for the Cartesian and angular gratings, respectively. Their general form and peak sensitivity location were also simi-lar to those registered in the previous study (8). However, the higher sensitivity to the angular stimuli reported previously was not confirmed: we found that peak sensitivity to angular gratings was on average 0.13 log units lower than to Cartesian gratings for both subjects.
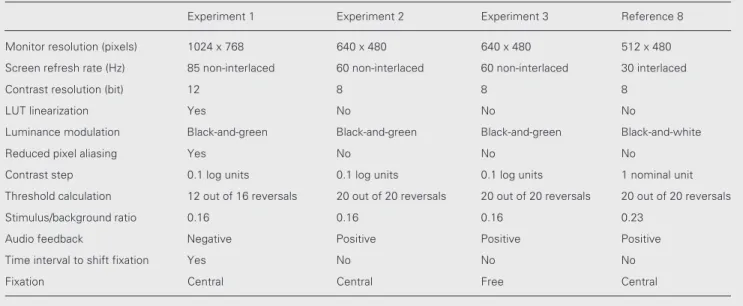
This major discrepancy could be a result of differences in experimental conditions and/or control level (Table 1). In the previ-ous study (8) only 127 contrast levels were available and the voltage-luminance relation was not linearized. Bach and colleagues (12) estimated that under these conditions, in the luminance mid-range, contrast rose approxi-mately 2.0% with each nominal step and not the presumed 0.8%. In the current study this error was minimized by increasing the avail-ability of luminance levels from 256 to 4096, and consequently the number of contrast levels from 127 to 2047, for approximately the same luminance range. In addition, the 4096-luminance level look-up table was lin-earized up to R2 = 0.9998. Temporal and
spatial aspects were also improved. Screen refresh rate was raised from 30 Hz interlaced to 85 Hz non-interlaced, guaranteeing a flicker-free image. Cartesian stimulus fre-quencies were chosen to match the monitor pixel size, which was decreased from 0.028 to 0.016 visual degrees, so as to reduce spatial aliasing. The total number of pixels was also doubled, which is especially sig-nificant for angular stimulus presentation, since luminance is positively correlated with the number of pixels per cycle (13). As angular stimuli contain very high frequency components, they are more susceptible to this physical artifact. In the current study we assured, as mentioned above, that each inter-val was observed for 2 s, giving the subject 1.5 s to shift his fixation from the panel to the Figure 1. Contrast sensitivity for Cartesian (squares) and angular (circles) gratings as a function
of spatial frequency (c/deg or c/360º, respectively) from subjects YZ and ACGTC (thick lines; Experiment 1) and data from Simas et al. (8) (thin lines). Error bars indicate the SEM.
the probability levelof 0.79 (11) was calcu-lated as the mean of the last 12 reversals.
Results and Discussion
Experiment 1
Figure 1 shows the CSFs to Cartesian and angular gratings for the two subjects and as measured by Simas et al. (8). The CSFs
Sensitivity (log)
2.0
1.5
1.0
0.5
0.0
2.0
1.5
1.0
0.5
0.1
Sensitivity (log)
YZ
ACGTC
0.1 1 10 100
0.1 1 10 100
screen monitor and to accommodate his eyes. In the previous experiment, the time taken to change fixation was included in the first interval. Contrast steps were 0.1 log units and threshold calculation was based on the average of the last 12 reversals out of 16 collected. In the previous study (8) one nomi-nal contrast level was used for each contrast change and the threshold was the average of 20 collected reversals. Although the former procedure is faster, and thus easier for the observers, both result in a threshold estimate at the probability level of 0.79 (11,14). Au-dio feedback in the present experiment was modified from positive to negative in order to reduce the general audio stimulation, al-though no significant alteration in the results was expected due to this difference.
There were a few minor differences in experimental conditions due to the limita-tions of our equipment. As a result of the use of the video attenuator, the stimuli were black-and-green luminance modulated, in-stead of black-and-white. This difference is not expected to significantly alter the results, since Van Nes (15) found no difference be-tween the photopic CSFs for red, green or blue light modulation. This result was
ob-Table 1. Comparison of the equipment and conditions in Experiments 1, 2 and 3 and in the experiment conducted by Simas et al. (8).
Experiment 1 Experiment 2 Experiment 3 Reference 8
Monitor resolution (pixels) 1024 x 768 640 x 480 640 x 480 512 x 480
Screen refresh rate (Hz) 85 non-interlaced 60 non-interlaced 60 non-interlaced 30 interlaced
Contrast resolution (bit) 12 8 8 8
LUT linearization Yes No No No
Luminance modulation Black-and-green Black-and-green Black-and-green Black-and-white
Reduced pixel aliasing Yes No No No
Contrast step 0.1 log units 0.1 log units 0.1 log units 1 nominal unit
Threshold calculation 12 out of 16 reversals 20 out of 20 reversals 20 out of 20 reversals 20 out of 20 reversals
Stimulus/background ratio 0.16 0.16 0.16 0.23
Audio feedback Negative Positive Positive Positive
Time interval to shift fixation Yes No No No
Fixation Central Central Free Central
LUT = look-up table.
tained after optical correction for chromatic aberration, but Mullen (16) measured the CSFs of black-and-green and black-and-yel-low modulated stimuli and also found them very similar. A second difference in stimulus configuration between the two studies is the target/background area ratio, i.e., 0.16 as compared to the 0.23 ratio in the previous study. This small difference is not sufficient to explain such an opposite effect in results.
Experiments 2 and 3
lar stimuli. For the calculation of the contrast threshold, we increased the number of rever-sals from 16 to 20 and the final threshold was the average of 20 reversals without any ex-clusion.
In Experiment 1 the subject was instructed to shift his eyes and attention from the dark panel to the screen at the beginning of a new-trial-tone. However, the 1.5-s prestimulus interval was eliminated and the stimulus ap-peared exactly at the beginning of the tone. The only difference between Experiments 2 and 3 was that in Experiment 2 the subject was instructed to fix his eyes on the dot in the center of the screen, like in Experiment 1 and in the previous study (8), and in Experiment 3 the subject was free to move his fixation any-where in the area of the stimuli. Audio feed-back was changed from negative to positive.
Both Experiments 2 and 3 were designed to partially reproduce the lower experimen-tal control of the previous study (8). Experi-ment 3 was done in order to test the hypo-thesis that the different results found by Simas et al. (8) were due to differences in fixation of the stimuli by the subjects.
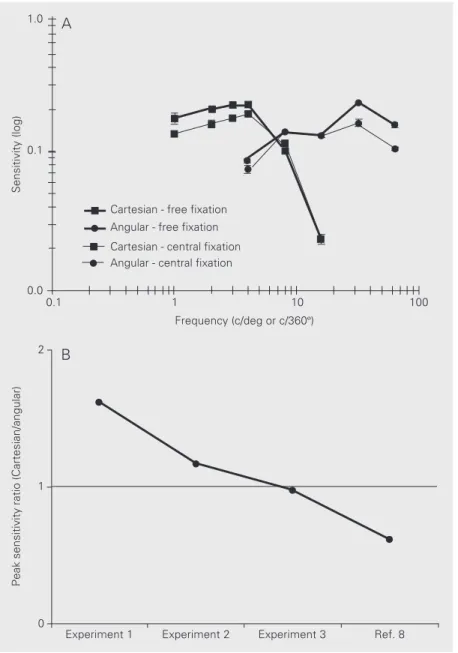
Figure 2A shows the results of Experi-ments 2 and 3. Each point represents the average of three measured thresholds. In both conditions, the Cartesian and angular CSFs had a shape and peak sensitivity loca-tion similar to those obtained in Experiment 1. However, the difference in peak sensitiv-ity between the two stimuli was reduced from Experiment 1 to Experiment 2 and extinguished in Experiment 3. The ratios of the Cartesian and angular peak sensitivity, including that measured by Simas et al. (8) are plotted in Figure 2B. There is a clear shift from higher sensitivity to Cartesian stimuli to angular stimulus dominance. As the only difference between Experiments 1 and 2 was the control level over the experimental con-ditions, it seems that this factor is in part responsible for the opposite effect found by Simas et al. (8). The results of Experiment 3 indicate that the subjects studied by Simas et Figure 2. A, Contrast sensitivity for Cartesian (squares) and angular (circles) gratings as a
function of spatial frequency (c/deg or c/360º, respectively) from subject YZ at lower experimental control with central fixation (thick lines; Experiment 2) and free fixation (thin lines; Experiment 3). Error bars indicate the SEM. B, Ratios of the peak sensitivity to Cartesian and angular stimuli (Cartesian/angular) measured for subject YZ in Experiments 1, 2 and 3, and by Simas et al. (8). The horizontal line is at the level where the peaks of the contrast sensitivity functions are equal.
in Experiment 1, the only exception being the frequencies of the Cartesian gratings, which were set at 1, 2, 3, 4, 8, 16 c/deg. These values were not matched to the pixel size (see Experiment 1), as in the previous study, and introduced some aliasing. No changes were made in the definition of
angu-B
0
Experiment 1 Experiment 2 Experiment 3 Ref. 8 2
1
Peak sensitivity ratio (Cartesian/angular)
Sensitivity
(log)
1.0
0.1
0.0
0.1 1 10 100
Frequency (c/deg or c/360º) A
Cartesian - free fixation
al. (8) may not have fixed their eyes on the dot in the center of the screen during the stimulus presentations.
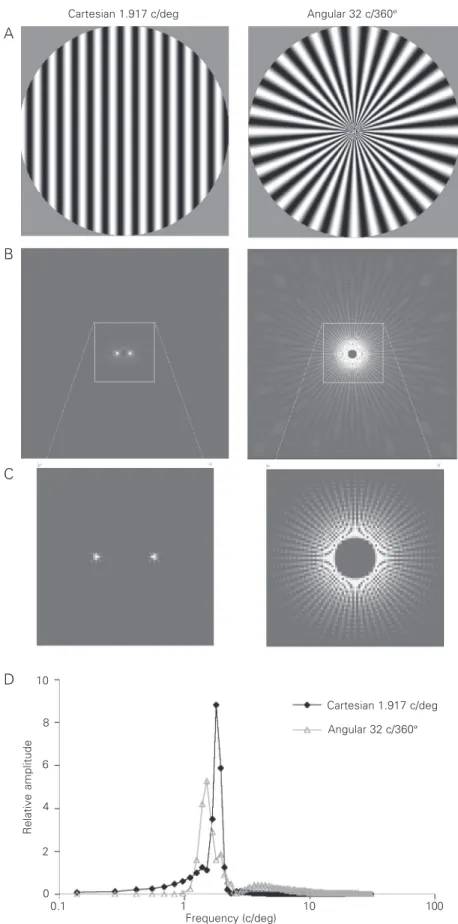
The present study indicates that the peak sensitivity to angular gratings is 0.13 log units lower than to Cartesian gratings. This result is in agreement with the most current models that assume Cartesian filtering at the first visual processing stage and that the CSF is determined by the highest amplitude Fou-rier component. Using as an example the stimuli that showed the highest sensitivity in each coordinate system, we analyzed the amplitudes of the Fourier components in the Cartesian 1.917 c/deg and angular 32 c/360º stimuli. Figure 3 shows these stimuli (A) and their Fourier transformation (B and C). Most of the contrast energy of the Cartesian stimu-lus is concentrated in two points (in a single frequency at one orientation), while those of the angular stimulus are distributed radially and angularly (at different frequencies and orientations). Taking a radial section of the spectrum, we can see that the Cartesian stimu-lus peak amplitude is higher (0.22 log units) than that of the angular stimuli (Figure 3D), according to the contrast sensitivity differ-ence found in Experiment 1.
However, current evidence does not ex-clude polar spatial analysis of suprathreshold stimuli by the human visual system. This idea received substantial psychophysical sup-port in a study of the mechanisms underlying global form perception using Glass patterns (17). The stimuli consisted of a pattern of random dots that generated a percept of a global structure of radial, angular, hyper-bolic and Cartesian patterns. Detection threshold was measured by the addition of
Figure 3. Fourier analysis of the Cartesian and angular stimuli with the highest sensitivity (1.917 c/deg and 32 c/360º, respectively). A, Stimuli that were used in Ex-periment 1, and B and C their two-dimensional am-plitude spectrum. D, Horizontal radial cross-section of the two-dimensional Cartesian and angular stimulus spectra (black and gray lines, respectively).
Relative amplitude
10
8
6
4
2
0
0.1 1 10 100
Cartesian 1.917 c/deg
Angular 32 c/360º
Frequency (c/deg) A
B
C
D
noise. Threshold decreased from Cartesian to hyperbolic, angular and radial patterns. Measurements of the thresholds as a func-tion of the stimulated area showed global pooling (area estimated at 3.5-4.5º) of orien-tation information in the detection of angular and radial Glass patterns, but only local pool-ing in the detection of Cartesian patterns.
These results also agree with several electro-physiological studies such as those by Gal-lant and colleagues (18,19) and Mahon and DeValois (20), where it was shown that popu-lations of cells in LGN, V1, V2 and V4 in monkeys have specific sensitivity to Carte-sian, polar and hyperbolic stimuli.
References
1. Campbell FW & Robson JG (1968). Application of Fourier analysis to the visibility of gratings. Journal of Physiology, 197: 551-566. 2. Robson JG (1975). Receptive fields: neural representation of the
spatial and intensive attributes of the visual image. In: Carterette ED & Friedman MP (Editors), Handbook of Perception. Vol. 5. Academic Press, New York.
3. Kelly DH (1960). Stimulus pattern for visual research. Journal of the Optical Society of America, 50: 1115-1116.
4. Kelly DH & Magnuski HS (1975). Pattern detection and the two-dimensional Fourier transform: circular targets. Vision Research, 15: 911-915.
5. Simas MLB & Dodwell PC (1990). Angular frequency filtering: a basis for pattern decomposition. Spatial Vision, 5: 59-74.
6. Simas MLB, Frutuoso JT & Vieira FM (1992). Inhibitory side bands in multiple angular frequency filters in the human visual system. Bra-zilian Journal of Medical and Biological Research, 25: 919-923. 7. Simas MLB & Frutuoso JT (1997). Inhibitory effects in the detection
of 1 cpd Jo targets superimposed to angular frequency stimuli or sinusoidal gratings. Brazilian Journal of Medical and Biological Re-search, 30: 783-786.
8. Simas MLB, Santos NA & Thiers FA (1997). Contrast sensitivity to angular frequency stimuli is higher than that for sinewave gratings in respective middle range. Brazilian Journal of Medical and Biologi-cal Research, 30: 633-636.
9. Simas MLB & Santos NA (2002). Narrow-band 1, 2, 3, 4, 8, 16 and 24 cycles/360º angular frequency filters. Brazilian Journal of Medical and Biological Research, 35: 243-253.
10. Pelli DG & Zhang L (1991). Accurate control of contrast on micro-computer displays. Vision Research, 31: 1337-1350.
11. Wetherill GB & Levitt H (1965). Sequential estimation of points on a psychometric function. British Journal of Mathematical and Statisti-cal Psychology, 18: 1-10.
12. Bach M, Meigen T & Strasburger H (1997). Raster-scan cathode-ray tubes for vision research - limits of resolution in space, time and intensity, and some solutions. Spatial Vision, 10: 403-414. 13. García-Pérez MA & Peli E (2001). Luminance artifacts of cathode-ray
tube displays for vision research. Spatial Vision, 14: 201-215. 14. García-Pérez M (1998). Forced-choice staircases with fixed step
sizes: asymptotic and small-sample properties. Vision Research, 38: 1861-1881.
15. Van Nes FL (1967). Spatial modulation transfer in the human eye.
Journal of the Optical Society of America, 57: 401-406.
16. Mullen KT (1985). The contrast sensitivity of human colour vision to red-green and blue-yellow chromatic gratings. Journal of Physiolo-gy, 359: 381-400.
17. Wilson HR & Wilkinson F (1998). Detection of global structure in Glass patterns: implications for form vision. Vision Research, 38: 2933-2947.
18. Gallant JL, Braun J & VanEssen DC (1993). Selectivity for polar, hyperbolic, and Cartesian gratings in macaque visual cortex. Sci-ence, 259: 100-103.
19. Gallant JL, Connor CE, Rakshit S, Lewis JW & VanEssen DC (1996). Neural responses to polar, hyperbolic, and Cartesian grating in area V4 of the macaque monkey. Journal of Neurophysiology, 76: 2718-2739.