Contribution for the vulnerability assessment of water pipe network
systems
JORGE PINTO, LUÍS AFONSO, JOÃO VARAJÃO, ISABEL BENTES
Department of Engineering
University of Trás-os-Montes e Alto Douro
Quinta de Prados, 5001-801 Vila Real
PORTUGAL
[email protected], [email protected], [email protected], [email protected]
HUMBERTO VARUM
Department of Civil Engineering
University of Aveiro
Campus Universitário de Santiago, 3810-193 Aveiro
PORTUGAL
[email protected]
ANTÓNIO A.L.S. DUARTE
Department of Civil Engineering
University of Minho
Campus de Gualtar, 4700-057 Braga
PORTUGAL
[email protected]
JITENDRA AGARWAL
Department of Civil Engineering
University of Bristol
Queen’s Building, University Walk, Bristol BS8 1TR, UK
[email protected]
Abstract: - Water pipe network systems are key public utilities which require being robust, protected and
preserved. Knowing their weaknesses will help these processes. The theory of vulnerability of water pipe networks can contribute in this context because it is able to map the vulnerable parts of this type of system. The meaning of vulnerability has been defined as being the disproportionateness of the failure consequences in relation to the initial damage and, in particular, its theoretical concepts.
The main objectives of this paper are to briefly introduce this theory, to illustrate its application highlighting its
potential. The application of the theory is presented using an example of a simple water pipe network.In a real
water supply utility, where the vulnerabilities of WPN components are less evident, the identification of the most vulnerable ones may play an important contribution as support decision during WPN design period and for a sustainable infrastructure asset management.
Further work is in progress to account for different type of damage and consequences and thus manage risks due to failure scenarios not identified by the classical theories.
Key-Words: - W
ater management; water pipe networks, vulnerability, failure scenarios, system safety.
.
1 Introduction
Water supply systems are a structural part of public utilities and as such are vital to the general well-being, public health, safe drinking water use, economic activities and environment protection [1].
Being the water “market” a natural monopoly, the
regulatory action must incorporate the utilities'
economic and service quality assessment based on a benchmarking strategy, guaranteeing the equity, indispensability, feasibility, sustainability and cost-effectiveness principles [2].
Traditionally, an analysis of demand and capacities approach has worked well for most networked systems.
However, with the increasing complexity of systems and the changing nature of demands, that approach is no longer sufficient. There is a need to examine the impact of damage to a system. In this line, a theory of vulnerability has been initially developed, for structural systems [3-6].
The concept of vulnerability is associated with the disproportionateness of the failure consequences in relation to the initial damage. Thus, a structure is more vulnerable when a small damage demand leads to a disproportionately large structural failure. The action which may cause initial damage can be of any type including human error or even a malevolent act committed by vandals, criminals, saboteurs or insiders. Indeed, the effective physical and electronic protections of water supply utilities balance four main safety kinds of procedures: deterrence, detection, delay, and response.
These concepts are applicable to many systems [7]. Recent research has lead to the application of the vulnerability concepts to water pipe networks (WPN). The purpose of this paper is present this emerging theory of vulnerability of water pipe networks (TVWPN). Much of the previous work on pipe network analysis has been on optimization problems. This leads to a maximum flow in a loopless network, but such a network is not necessarily robust.
The theory presented here is fundamentally different in that it focuses on damage events with disproportionate consequences. The TVWPN apart of being able to trace the vulnerable parts of WPN systems also has an additional importance because it is able of measuring the failure consequence of a
vulnerable failure scenario which can then be used to quantify the risk associated to that scenario. The paper is organized as follows. Firstly, the theoretical concepts of TVWPN are identified. Secondly, its application procedure to water pipe networks (WPN) is described. Thirdly, the approach is illustrated through an example. Finally, the main conclusions are drawn.
2 The basic theoretical concepts of
the TVWPN
In the context of this research work, vulnerability has been defined as being the disproportionateness of the failure consequences in relation to the initial damage. This definition is fundamental for the understanding of the TVWPN. A WPN is vulnerable when a small damage demand leads to a disproportionately large WPN failure.
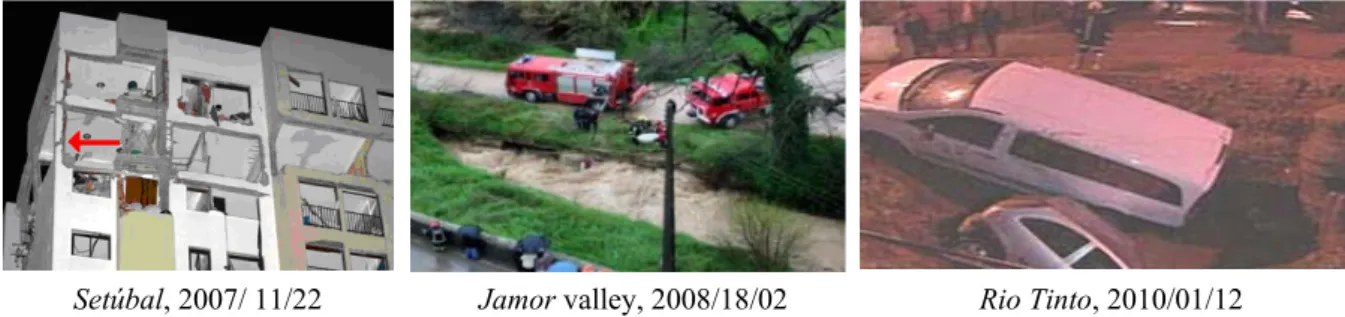
Fig. 1 illustrates three recent real Portuguese cases of vulnerable scenarios. In Setúbal (2007) a gas explosion occurred in a flat causing seriously structural damage in it and also in the surrounding flats in the building block. Heavy rain resulted in the failure of a wall in a water course in Jamor (2008). Recently, the collapse of a pipe of the WPN of
Oporto municipality located in Rio Tinto (2010) had
the following failure consequences: the east part of the Oporto city remained without water supplying temporarily, the Rio Tinto city was flooded, apart from the ground damage in the rupture zone damaging four cars. Fortunately, no injuries were reported.
Setúbal, 2007/ 11/22 Jamor valley, 2008/18/02 Rio Tinto, 2010/01/12
Fig. 1 Recent vulnerable failure scenarios occurred in Portugal
A key concept in the proposed approach is to consider a system as a set of interacting objects. The objects are arranged in layers, connected and interacting in a specific way. At the lowest level, a graph model represents the system in terms of nodes and links. In a WPN system nodes are the joints and links are the pipelines. The basic theoretical concepts of the TVWPN are: WPN leaf cluster, WPN branch cluster, WPN reference cluster, WPN
ring, well formedness, nodal connectivity (η), WPN deteriorating event, WPN damage demand (E),
relative damage demand (Er), separateness (γr),
WPN vulnerability index (φ). These concepts have been defined and implemented in the TVWPN by making a direct extrapolation from the reciprocal concepts used in the structural vulnerability theory [3-6]. A detailed explanation of this extrapolation is delivered in [8].
3 The TVWPN methodology
The application procedure of the TVWPN consists of two main stages: a clustering process and an unzipping process. The clustering process results in a description of a hierarchical model of the WPN for use in the next stage. The unzipping process results in the identification of failure scenarios.
3.1 Clustering process
The clustering process consists of a progressive formation of WPN branch clusters that are tightly connected. It starts at the lowest level by only using primitive clusters (i.e. the pipelines between the adjacent nodes) and finishes, at the highest level, by having the whole WPN, including the storage tanks. It is a selective process that requires five clustering criteria to decide the next WPN branch cluster to be formed at each level of definition.
These five clustering criteria, in order, are the following:
● The minimum total head loss (ΔHTmin);
● The maximum damage demand (Emax);
● The maximum nodal connectivity (ηmax);
● The maximum distance from a storage tank
(DISmax);
● Free choice (FC).
3.2 Hierarchical model
A hierarchical model is an alternative representation of a WPN, being crucial to an effective vulnerability approach. However, the WPN elements (i.e. the joints and pipelines) appear in this model according to the quality of the form of the WPN clusters resulting from the previously applied clustering process.
The formation of a hierarchical model starts from the bottom and then it moves up. New WPN branch clusters are formed during the clustering process and the respective primitive clusters used are clearly identified. Simultaneously, the WPN rings that represent these new WPN branch clusters and the clustering criteria used for the candidate selection are also shown. The part of the WPN that appears at the bottom of the hierarchical model has better form than the other parts appearing higher up in the hierarchy. This model is fundamental for the next stage (i.e. the unzipping process) of the application of the TVWPN.
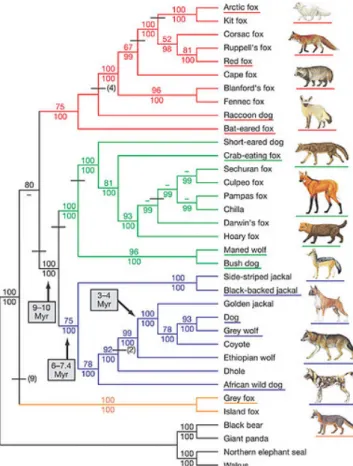
The idea of using a hierarchical model to represent a system was initially inspired on the biological hierarchical models.
Fig. 2 and 3 show two biological hierarchical models in order to exemplify this idea. Meanwhile, Fig. 4 shows a hierarchical model of a real WPN.
Fig. 2 Dog breeding hierarchical model [9]
83 82 97 36 83 82 ? H 94 93 98 50 94 93 ? H 25 26 99 22 25 26 ? H 23 24 10 0 21 23 24 ? H 80 79 10 1 40 80 79 ? H 10 2 90 22 10 3 20 90 22 ? H 21 20 10 4 19 21 20 ? H 32 31 10 5 18 32 31 ? H 10 6 21 10 3 ? H 104 70 71 10 7 48 70 71 ? H 34 33 10 8 17 34 33 ? H 87 86 10 9 38 87 86 ? H 85 11 0 37 85 ? H 10 9 11 1 16 ? H 10 8 105 81 11 2 36 81 ? H 97 35 11 3 17 35 ? H 111 36 15 11 4 14 36 15 ? H 84 11 5 37 84 ? H 110 65 95 11 6 46 65 95 ? H 64 11 7 44 64 ? H 116 11 8 36 ? H 11 5 18 11 9 19 18 ? H 10 4 57 56 12 0 41 57 56 ? H 66 96 12 1 46 66 96 ? H 19 12 2 20 19 ? H 106 88 12 3 38 88 ? H 118 13 12 5 6 13 ? H 11 9 28 12 6 18 28 ? H 113 77 76 12 7 39 77 76 ? H 12 8 45 ? H 12 1 11 7 60 58 13 0 42 60 58 ? H 14 13 1 13 14 ? H 114 27 17 13 2 9 27 17 ? H 75 13 3 35 75 ? H 123 13 4 41 ? H 13 0 120 13 5 6 ? H 122 125 68 69 13 6 47 68 69 ? H 6 8 13 7 5 6 8 ? H 11 13 8 8 11 ? H 13 2 92 13 9 49 98 92 ? H 50 49 14 0 31 50 49 ? H 14 1 48 ? H 52 53 14 2 30 52 53 ? H 30 14 3 16 30 ? H 12 6 41 38 14 4 24 41 38 ? H 54 14 5 29 54 ? H 142 78 14 6 40 78 ? H 101 73 14 7 34 73 ? H 127 16 14 8 14 54 ? H 14 2 40 15 0 24 40 ? H 144 29 15 1 10 29 ? H 13 8 15 2 35 ? H 14 7 133 48 15 3 28 48 ? H 134 9 15 4 5 9 ? H 13 7 45 44 12 4 27 45 44 ? H 43 12 9 26 43 ? H 12 4 46 14 9 26 46 ? H 129 16 0 51 ? H 13 9 91 15 5 8 ? H 13 5 15 1 72 15 6 32 72 ? H 140 15 7 13 ? H 148 15 0 15 8 39 ? H 14 6 152 3 89 15 9 2 3 89 ? H 91 51 16 1 30 51 ? H 14 5 10 16 2 7 10 ? H 15 4 16 4 89 ? H 16 0 14 9 74 16 5 35 74 ? H 158 12 16 6 6 12 ? H 15 5 16 7 31 ? H 161 15 6 16 8 12 ? H 166 143 67 16 9 46 67 ? H 12 8 5 17 4 3 5 ? H 159 62 63 17 0 43 62 63 ? H 7 17 3 11 7 ? H 162 17 1 47 ? H 169 14 1 55 16 3 28 55 ? H 13 4 17 2 24 ? H 16 3 15 7 47 42 17 5 25 47 42 ? H 17 6 32 ? H 167 165 4 17 7 4 4 ? H 168 17 8 26 ? H 16 4 17 5 39 18 2 23 39 ? H 172 1 2 18 0 1 2 ? H 59 61 18 3 59 61 ? H 17 9 44 ? H 171 170 18 1 12 ? H 174 173 37 18 4 15 37 ? H 17 7 18 5 32 ? H 176 17 8 18 6 2 ? H 181 180 18 7 43 ? H 17 9 183 18 8 9 ? H 18 4 182 18 9 25 ? H 185 188 19 0 7 ? H 18 5 18 8 19 1 12 ? H 19 0 187 0 19 2 0 ? H 19 1 87 22 99 100 ? H 1 42 112 13 6 107
Fig. 4 An example of a real WPN hierarchical model [11]
3.3 The unzipping process
The unzipping process uses the hierarchical model of a WPN as the basis to search for the vulnerable failure scenarios in the WPN. The hierarchical model is unzipped from the top to the bottom focusing on all the existing WPN branch clusters. Each WPN branch is unzipped in turn by introducing deteriorating events until a WPN branch cluster or the whole WPN becomes totally inoperative.
After every deteriorating event, the WPN branch cluster changes and, therefore, it becomes necessary to re-cluster and to define a corresponding new hierarchical model of the damaged WPN branch cluster. This indicates that the unzipping is an iterative process and also an interactive process because it also requires interacting with the clustering process.
An ordered sequence of deteriorating events resulting from this process defines a vulnerable failure scenario.
For the guided search of failure scenarios, the unzipping criteria, in order of application, are the following:
• A cluster is not the reference cluster (storage
tank), NR;
• It connects directly to the reference cluster, CD;
• It is a leaf cluster (a pipeline) rather than a WPN
branch cluster, LC;
• It has a higher value of head loss, S∆H;
• It has the smallest damage demand, SE;
• It was clustered the latest, CL;
• Free choice, FC.
At this stage of the research, for simplicity, the damage to the reference cluster (storage tank) is not included.
If a pipeline connects directly to the storage tank then it is likely that its loss will result in a disproportionate failure consequence. It is possible to identify a deteriorating even in a leaf cluster (i.e. a pipeline) rather than a branch cluster.
This process allows reducing enormously the number of possible failure scenarios (NFC) to analyze that may occur in a WPN.
Instead of NFC measured by equation 1, the possible number of NFC using this process is a maximum as the number of branch clusters defined during the clustering process.
(1) where,
n is the number of primitive clusters (pipes) An
p is the simple combination of the n sections p
to p.
3.4 Failure scenarios
Through the unzipping process, several failure scenarios of a WPN are identified. Of these, the following are important:
• Total failure scenario is the one where least effort is required for the whole WPN to become inoperative (e.g. there is no water supply to any point). Among the identified failure scenarios
with separateness equal to 1, the total failure scenario is the one that has highest value of vulnerability index (φ);
• Maximum failure scenario is the one that results in maximum damage from the least effort. Among the failure scenarios found, the maximum failure scenario is the one that has the highest value of φ. The maximum failure scenario is related to the most vulnerable part of a WPN;
• Minimum failure scenario is related to the least well formed part of a WPN and, in general, corresponds to the last leaf cluster to be clustered in the clustering process;
• Minimum demand failure scenario is related to the weakest part of a WPN to suffer damage. It corresponds to the leaf cluster that has the smallest value of damage demand;
• Interesting failure scenario is the one in which the responsible for the network design is specifically interested for local reasons, such as sensitivity to particular usage.
4 Application example
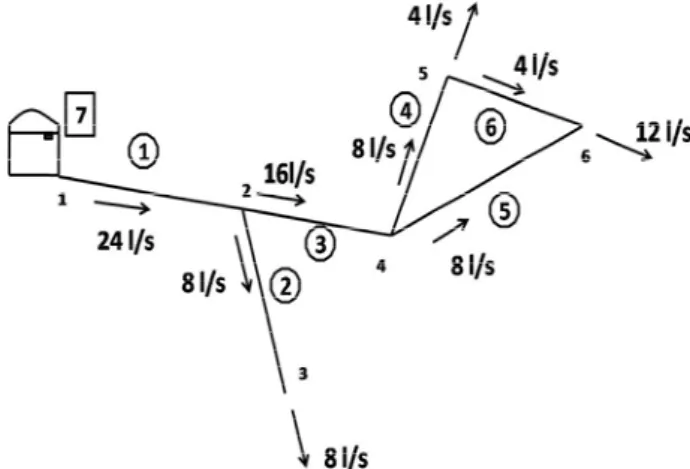
In order to illustrate the application of the TVWPN, the WPN shown in Fig. 5 is used as an example. It is formed by 6 pipelines, 6 joints and 1 storage tank. It is kept simple for the ease of explanation of the procedure.
Fig. 5 Lay-out of the water supply system (example)
The material for all the pipelines is the polyvinyl chloride (PVC), assuming a roughness coefficient of 0.01 mm and a nominal service pressure of 0.6 MPa. The relevant geometric (pipe’s length and diameter) and hydraulic (flow and head loss) parameters of the WPN is presented in Table 1. The flow and the head loss values resulted from the hydraulic design of the WPN previously done.
Table 1: Geometric and hydraulic data of the WPN
Leaf
cluster Joints
Length (m)
Flow
(L.s-1) Diameter (mm) lossHead (m)
1 1 ; 2 500 24 200 1.68 2 2 ; 3 600 8 125 2.67 3 2 ; 4 400 16 160 1.89 4 4 ; 5 300 8 125 1.33 5 4 ; 6 500 8 125 2.22 6 5 ; 6 400 4 110 0.94
Table 2 shows the clustering process, step by step, for the presented WPN example (Fig. 5).
Table 2: Data related to the clustering process
Step Candidates Head loss (m) Damage demand (E) (MPa) Nodal connectivity (η) Distance from storage tank (DiS) New branch cluster 1 + 2 4.35 0.6 + 0.6 1 0 1 + 3 3.57 0.6 + 0.6 3 0 2 + 3 4.56 0.6 + 0.6 3 500 3 + 4 3.22 0.6 + 0.6 4 500 3 + 5 4.11 0.6 + 0.6 4 500 4 + 5 3.56 0.6 + 0.6 2 900 4 + 6 2.28 0.6 + 0.6 2 900 8 1 + 2 4.35 0.6 + 0.6 1 0 1 + 3 3.57 0.6 + 0.6 3 0 9 2 + 3 4.56 0.6 + 0.6 3 500 3 + 5 4.11 0.6 + 0.6 4 500 3 + 8 4.17 0.6 + 1.2 3 500 5 + 8 4.50 0.6 + 1.2 1 900 2 + 9 6.24 0.6 + 1.2 2 0 5 + 9 5.79 0.6 + 1.2 3 0 5 + 8 4.50 0.6 + 1.2 3 900 10 8 + 9 5.84 1.2 + 1.2 3 0 2 + 9 6.24 0.6 + 1.2 2 0 11 9 + 10 8.07 1.2 + 1.2 1 0 5 10 + 11 10.74 1.8 + 1.8 0 0 12 6 7 + 12 --- --- --- --- 13 1 2 3 4 Black and grey lines represent leaf and branch clusters, respectively. The second column of Table 2 shows the existing candidates of new branch-clusters in each step. In the first step, the candidates include exclusively leaf clusters (or primitive clusters). In the other steps, they can include leaf or branch clusters. For each of the candidates the vulnerability measures of total head loss (∆H), damage demand (E), nodal connectivity (η) and distance from the storage tank (DiS) are quantified. In each step, a new branch clusters is formed by applying the clustering criteria which depend on the above measures. Fig. 6 shows schematically the clustering process, step by step, performed according to the sequence given in Table 2.
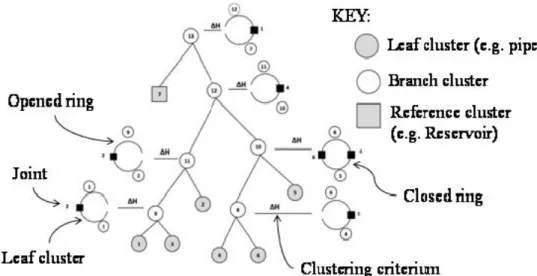
Based on the information obtained during the clustering process, the hierarchical model of the WPN used as an example is presented in Fig. 7, as well as, the identification of the applied clustering criterion in each step.
a) Step 1: forming branch cluster 8 (4+6) b) Step 2: forming branch cluster 9 (1+3)
c) Step 3: forming branch cluster 10 (5+8) d) Step 4: forming branch cluster 11 (2+9)
e) Step 5: forming branch cluster 12 (10+11)
f) Step 6: forming branch cluster 13 (7+12)
Fig. 6 Clustering process of the WPN (example)
Fig. 7 Hierarchical model of the WPN (example)
As it was stated above during the unzipping process each WPN branch is unzipped in turn by introducing deteriorating events until that WPN branch cluster or the whole WPN becomes totally inoperative.
Fig. 8 shows this process of searching for vulnerable failure scenarios of the WPN used as an example. Branch clusters 13, 11, 10, 9 and 8 are unzipped, in turn.
a.1) Branch cluster 13 a.2) Unzipping path a.3) Failure scenario: T1
Similar to a.3)
b.1) Branch cluster 11 b.2) Unzipping path b.3) Failure scenario: T1
c.1) Branch cluster 10 c.2) Unzipping path c.3) Failure scenario: T4→T5
Similar to a.3)
d.1) Branch cluster 9 d.2) Unzipping path d.3) Failure scenario: T1
e.1) Branch cluster 8 e.2) Unzipping path e.3) Failure scenario: T4→T6 Fig. 8 Unzipping process of the WPN (example)
Each branch cluster has represented the respective extended reference cluster (when it is necessary) which means the effect of the rest of the WPN on that branch cluster (Fig. 8-a.1, 8-b.1, 8-c.1, 8-d.1 and 8-e.1). The unzipping path and the unzipping applied criterion are also identified in each case (Fig. 8-a.2, 8-b.2, 8-c.2, 8-d.2 and 8-e.2).
During the unzipping of each branch cluster it is also necessary to use new clustering processes until that branch cluster or the WPN becomes totally inoperative (this is the stage of the unzipping process in which a failure scenario is found). This means that the unzipping process is interactive with the clustering process. The failure scenario found for each branch cluster is presented in Fig. a.3, 8-b.3, 8-c.3, 8-d.3 and 8-e.3.
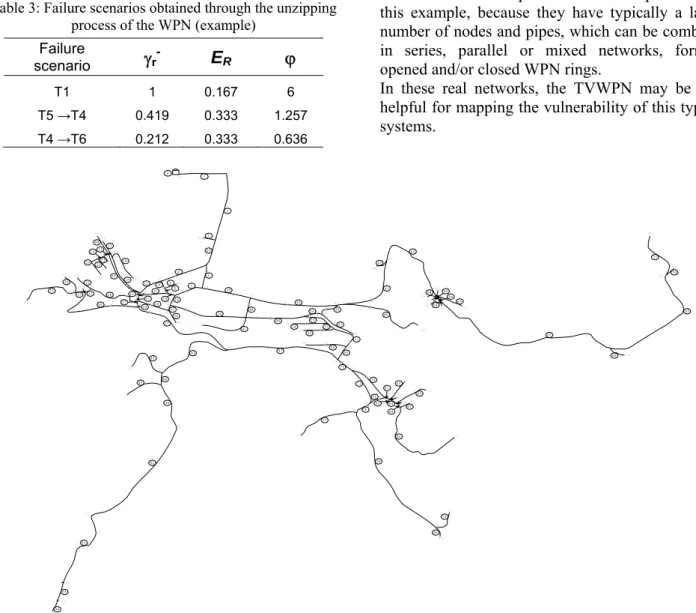
Table 3 summarizes the results of the unzipping process showing the vulnerable parameters associated to each failure scenario.
Table 3: Failure scenarios obtained through the unzipping process of the WPN (example)
Failure
scenario
γ
r-E
Rϕ
T1 1 0.167 6
T5 →T4 0.419 0.333 1.257 T4 →T6 0.212 0.333 0.636
Finally, based on this information it is possible to identify the vulnerable failure scenarios of the WPN used as an example, which are:
• The total and maximum failure scenarios are to damage pipe nº 1 (T1);
• The minimum failure scenario is to damage pipe nº 2 (T2);
• The minimum demand failure scenario is to damage one of the pipes of the WPN studied (T1, T2, T3, T4, T5 or T6), since they have the same value of E (0.6 MPa).
The above results confirm the evidence that the WPN used as an example is more vulnerable in the part close to the storage tank. This evidence results from the fact that the WPN is strategically simple for the sake of comprehension of the methodology. However, real WPN (see the case of S. Miguel de Rodrigues village network in Fig. 9, for instance) are much more complex than the one presented in this example, because they have typically a larger number of nodes and pipes, which can be combined in series, parallel or mixed networks, forming opened and/or closed WPN rings.
In these real networks, the TVWPN may be very helpful for mapping the vulnerability of this type of systems. 2 7 2 6 4 9 5 0 1 2 3 4 5 7 3 9 4 0 5 9 4 8 3 8 1 4 1 7 2 1 2 0 1 9 2 4 2 6 2 3 2 2 2 5 3 5 3 4 3 0 3 3 3 1 2 8 3 2 1 8 2 9 2 7 1 1 6 1 2 1 6 1 5 3 6 3 7 4 2 4 3 4 4 4 5 4 6 7 1 7 0 6 9 6 8 6 7 6 4 6 6 6 5 6 3 6 2 6 1 6 0 5 8 5 7 5 2 5 3 5 4 5 6 5 1 5 0 4 9 4 7 7 2 7 3 7 4 8 2 7 7 7 6 7 5 8 1 8 4 8 5 8 7 8 6 8 8 7 8 7 9 8 0 9 1 0 8 4 1 1 3 9 0 5 5 8 3 8 9 9 2 9 3 9 4 9 6 9 5 2 5 5 1 2 4 1 4 1 3 1 5 1 7 1 6 1 8 3 9 3 4 3 3 3 2 3 1 3 0 2 9 2 8 4 1 4 2 1 2 1 1 3 4 5 7 9 1 0 6 1 9 1 2 4 3 4 4 4 5 4 6 4 7 4 8 4 0 8 3 8 3 7 3 6 3 5 2 0 2 1 2 2 2 3 9 1 5 2 5 3 5 4 5 6 7 1 7 2 7 3 7 4 7 5 7 6 7 8 7 7 6 9 6 8 6 7 7 9 8 1 8 2 8 3 8 6 8 5 8 4 8 0 5 7 5 8 5 9 6 0 6 1 6 2 6 3 6 4 6 6 5 5 7 0 6 5 8 7 8 8 0 8 9
So, when the vulnerabilities of WPN components are less evident, the identification of the most vulnerable ones may play an important contribution as support decision during WPN design phase, as well as for a sustainable infrastructure asset management.
In this context, an accurate decision support algorithm must be developed for assisting with the establishment of infrastructure investment plans. Deterioration point assignment (DPA) methods are partially suitable for application to systems characterized by a lack of pertinent information, which is typically the situation in small water supply
utilities [12].
Mathematical models are well known as useful tools for water management practices, directly or indirectly related to the implementation of the Water Framework Directive (WFD) in European countries, namely to support water supply sources monitoring and for the simulation of anthropogenic pressures
and impacts over the aquatic ecosystems [13].
Therefore, it is essential to correlate monitoring data and modelling information with a continuous feedback, in order to optimize both the monitoring network and the simulated management scenarios
[14].
Future developments of this emerging theory (TVWPN) must consider assets life cycle analysis and the influence of water quality (like pH,
alkalinity, CO2 concentration) on pipe walls, in
order to include erosion and incrustation phenomena.
5 Conclusions
The theory of vulnerability of water pipe networks was briefly presented. Its main purpose is to identify the most vulnerable parts of a water pipe network and thus indirectly to increase the robustness of this kind of systems and its quality. It will allow taking mitigation measures. Mapping the vulnerability of a water pipe network will also contribute for the management of this type of systems.
The hierarchical model representation of a water pipe network plays an important role in the theory. It is an abstract way of representing a water pipe network in which the system is arranged in a well formedness base. It is a result of the clustering process and the base of the unzipping process. The unzipping process is an iterative and interactive process from which the vulnerable failure scenarios are found.
The application of the theory has been illustrated through a simple water supply network.
The results obtained for the example are the expected ones. However, the potential of this theory lies in the identification of inherent weaknesses in a real water pipe network. Further work is in progress to account for different type of damage and consequences and thus manage risks due to failure scenarios not identified by the classical theories.
References:
[1] Duarte, A.A.L.S., Rodrigues, G.M.C, Ramos, R.A.R. (2009). A global service quality index to evaluate the performance and sustainability in water supply utilities. WSEAS Transactions
on Environment and Development, 5, (12),
pp. 759-769.
[2] Duarte, A.A.L.S., Rodrigues, G.M.C., Ramos, R.A.R. (2009) Effect of criteria weighting methods on the ranking of water suppliers’
performance. Energy, Environment,
Ecosystems, Development & Landscape Architecture, WSEAS Press, Proceedings of the 5th International Conference on Energy,
Environment, Ecosystems and Sustainable Development (EEESD’09), September, 28-30,
Athens, Greece.
[3] Lu Z., Yu Y., Woodman N.J., Blockley D.I., (1999). A theory of structural vulnerability, The
Structural Engineer, 77, (18), pp. 17-24.
[4] Agarwal J., Blockley D.I., Woodman N.J. (2001). Vulnerability of 3-dimensional trusses,
Structural Safety, 23, (3), , pp. 203-220.
[5] Pinto J.T. (2002). The risk of a vulnerable
scenario. PhD Dissertation, University of
Bristol, UK.
[6] Pinto J.T., Blockley D.I., Woodman N.J. (2002). The risk of vulnerable failure,
Structural Safety, 24, pp. 107-122.
[7] Agarwal J., Blockley D.I., Woodman N.J. (2001). Vulnerability of systems, Civil
Engineering and Environment Systems, 18,
pp. 141-165.
[8] Pinto, J. T., Varum, H., Bentes, I., Agarwal, J. (2010). A Theory of Vulnerability of Water Pipe Network (TVWPN), Water Resources
Management (in press, available online at
http://www.springerlink.com/content/x0240l60 77428716/) [9] CAES (http://evolutionarymodel.com/evoprocess.htm accessed on May, 2010): [10] http://www.answers.com/topic/cell-division (accessed on May, 2010):
[11] Bastos, C. (2008). Applying the theory of
structural vulnerability to a water supply
network system. MSC Thesis, University of
Trás-os-Montes e Alto Douro, Vila Real,
(in portuguese).
[12] Barata, P., Alegre, H., Vieira, J.M.P.
(2008). Appication of a DPA Method for
Asset Management in Small Water
Distribution Systems. Water Asset
Management International. IWA
Publishing. 4, (4), pp. 2-7.
[13] Duarte A.A.L.S., Boaventura R.A.R. (2008). Pollutant Dispersion Modelling for Portuguese River Water Uses Protection linked to Tracer Dye Experimental Data. WSEAS Transactions
on Environment and Development, 4, (12), pp.
1047−1056.
[14] Duarte, A.A.L.S., Vieira, J.M.P. (2009) Estuarine hydrodynamic as a key-parameter to control eutrophication processes. WSEAS
Transactions on Fluid Mechanics, 4, (4),
![Fig. 4 An example of a real WPN hierarchical model [11]](https://thumb-eu.123doks.com/thumbv2/123dok_br/15970088.1101249/4.892.163.731.106.460/fig-example-real-wpn-hierarchical-model.webp)