Influence of sociodemographic factors on eating motivations –
modelling through artificial neural networks (ANN)
Raquel P. F. Guiné
a*, Ana Cristina Ferrão
a, Manuela Ferreira
a, Paula
Correia
a, Mateus Mendes
b, Elena Bartkiene
c, Viktória Szűcs
d, Monica
Tarcea
e, Marijana Matek Sarić
f, Maša Černelič-Bizjak
g, Kathy Isoldi
h,
Ayman EL-Kenawy
i, Vanessa Ferreira
j, Dace Klava
k, Małgorzata
Korzeniowska
l, Elena Vittadini
m, Marcela Leal
n, Lucia Frez-Muñoz
o, Maria
Papageorgiou
pand Ilija Djekić
qaCI&DETS Research Centre, Polytechnic Institute of Viseu, Viseu, Portugal;
bPolitechnic Institute of Coimbra-ESTGOH and ISR, University of Coimbra, Portugal; cDep. of Food Safety and Quality, Lithuanian University of Health Sciences, Kaunas, Lithuania; dDirectorate of Food Industry, Hungarian Chamber of Agriculture,
Budapest, Hungary; eDep. of Community Nutrition & Food Safety, Univ. of Medicine, Pharmacy, Science and Technology, Targu-Mures, Romania; fDep. of Health Studies, University of Zadar, Croatia; gFaculty of Health Sciences, University of Primorska, Slovenia; hDep. of Nutrition, School of Health Professions and Nursing, Long Island University, USA; iMolecular Biology Dep., Genetic Eng. and Biotechnology Institute, University of Sadat City, Egypt; jDep. of Nutrition, Faculty of Biological & Health Sciences, UFVJM University, Minas Gerais, Brazil; kFaculty of Food Technology, Latvian University of Agriculture, Jelgava, Latvia; lFaculty of Biotechnology and Food Science, Wrocław University of Environmental and Life Sciences, Poland; mDepartment of Food Science, University of Parma, Italy; nSchool of Nutrition, Faculty of Health Sciences, Maimonides University, Argentina; oFood Quality and Design Group, Wageningen University & Research, The Netherlands; pAlexander Technological Educational Institute, Dep. Food Technology, Thessaloniki, Greece; qFaculty of Agriculture, University of Belgrade, Serbia
*Corresponding author: Raquel P. F. Guiné, Escola Superior Agrária de Viseu, Quinta da Alagoa, Estrada de Nelas, Ranhados, 3500-606 Viseu, Portugal, Tel: + 351 232 446 640; Fax: +351 232 426 536, E-mail: [email protected]
Published article / Citation:
Guiné RPF, Ferrão AC, Ferreira M, Correia P, Mendes M, Bartkiene E, Szűcs V, Tarcea M, Sarić MM, Černelič-Bizjak M, Isoldi K, EL-Kenawy A, Ferreira V, Klava D, Korzeniowska M, Vittadini E, Leal M, Frez-Muñoz L, Papageorgiou M, Djekić I (2020) Influence of
sociodemographic factors on eating motivations – modelling through artificial neural networks (ANN). International Journal of Food Sciences and Nutrition, 71(5), 614–627.
Author
version
Abstract
This study aimed at investigating the influence of some sociodemographic factors on the eating motivations. A longitudinal study was carried conducted with 11960 participants from 16 countries. Data analysis included t-test for independent samples or ANOVA, and neural network models were also created, to relate the input and output variables. Results showed that factors like age, marital status, country, living environment, level of education or professional area significantly influenced all of the studied types of eating motivations. Neural networks modelling indicated variability in the food choices, but identifying some trends, for example the strongest positive factor determining health motivations was age, while for emotional motivations was living environment, and for economic & availability motivations was gender. On the other hand, country revealed a high positive influence for the social & cultural as well as for environmental & political and also for marketing & commercial motivations.
Keywords: food choice; healthy diet; neuronal modelling; cross-cultural survey
Introduction
In developed societies there is a tendency to adopt a diet characterized by a high-fat and cholesterol, high-protein, high-sugar, and excessive salt intake, as well as frequent consumption of processed and fast foods (Manzel et al. 2013). This dietary pattern, associated with other unhealthy behaviours, such as for example tobacco use and a lack of physical activity, is one of the major risk factors for the presence of noncommunicable diseases (NCDs), including diabetes, heart disease, stroke and cancer (World Health Organization 2018a). According to estimates from the World Health Organization (2018b), NCDs are the leading cause of mortality worldwide, killing 41 million people each year, corresponding to 71% of all deaths globally.
Eating is not only determined by physiology, but also by many other factors that interact in a complex way to shape individual eating habits (World Health Organization 2018a). People’s food choices are influenced by determinants of varied nature, such as
sociodemographic factors, biology, health, emotions, society and culture, convenience, price, ethical concerns, environmental aspects, political contexts, studies or nutrition knowledge, to cite the most relevant (Kullen et al. 2016; Cunha et al. 2018). In sum, food-related decisions depend on the person’s cultural traditions, socioeconomic status, beliefs and values, marketing influences, as well as psychological and physiological factors (Rozin 2007; Köster 2009; Sobal & Bisogni 2009). Moreover, the food choice process is dynamic, meaning that it changes during a person’s lifetime and varies from person to person and also from situation to situation (Monteleone et al. 2017). Thus, given the impact that diet has on health and the urgency to change dietary habits, it is crucial to understand the motivations that influence people’s food choices, so that actions can be developed to improve people’s eating habits.
Artificial neural networks (ANN) are quantitative models inspired by the neural architecture of the brain and one of the tools that can be used to explore consumer choice. ANN models have been used in almost every aspect of food science to predict the consumer behavioural patterns and to model the consumer decision-making process (Huang et al. 2007; Kennedy et al. 2016). ANNs comprise a group of nonlinear regression and discrimination statistical methods that possess predictive capacity. ANNs are computational systems designed to mimic some properties of the biological neurons, and these computer programs have become very popular due to many advantages such as, for example: non-linearity, adaptation, generalization, model independence, easy to use and high accuracy (Song et al. 2017; Torkashvand et al. 2017). This technique produces numerical estimation by simulating the brain learning and memorizing processes. It is a potent tool that learns based on the experimental input variables and looks for the relations that interconnect the input with the output variables (Lai et al. 2016). Therefore, ANN has been widely and successfully used in various fields to predict the influence of some
targeted variables (inputs) on the investigated outputs (Zeković et al. 2017). In recent years, there is greater interest in using neural networks as problem solving algorithms which can perform mapping, regression, modelling, clustering, classification and multivariate data analysis. ANNs are highly flexible, which makes them ideal to solve highly non-linear problems and deal with any kind of data. Owing to its adaptability, ANN methods have been successfully employed by numerous researchers to model and predict many different processes from the engineering to the social points of view (Huang et al. 2007; Dębska & Guzowska-Świder 2011; Kennedy et al. 2016).
The EATMOT project (“Psycho-social motivations associated with food choices and eating practices”) is a multinational study involving 16 countries (Argentina, Brazil, Croatia, Egypt, Greece, Hungary, Italy, Latvia, Lithuania, Netherlands, Poland, Portugal, Serbia, Slovenia, Romania and United States of America) and aims to investigate the different psychological and social motivations that determine people’s eating patterns in relation to their choices or eating habits. The main goal of the present research was to evaluate in what way some sociodemographic factors can influence the participants’ food choices. More specifically, the aim was to study the relative influence of some sociodemographic variables like age, gender, marital status, education, professional area, country or living environment on different types of eating motivations, on a complete approach, by addressing multiple factors up to now most of them analysed separately, though the development of a new questionnaire.
Description of observational study
Questionnaire
The EATMOT project uses a questionnaire that was developed to investigate the extent in which the psychological and social motivations can influence both food choices and
eating patterns in a total of 16 countries. In the first stage, the questionnaire was prepared and validated for a study carried out only in Portugal (Ferrão, Guine, Correia, Ferreira, & Lima, 2019), and then it was translated into the native languages of the participating countries, following a back-translation methodology.
The questionnaire structure included different sections, aiming to gather information considered relevant for the study: Part I – Sociodemographic data; Part II – Anthropometric data and behavioural and health related facts; Part III – Attitudes relating to healthy food; Part IV – Sources of information about a healthy diet; Part V – Health motivations; Part VI – Emotional motivations; Part VII – Economic and availability motivations; Part VIII – Social and cultural motivations; Part IX – Environmental and political motivations; Part X – Marketing and commercial motivations.
In order to measure the motivations that defined the participants’ food choices, a 5-point Likert scale: 1 - strongly disagree, 2 - disagree, 3 - neither agree nor disagree, 4 - agree and 5 - strongly agree (Likert, 1932) was used to rate each of the 49 statements included in the study as eating motivations, distributed by 6 major groups as shown in Table 1. To measure the extent to which the participants were influenced by eating motivations, a variable was considered accounting for the sum of all items included in each of the subgroups (HE – health motivations; EM – emotional motivations; EC&AV – economic and availability motivations; SC&CL – social and cultural motivations; EN&PO – environmental and political motivations; MA&CO – marketing and commercial motivations). These variables were then transposed into a % scale, varying from -100% (not at all motivated) to 100% (strongly motivated), in which the value 0 stands for neutral, corresponding to the middle point of the scale.
Table 1. Number of items used to measure the motivations for food choices.
Type of motivations Nº of
statements
Health motivations (HE) 10
Emotional motivations (EM) 9 Economic and availability motivations (EC&AV) 7 Social and cultural motivations (SC&CL) 9 Environmental and political motivations (EN&PO) 7 Marketing and commercial motivations (MA&CO) 7
Data collection
This descriptive cross-sectional study was carried out on a non-probabilistic convenience sample with 11,960 participants distributed by the 16 participating countries as follows: Argentina (4%), Brazil (6%), Croatia (13%), Egypt (7%), Greece (4%), Hungary (4%), Italy (5%), Latvia (5%), Lithuania (4%), Netherlands (5%), Poland (5%), Portugal (11%), Romania (7%), Serbia (4%), Slovenia (9%), United States of America (7%).
The questionnaire was approved by the Ethical Committee in the leading country (Reference nº 04/2017) and then transposed to the other countries for application. The data collection occurred in all participating countries between September 2017 and June 2018. The questionnaires were applied by direct interview after verbally informed consent was obtained only to adults (aged 18 or over). The data collection occurred in different towns and villages, and the sample included people from different sectors of the population, from both genders, with different education levels, covering a wide range of ages and corresponding to different marital status, in order to be as much as possible representative of the target population. Still, it must be noted that that the sample selection might be responsible for some differences between groups that otherwise could not reflect the trend in the general population (Hunt & Madhyastha 2008; Madhyastha et al. 2009).
All ethical issues were verified when formulating and applying the questionnaire. The confidentiality of the individual answers was also guaranteed to comply with ethical principles, so that it is impossible to associate a specific answer to one individual, because no identifying information was collected.
Before treating the data, this was submitted to a scrutiny and only valid questionnaires were considered to include in further analysis. Questionnaires with a high percentage of missing answers were rejected as well as those for which the basic sociodemographic variables were not indicated. Also, for each question was inspected the distribution of the scales so that only responses with valid answers were considered. After this procedure, resulted 11,960 valid questionnaires, from the original set of 12,145 questionnaires answered.
Statistical analysis
Basic statistical tools were used for exploratory data analysis. Furthermore, statistical tests were applied to verify whether the mean values were statistically different between groups. For comparisons between two groups t-test for independent samples was used, while for comparisons between three groups, Post-Hoc Tukey HSD (Honestly Significant Difference) was used, coupled to an analysis of variance (ANOVA). Data analysis was made with SPSS (version 25) from IBM Inc. and in all tests the level of significance considered was 5%. The threshold of p < 0.05 was established having in consideration that, although some authors claim that a lower threshold of 0.5% might improve evidential strength when applied to novel works and increase replicability, these effects are not well established and the definition of a lower significance level could have both, positive and negative consequences (Lakens et al. 2018).
Modelling through artificial neuronal networks
Artificial neural networks are computational models, inspired by the architecture of the human brain, used for machine learning and data mining applications.
Neural models
The basic neural unit used in the present work is the perceptron, which has a number of inputs and one output. The output value of the perceptron is a mathematical function that depends on the weighted sum of the input values. To calculate the output, the value of each input is multiplied by a corresponding weight, as well as possibly summed to a bias value. The sum of the weighted inputs and bias is adjusted through some
mathematical function to generate the output. The output of each neuron is, therefore, proportional to the values of the weighted inputs. Neurons are trained by adjusting the weights given to the input variables, in a way that the error between the neuron’s expected output and the measured output value is minimized during a training process, in which the network is exposed repetitively to known inputs and outputs. In order to model complex processes in more detail, neurons can be coupled in layers. In the present work the models used had one hidden layer and one output layer.
The weights learnt by neural network during training reflect the contribution of each variable for the output of each neuron: the more important variables receive the larger weights, while the less important variables receive small or zero weights. So the network generalizes and abstracts a data model that can be analysed to determine, on average, the relative importance of each variable. After the training process, the analysis of weights of the neurons gives a wealth of information about correlations existing in some types of datasets, such as the present questionnaire. Olden and Jackson (2002) proposed a method, known as the Connection Weight Approach (CWA), which allows
calculating a score to each input variable in a neural network. The score is a measure of the contribution of each input to the output: the higher is the score, the more important is the contribution of the variable to the output in that specific model.
Architecture of the ANN used
The ANN used was a feed-forward model, created using Matlab (Mathworks) fitnet function. A sigmoidal transfer function, was used for neurons in the hidden layer, because it is a universal approximator. A linear transfer function was used for the output layer. Training was performed using the Levenberg-Marquartd method. The Mean Squared Error (MSE) method was used for performance assessment. Performance of the models was also assessed calculating the correlation coefficient between values
predicted by neural networks and results obtained.
For simplicity of analysis, each output variable was studied separately. An ANN model was created for predicting each output variable, so that the simplest models could be obtained without interference between different output variables.
The number of neurons in the output layer is defined by the number of output variables. In the present work each neural model had just one output. To determine the number of neurons in the hidden layer, however, there is no general rule. Too less neurons may lead to poor models, while too many neurons can lead to excess processing requirements and over-fitting of the model to the train examples. In this work all models were tested with 1-30 neurons in the hidden layer for each output variable. Each
simulation, for each input variable, started with a model containing just one hidden neuron, then 2 hidden neurons, then 6 and more in steps of two up to 30 neurons in the hidden layer. Each model was trained and simulated also 30 times and the best 6 results were kept, while the remaining 24 results were discarded.
Characterization of the datasets and variables
A dataset was created for data analysis using neural networks by coding all
questionnaire answers. The results were pre-processed using a Python script, in order to prepare the inputs and outputs in a way that could be used for the neural models. Age was used as an integer value. The other input variables were represented as boolean values: two booleans for gender, three for level of education, sixteen for country, three for living environment, four for marital status and seven for area of work. Therefore, the input vector for each neural model had a total of 36 inputs. For each run, the Matlab script randomly selected approximately 70 % of the samples for train subset, 15 % for validation subset and the remainder samples were used for test subset.
The result of the learning process in feedforward backpropagation neural networks depends on some initial random values. Namely, the convergence of the model can be faster, slower or even totally impaired depending on the initial weights and bias of each neural connection, as well as the subset of samples selected for training, testing and validation. Therefore, the final results obtained usually differ between experiments, because the starting point and data may also differ.
The best neural network models will produce the best correlations between values predicted by the neural network and the desired output, as well as the smallest errors between output expected and output obtained. In the present work, performance of the models was measured using the correlation coefficient (r) and Mean Squared Error (MSE).
For better confidence in the analysis, a set of runs were performed. For each output variable, 30 different models were trained, for each hidden layer size. The results were
sorted by correlation coefficient, r, from best to worst. The six best models were then selected for further analysis.
Results and discussion
Sociodemographic sample characterisation
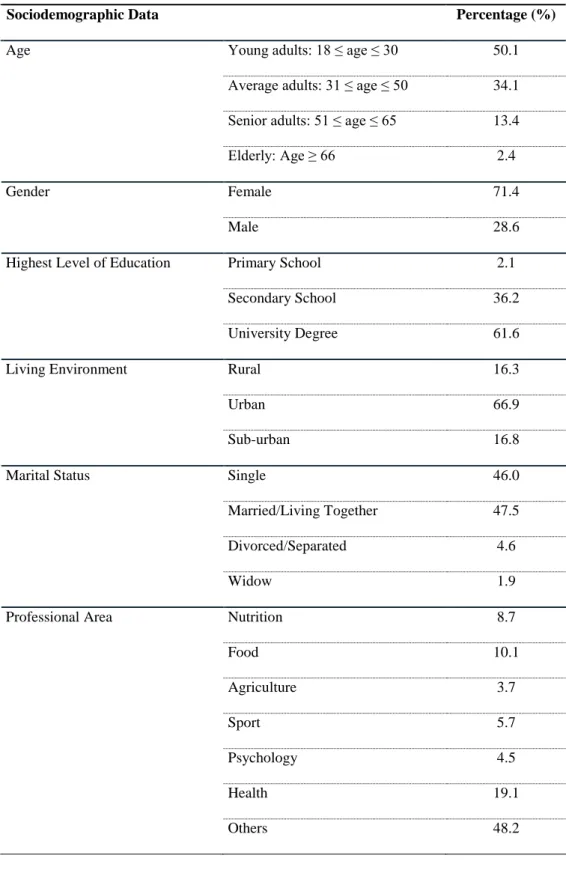
Table 2 shows that from the 11,960 participants included in the sample the majority, 50.1% were young adults aged between 18 and 30 years, 34.1% were middle-aged adults (31 ≤ age ≤ 50), and a smaller fraction were senior adults (13.4%) or elderly (2.4%). The majority were female (71.4%) and two thirds of participants had completed a university degree (61.6%). The living environment was in high prevalence urban (66.9%), with participants from rural or sub-urban areas equally represented (about 16% in both cases). Forty-six percent of the participants were single and 47.5% were married. Regarding the professional area, about half of the sample did not have a professional activity and/or area of study related to the specific areas addressed in the questionnaire. The participants with a professional link to health represented 19.1%, followed by those related to food (10.1%) and then nutrition (8.7%).
Table 2. Sociodemographic characteristics of the studied sample.
Sociodemographic Data Percentage (%)
Age Young adults: 18 ≤ age ≤ 30 50.1 Average adults: 31 ≤ age ≤ 50 34.1 Senior adults: 51 ≤ age ≤ 65 13.4 Elderly: Age ≥ 66 2.4
Gender Female 71.4
Male 28.6
Highest Level of Education Primary School 2.1 Secondary School 36.2 University Degree 61.6
Living Environment Rural 16.3
Urban 66.9
Sub-urban 16.8
Marital Status Single 46.0
Married/Living Together 47.5 Divorced/Separated 4.6
Widow 1.9
Professional Area Nutrition 8.7
Food 10.1 Agriculture 3.7 Sport 5.7 Psychology 4.5 Health 19.1 Others 48.2
Sociodemographic factors affecting eating motivations
Figure 1 shows the results obtained for the influence of age on eating motivations, with more detailed information presented in Appendix (Table A.1). Age appeared as an influential variable for all the types of eating motivations considered, as indicated by values of significance of the ANOVA test, however, the level of influence is low, as shown by the values of eta-squared regarding effect size. For health motivations, all scores were positive, indicating that people tend to think about health aspects in general when making their food choices. Furthermore, the values increased with increasing age, so that as people grow older they tend to be more concerned with health issues. This is natural as a way to prevent age related pathologies that tend to appear in advanced adulthood or old age (Lozano et al. 2019). As for emotional motivations, they were not very pronounced in general, with negative or near zero values, indicating that emotions were not found so important in determining peoples’ dietary patterns. Nevertheless, they were significantly higher for the young adults as compared to all other age groups. According to Lazarevich et al. (2016) emotion management in young adults is so important that it should be taken into account as a means to prevent and treat obesity. Regarding economic & availability motivations, they were more pronounced for young adults and elderly, although with low values (6.06 and 8.25%, respectively). These results may be linked to higher stability of middle-aged and senior adults as compared with young adults, still with a less stable job and/or personal life, or with the elderly, retired and with lower mobility or accessibility to food. Regarding social & cultural motivations or marketing & commercial, they were not found to importantly determine the food choices, given the negative values obtained, even though there were significant differences between the ages groups (p<0.05). As for the environmental & political motivations, they were found as important factors affecting the eating choices of the participants, and most particularly for those aged over 50 years. Sustainable consumption
aims to optimize the environmental along with social and economic consequences of purchase, usage and disposal of the goods so as to guarantee the needs of both current as well as future generations (Balderjahn et al. 2018). Some socio-demographic variables have been found to underlie as determinants for environmental friendly food purchase, although the reported influences were not always consistent (Annunziata et al. 2019).
Figure 3. Eating motivations by age group. (Legend for eating motivations: HE = health, EM = emotional, EC&AV = economic and availability, SC&CL = social and cultural, EN&PO = environmental and political, MA&CO = marketing and commercial)
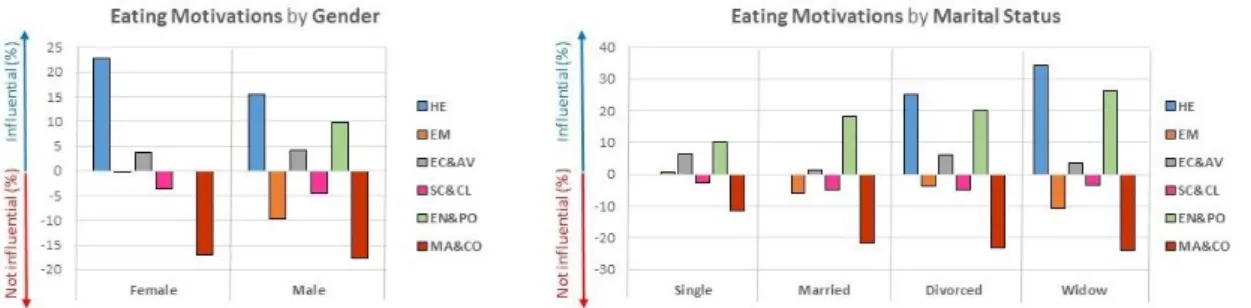
The influence of gender on the eating motivations is shown in Figure 2 and in Table A.1. It can be seen that the eating motivations in women were more pronounced when the health was concerned (22.69%) followed by the environmental and political concerns (16.73%) with significant differences as compared to men (15.48% and 9.78%, respectively). Documented evidence suggests that women are more inclined to buy environmental friendly foods than men (Shashi et al. 2015) and also tend to adopt behaviours aimed at improving and/or maintaining a good health status, as compared to men (MacBride-Stewart et al. 2016). The differences between genders were not
statistically significant for the economic & availability or the marketing & commercial motivations.
Figure 2. Eating motivations by gender and marital status. (Legend for eating motivations: HE = health, EM = emotional, EC&AV = economic and availability, SC&CL = social and cultural, EN&PO = environmental and political, MA&CO =
marketing and commercial)
Marital status was seen as significantly influencing the eating motivations (Figure 3 and Table A.2), namely the health and also the environmental & political, with the widowed showing more concerns in both cases as compared with other groups and the single showing the lowest influence. The widowed are in general older people, and therefore it is expected that they might pay more attention to diet as a means to prolong health (Wang et al. 2018). On the other hand, in the work by Vecchio et al. (2016) the marital status was seen as influencing intentions of purchase of environmental friendly foods.
Figure 3. Eating motivations by country. (Legend for eating motivations: HE = health, EM = emotional, EC&AV = economic and availability, SC&CL = social and cultural, EN&PO = environmental and political, MA&CO = marketing and commercial; country
codes: AR = Argentina, BR = Brazil, HR = Croatia, EG = Egypt, GR = Greece, HU = Hungary, It = Italy, LV = Latvia, LT = Lithuania, NL = Netherlands, PL = Poland, PT =
Portugal, RO = Romania, RS = Serbia, SI = Slovenia, US = United States)
The level of influence of geographical factors like country and living environment on eating motivations was also studied. While for some countries there is a marked influence of health determinants on food choices, (Portugal, 38,27% or Lithuania, 31.28%) for others the influence is low (Netherlands, 2.58% or USA, 6.04%) (Figure 3 and Table A.2). As for emotional motivations, the differences between countries are also very marked, ranging from -14.68% (not influential) for Serbia to +13.98% (influential) for Egypt. A similar variation was observed for economic & availability motivations (range from -9.30% to +25.85% for Poland and Latvia, respectively) and for social & cultural motivations (range from -20.59% to +15.80% for Hungary and Egypt, respectively). As for economic & availability motivations they revealed negative scores for practically all countries, with the exception of Egypt, meaning that the participants were not much influenced by advertising or promotions when choosing or buying food. Environmental & political motivations were important when deciding what to eat, particularly for participants from Portugal (38.40%) or Italy (31.60%). The differences
between countries for all types of eating motivations considered were statistically significant. Table A.2 further reveals that living environment also significantly influenced eating motivations, with people from urban areas showing the highest level of influence of health motivations (21.88%), although followed closely by those living in rural areas (21.29%). On the other hand, people from rural areas showed to be more influenced by economic & availability or by environmental & political motivations (Figure 4). According to Lozano et al. (2019), dietary, social, and health patterns are deeply linked to area of residence, since metropolitan and rural lifestyles vary considerably. Usually, in developed countries, people residing in rural areas tend to have healthier patterns, including adoption of healthier dietary patterns (Öztürk et al. 2011).
Figure 4. Eating motivations by living environment and level of education. (Legend for eating motivations: HE = health, EM = emotional, EC&AV = economic and availability, SC&CL = social and cultural, EN&PO = environmental and political,
MA&CO = marketing and commercial)
The level of education is known to influence people’s choices in general and food choices in particular (Vecchio et al. 2016; Nicholson et al. 2018; Luesse & Contento 2019; Biondi et al. 2019). However, in our study that was not so evident, since increasing education level did not imply a regular pattern over the different types of motivations considered (Figure 4 and Table A.3). For example, people with primary school and with
a university degree tended to be driven by health motivations when making food choices (23.07% and 22.53%, respectively), while for the participants with intermediary level of education (secondary school) the score was lower (17.24%). Nevertheless, the differences observed were statistically significant for all types of motivations investigated.
Figure 5 and Table A.3 show the influence of the area of studies or work on eating motivations. Health motivations were stronger for people whose work/studies was linked to sports (24.49%) or health (21.48%) and less important for people from psychology (13.67%), when comparing the different professional groups. Emotional motivations were also stronger for people from sports (6.96%) and lower for people from agriculture, with a negative score meaning that it was not influential (-8.13%). Economic & availability motivations were stronger for people from sports (7.31%) and lower for people from nutrition (0.63%). Sports was once more the area for which the score was higher (6.44%) for social & cultural motivations, whose minimal score was -4.02% for participants whose job/studies were related to health. While environmental & political motivations were important for all, particularly for those associated with agriculture (16.38%), marketing & commercial motivations were not important for all and most especially for those linked with nutrition. From the above results, participants who were sports’ professionals gave a considerable importance to health or emotions as well as other eating motivations, which may be linked to the need to improve competitive performance (Schulenkorf & Siefken 2018) and to the emotions associated with sport, either individually or as a team (Lee & Finn 2007).
Figure 5. Eating motivations by professional area. (Legend for eating motivations: HE = health, EM = emotional, EC&AV = economic and availability, SC&CL = social and cultural, EN&PO = environmental and political, MA&CO = marketing and commercial)
ANN Modelling of the eating motivations
To measure the extent to which the participants’ eating motivations were influenced by the sociodemographic factors considered, an artificial neuronal modelling was performed following the procedure described earlier.
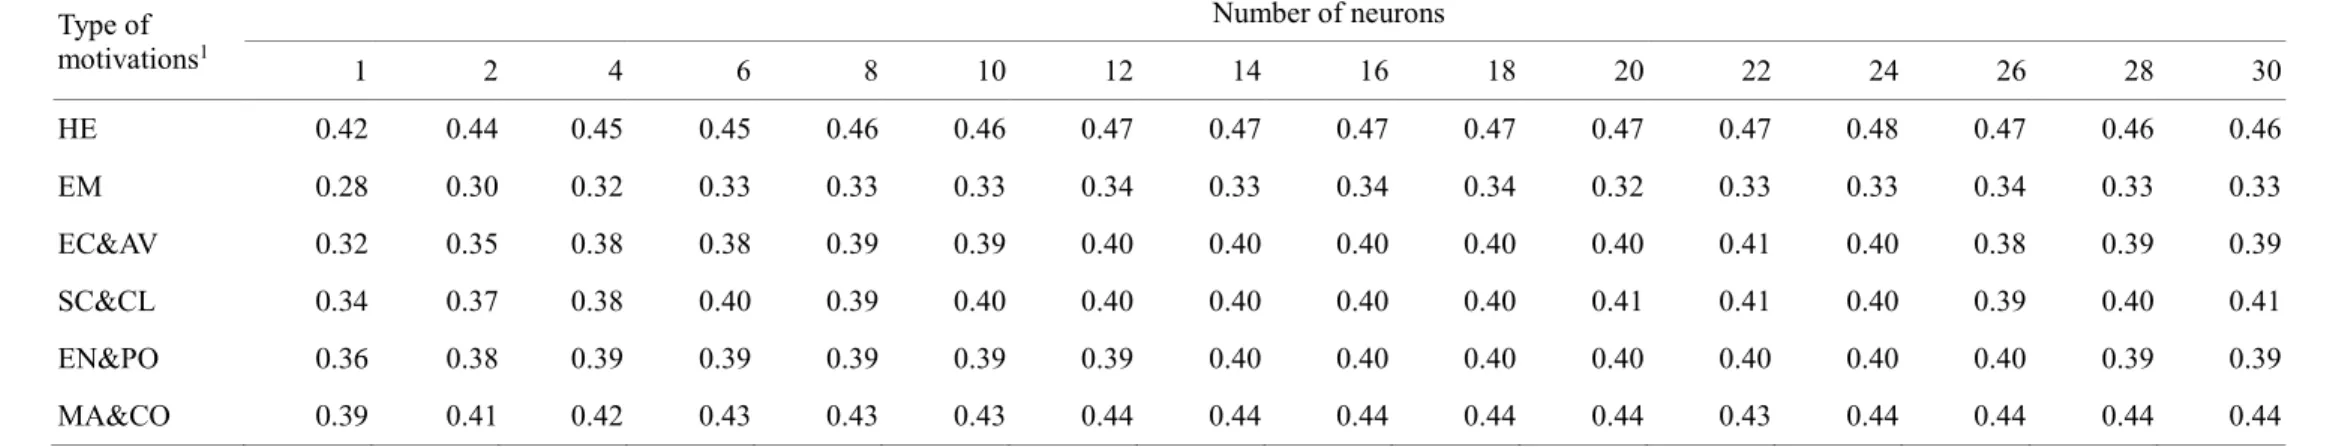
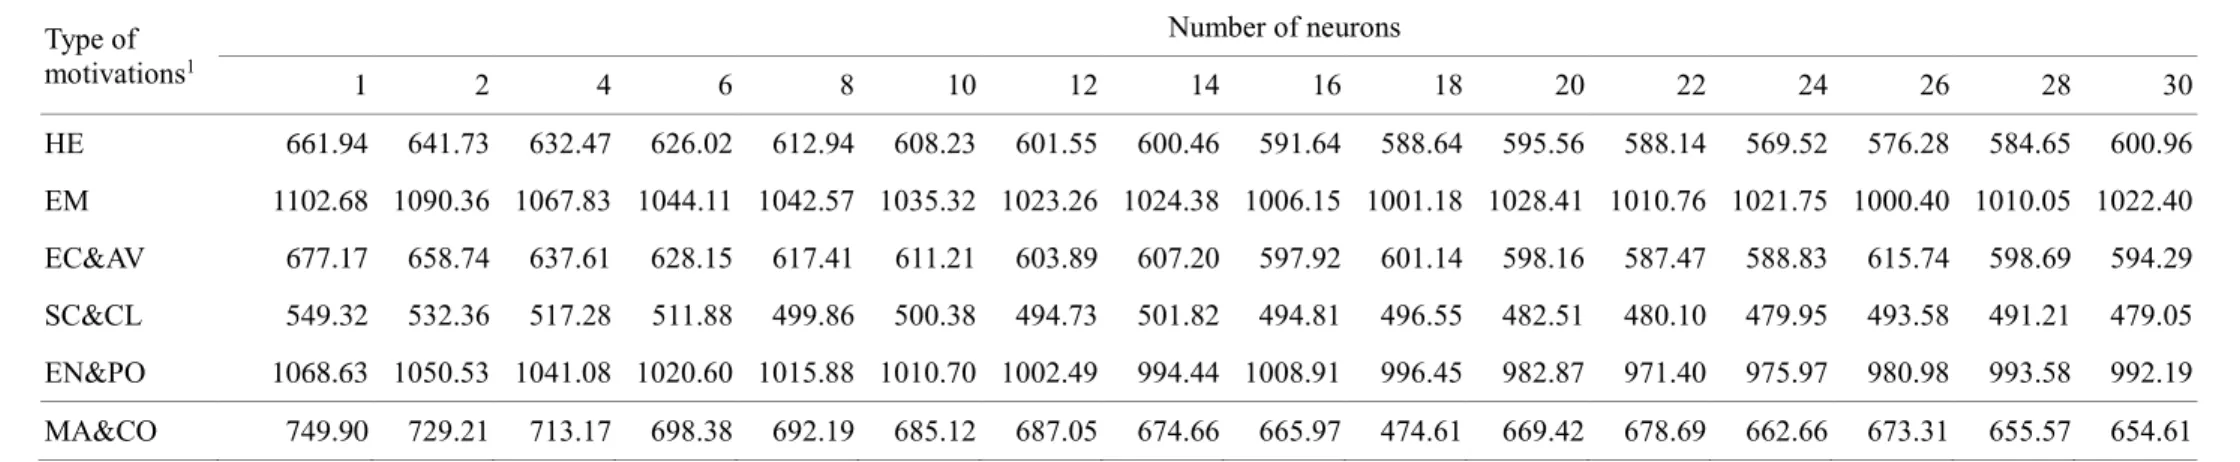
Table 3 shows the average correlation coefficient (r) of each of the models tested, for each output variable, varying the number of neurons in the hidden layer. If a model was perfect, it would show r=1, meaning that it could predict exactly the importance of each output variable based on the questionnaire answers, for each person. However, due to the variability of data, the average r varies between 0.34, for emotional motivations, and 0.48, for health motivations. This shows that there was more consensus regarding health motivations than any of the other motivations, with emotional motivations being the most difficult to model. Table 4 shows the MSE for the same models as in Table 3.
The results for health and marketing & commercials motivations improved with adding more neurons until 24 neurons were used in the hidden layer. For emotional
motivations, the results only improved until 12 neurons in the hidden layer, which also shows there was less information to retain.
Tables 5, 6 and 7 show the neuron weight scores for each input variable, calculated using Olden and Jackson’s CWA algorithm, as described in Section 2.4.1 above. Using CWA, the contributions of each variable through the neural paths are summed together and represented by a unique score, which is easier to analyse than looking at all the synapses at the same time. The tables also show R calculated for each subset of the dataset, namely train, test and validation, and then to all dataset.
Table 3. Average values of regression coefficient (R) for the complete dataset, for different hidden layer sizes. Type of motivations1 Number of neurons 1 2 4 6 8 10 12 14 16 18 20 22 24 26 28 30 HE 0.42 0.44 0.45 0.45 0.46 0.46 0.47 0.47 0.47 0.47 0.47 0.47 0.48 0.47 0.46 0.46 EM 0.28 0.30 0.32 0.33 0.33 0.33 0.34 0.33 0.34 0.34 0.32 0.33 0.33 0.34 0.33 0.33 EC&AV 0.32 0.35 0.38 0.38 0.39 0.39 0.40 0.40 0.40 0.40 0.40 0.41 0.40 0.38 0.39 0.39 SC&CL 0.34 0.37 0.38 0.40 0.39 0.40 0.40 0.40 0.40 0.40 0.41 0.41 0.40 0.39 0.40 0.41 EN&PO 0.36 0.38 0.39 0.39 0.39 0.39 0.39 0.40 0.40 0.40 0.40 0.40 0.40 0.40 0.39 0.39 MA&CO 0.39 0.41 0.42 0.43 0.43 0.43 0.44 0.44 0.44 0.44 0.44 0.43 0.44 0.44 0.44 0.44
1HE – health motivations; EM – emotional motivations; EC&AV – economic and availability motivations; SC&CL – social and cultural motivations; EN&PO –
Table 4. Mean Squared Error for the complete dataset, for different hidden layer sizes. Type of motivations1 Number of neurons 1 2 4 6 8 10 12 14 16 18 20 22 24 26 28 30 HE 661.94 641.73 632.47 626.02 612.94 608.23 601.55 600.46 591.64 588.64 595.56 588.14 569.52 576.28 584.65 600.96 EM 1102.68 1090.36 1067.83 1044.11 1042.57 1035.32 1023.26 1024.38 1006.15 1001.18 1028.41 1010.76 1021.75 1000.40 1010.05 1022.40 EC&AV 677.17 658.74 637.61 628.15 617.41 611.21 603.89 607.20 597.92 601.14 598.16 587.47 588.83 615.74 598.69 594.29 SC&CL 549.32 532.36 517.28 511.88 499.86 500.38 494.73 501.82 494.81 496.55 482.51 480.10 479.95 493.58 491.21 479.05 EN&PO 1068.63 1050.53 1041.08 1020.60 1015.88 1010.70 1002.49 994.44 1008.91 996.45 982.87 971.40 975.97 980.98 993.58 992.19 MA&CO 749.90 729.21 713.17 698.38 692.19 685.12 687.05 674.66 665.97 474.61 669.42 678.69 662.66 673.31 655.57 654.61
1HE – health motivations; EM – emotional motivations; EC&AV – economic and availability motivations; SC&CL – social and cultural motivations; EN&PO –
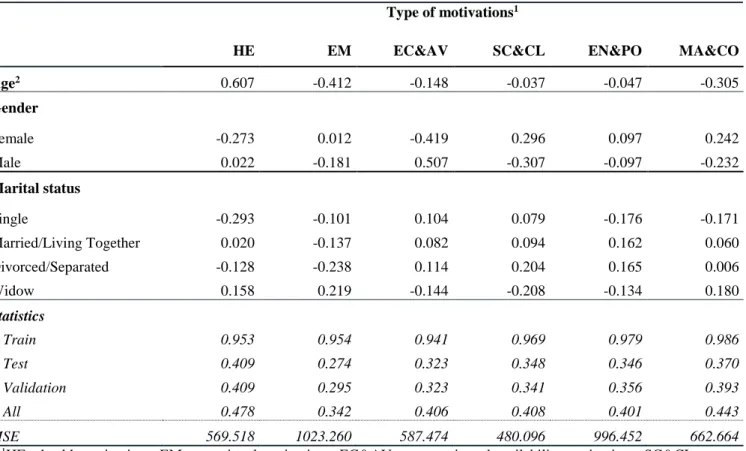
Table 5. Neuron weight scores for the relation between the eating motivations and the variables age, gender and marital status.
Type of motivations1
HE EM EC&AV SC&CL EN&PO MA&CO
Age2 0.607 -0.412 -0.148 -0.037 -0.047 -0.305 Gender Female -0.273 0.012 -0.419 0.296 0.097 0.242 Male 0.022 -0.181 0.507 -0.307 -0.097 -0.232 Marital status Single -0.293 -0.101 0.104 0.079 -0.176 -0.171 Married/Living Together 0.020 -0.137 0.082 0.094 0.162 0.060 Divorced/Separated -0.128 -0.238 0.114 0.204 0.165 0.006 Widow 0.158 0.219 -0.144 -0.208 -0.134 0.180 Statistics R Train 0.953 0.954 0.941 0.969 0.979 0.986 R Test 0.409 0.274 0.323 0.348 0.346 0.370 R Validation 0.409 0.295 0.323 0.341 0.356 0.393 R All 0.478 0.342 0.406 0.408 0.401 0.443 MSE 569.518 1023.260 587.474 480.096 996.452 662.664
1HE – health motivations; EM – emotional motivations; EC&AV – economic and availability motivations; SC&CL –
social and cultural motivations; EN&PO – environmental and political motivations; MA&CO – marketing and commercial motivations.
Table 6. Neuron weight scores for the relation between the eating motivations and the variables country and living environment.
Country
Type of motivations1,2
HE EM EC&AV SC&CL EN&PO MA&CO
Argentina 0.132 -0.100 -0.001 0.192 0.089 0.192 Brazil -0.123 0.171 0.034 0.387 0.186 0.040 Croatia 0.455 -0.181 -0.257 -0.094 0.155 0.066 Egypt 0.277 0.129 0.244 0.383 0.159 0.056 Greece -0.203 -0.270 -0.245 -0.530 -0.159 -0.054 Hungary -0.099 -0.209 -0.057 -0.459 -0.171 -0.004 Italy -0.279 -0.150 -0.233 0.186 0.205 -0.427 Latvia -0.192 -0.100 0.291 0.427 0.118 0.271 Lithuania -0.152 0.344 0.156 -0.065 0.131 0.000 Netherlands -0.533 -0.036 0.275 -0.278 0.171 -0.243 Poland -0.017 -0.074 0.082 -0.176 0.269 0.259 Portugal -0.130 -0.255 0.141 0.098 0.231 -0.332 Romania -0.262 0.240 -0.146 -0.055 0.160 -0.142 Serbia 0.210 -0.298 -0.196 -0.257 0.173 -0.194 Slovenia 0.105 -0.104 -0.082 -0.307 0.123 -0.481
United States of America -0,461 -0,099 -0,170 0,061 -0,061 0,448
Living Environment
Rural 0.351 -0.073 0.348 0.306 0.067 -0.266
Urban -0.249 0.342 -0.252 -0.213 0.200 -0.320
Suburban -0.299 -0.410 -0.444 -0.281 -0.168 0.415
1HE – health motivations; EM – emotional motivations; EC&AV – economic and availability motivations; SC&CL –
social and cultural motivations; EN&PO – environmental and political motivations; MA&CO – marketing and commercial motivations.
Table 7. Neuron weight scores for the relation between the eating motivations and the variables education and professional area.
Education
Type of motivations1,2
HE EM EC&AV SC&CL EN&PO MA&CO
Primary School 0.037 0.017 0.130 0.132 0.023 0.323 Secondary School -0.072 -0.001 -0.175 -0.073 0.136 -0.404 University Degree -0.341 0.270 -0.289 -0.201 -0.293 0.030 Professional area Nutrition 0.326 -0.053 -0.237 0.427 0.178 -0.370 Food -0.252 0.163 -0.259 -0.350 -0.260 -0.167 Agriculture -0.386 -0.210 0.056 -0.325 -0.297 0.154 Sport 0.114 -0.008 -0.013 0.407 0.156 0.287 Psychology 0.254 0.237 0.179 -0.093 -0.108 0.070 Health -0.348 -0.075 0.020 0.218 0.222 -0.121 Others -0.372 0.128 -0.320 -0.695 -0.161 0.201
1HE – health motivations; EM – emotional motivations; EC&AV – economic and availability motivations; SC&CL –
social and cultural motivations; EN&PO – environmental and political motivations; MA&CO – marketing and commercial motivations.
The results in Table 5 show that age is a positive influential variable for the health motivations, and therefore as age increases, health concerns also increase. This is natural given the degradation of the body functions with increasing age and the appearance of some age related diseases. On the other hand, age has a negative impact on emotional and on marketing & commercial motivations, indicating that older people tend to give less importance to these concerns when choosing what to eat.
Regarding gender (Table 5), the input weights for women are positive for social & cultural and also for marketing & commercial motivations, indicating that women tend to give importance to these aspects when making food decisions. On the other hand, women seem to neglect the economic & availability as well as health motivations. For men, economic & availability motivations are importantly valued in contrast with social & cultural reasons, which appear as the least influential, with the lowest negative weight. In fact, men tend to value the easiness to get food and to spend as less time as possible doing it, and therefore availability might make a difference.
As for marital status, the health motivations are slightly important for widows, while a negative impact is observed for singles and divorced. Because widows tend to be alone, they might need to take extra care about their health and also the fact that they already lost their life partner may contribute to the increased importance given to a healthy eating. Widows also give importance to emotional motivations while there is a negative impact for social & cultural motivations, indicating that for these people the way they feel is much more important than what the surrounding environment might determine about their food choices. The divorced present a somewhat contrary behaviour to widows, giving importance to social & cultural motivations, which might be related with a need to be accepted and integrated into social circles.
Table 6 shows the influence of geographical factors on eating motivations. The results show that health concerns are more valued in countries like Croatia, Egypt and Serbia, while not valued for Netherlands, United States, Italy, Romania or Greece. For the other countries, the impact is negligible. Emotional motivations are very influential in Latvia followed by Romania, while there is a negative impact for countries like Serbia, Greece, Portugal or Hungary. Regarding economic & availability motivations they appear as important for the participants from Latvia, Netherlands and Egypt, while in countries like Croatia, Greece and Italy these aspects seem to have no effect on the participants’ food choices. In Latvia, Brazil or Egypt social and cultural motivations are considered when deciding what to eat, while in Greece, Italy, Slovenia, Netherland and Serbia the impacts appears as negative. Environmental & political concerns do not appear as very influential in peoples’ food choices in general, with exception for Poland, Portugal and Italy. Finally, for marketing & commercial motivations positive impacts were observed for United States of America, Latvia and Poland, while for Slovenia, Italy or Portugal the impacts were negative.
Table 6 also shows that people residing in rural areas make food choices oriented by health, economic & availability and social & cultural motivations, while not giving importance to marketing & commercial motivations. On the other hand, people residing in urban environments tend to orient their food choices based on emotional as well as environmental & political motivations, with a negative impact from all other types of motivations. For participants residing in suburban areas, marketing & commercial motivations appeared with an important positive impact, while all other inputs had negative weights.
Table 7 presents the results for influence of education or professional area in the eating motivations studied. According to these, people with the lowest level of education
considered (primary school) make food choices based on marketing & commercial determinants, practically neglecting all others, while the participants with a secondary level of education show a negative impact, meaning that they seem less sensitive to advertisements and commercial campaigns. For people with a university degree, emotional motivations are positively strong, while a negative impact was observed for all others, except for marketing & commercial, which showed no effect.
The results in Table 7 also reveal that people with a profession or studies related to nutrition and psychology base their own food choices on health motivations, more than other types of motivations, while these come with a negative impact for people from food, agriculture or even health areas. Emotional motivations were found influential for people from psychology but not for people from agriculture. Economic & availability motivations were found to negatively impact food choices for people with a profession related to food or nutrition. Social & cultural motivations appeared as influential for people from nutrition, sports or health, whereas they showed a negative impact for people from food and agriculture areas. Environmental & political motivations are valued by people with a job or studies related to health but again a negative impact was observed for people from food or agriculture. At last, people linked with sports seem to give importance to marketing and advertising campaigns, contrary to people from nutrition, who tend to show a negative impact of advertisements into their food choices.
Conclusion
The results obtained showed that age significantly influenced all types of eating motivations, and the same happened with marital status, country, living environment, level of education or professional area. However, regarding gender, no significant
differences were observed for two of the six types of motivations analysed: economic & availability and marketing & commercial.
Neural models were created and trained to analyse the relative importance of each variable to food choices. The models showed there is a considerable variability in preferences, but nevertheless, some trends were identified. According to the results of ANN modelling, it was possible to find that the strongest positive factors determining health motivations were age and country (Croatia), while for emotional motivations were living environment (urban) and country (Lithuania). Regarding economic & availability motivations, the higher positive input weights were associated with gender (male) and living environment (rural). Social & cultural motivations were highly influenced by country (Latvia), living environment (rural) and professional area (nutrition and sport). As for environmental & political motivations, the highest positive input weights were obtained for country (Poland) and finally marketing & commercial motivations were strongly considered by the participants residing in United States of America and in suburban areas.
These results highlight the importance of sociodemographic characteristics as influencers of eating patterns around the globe, considering the geographical coverage of the study carried out. Future research should focus on other countries and regions of the world.
Acknowledgment
This work was prepared in the ambit of the multinational project EATMOT from CI&DETS Research Centre (Polytechnic Institute of Viseu, Portugal) with reference PROJ/CI&DETS/CGD/0012, co-financed by Caixa Geral de Depósitos.
Disclosure of interest
The authors report no conflict of interest.
References
Annunziata A, Agovino M, Mariani A. 2019. Measuring sustainable food consumption: A case study on organic food. Sustainable Production and Consumption. 17:95–107. Balderjahn I, Peyer M, Seegebarth B, Wiedmann K-P, Weber A. 2018. The many faces of sustainability-conscious consumers: A category-independent typology. Journal of Business Research. 91:83–93.
Biondi B, Van der Lans IA, Mazzocchi M, Fischer ARH, Van Trijp HCM, Camanzi L. 2019. Modelling consumer choice through the random regret minimization model: An application in the food domain. Food Quality and Preference. 73:97–109.
Cunha LM, Cabral D, Moura AP, de Almeida MDV. 2018. Application of the Food Choice Questionnaire across cultures: Systematic review of cross-cultural and single country studies. Food Quality and Preference. 64:21–36.
Dębska B, Guzowska-Świder B. 2011. Application of artificial neural network in food classification. Analytica Chimica Acta. 705:283–291.
Huang Y, Kangas LJ, Rasco BA. 2007. Applications of Artificial Neural Networks (ANNs) in Food Science. Critical Reviews in Food Science and Nutrition. 47:113–126. Hunt E, Madhyastha T. 2008. Recruitment modeling: An analysis and an application to the study of male–female differences in intelligence. Intelligence. 36:653–663.
Kennedy M, Dinh V-N, Basu B. 2016. Analysis of consumer choice for low-carbon technologies by using neural networks. Journal of Cleaner Production. 112:3402–3412. Köster EP. 2009. Diversity in the determinants of food choice: A psychological perspective. Food Quality and Preference. 20:70–82.
Kullen CJ, Iredale L, Prvan T, O’Connor HT. 2016. Evaluation of General Nutrition Knowledge in Australian Military Personnel. Journal of the Academy of Nutrition and Dietetics. 116:251–258.
Lai KC, Lim SK, Teh PC, Yeap KH. 2016. Modeling Electrostatic Separation Process Using Artificial Neural Network (ANN). Procedia Computer Science. 91:372–381. Lakens D, Adolfi FG, Albers CJ, Anvari F, Apps MAJ, Argamon SE, Baguley T, Becker RB, Benning SD, Bradford DE, et al. 2018. Justify your alpha. Nature Human Behaviour. 2:168.
Lazarevich I, Irigoyen Camacho ME, Velázquez-Alva M del C, Zepeda Zepeda M. 2016. Relationship among obesity, depression, and emotional eating in young adults. Appetite. 107:639–644.
Lee J, Finn CE. 2007. Anthocyanins and other polyphenolics in American elderberry (Sambucus canadensis) and European elderberry (S. nigra) cultivars. J Sci Food Agric. 87:2665–2675.
Lozano M, Manyes L, Peiró J, Montes F. 2019. Geographic conditioning in dietary, social, and health patterns in elderly population with disabilities. Nutrition. 57:17–23. Luesse HB, Contento IR. 2019. Context Considerations for Developing the In Defense of Food Nutrition Education Curriculum. Journal of Nutrition Education and Behavior. 51:370–378.
MacBride-Stewart S, Gong Y, Antell J. 2016. Exploring the interconnections between gender, health and nature. Public Health. 141:279–286.
Madhyastha TM, Hunt E, Deary IJ, Gale CR, Dykiert D. 2009. Recruitment modeling applied to longitudinal studies of group differences in intelligence. Intelligence. 37:422– 427.
Manzel A, Muller DN, Hafler DA, Erdman SE, Linker RA, Kleinewietfeld M. 2013. Role of “Western Diet” in Inflammatory Autoimmune Diseases. Curr Allergy Asthma Rep. 14:404.
Monteleone E, Spinelli S, Dinnella C, Endrizzi I, Laureati M, Pagliarini E, Sinesio F, Gasperi F, Torri L, Aprea E, et al. 2017. Exploring influences on food choice in a large population sample: The Italian Taste project. Food Quality and Preference. 59:123–140. Nicholson JS, Barton JM, Simons AL. 2018. Ability to Categorize Food Predicts Hypothetical Food Choices in Head Start Preschoolers. Journal of Nutrition Education and Behavior. 50:238-246.e1.
Olden JD, Jackson DA. 2002. Illuminating the “black box”: a randomization approach for understanding variable contributions in artificial neural networks. Ecological Modelling. 154:135–150.
Öztürk A, Şimşek TT, Yümin ET, Sertel M, Yümin M. 2011. The relationship between physical, functional capacity and quality of life (QoL) among elderly people with a chronic disease. Archives of Gerontology and Geriatrics. 53:278–283.
Rozin P. 2007. How does culture affect choice of foods? In: Consumer-Led Food Product Development. [place unknown]; p. 66–80.
Schulenkorf N, Siefken K. 2018. Managing sport-for-development and healthy lifestyles: The sport-for-health model. Sport Management Review [Internet]. [cited 2018 Nov 28]. Available from: http://www.sciencedirect.com/science/article/pii/S1441352318304157 Shashi, Kottala SY, Singh R. 2015. A review of sustainability, deterrents, personal values, attitudes and purchase intentions in the organic food supply chain. Pacific Science Review B: Humanities and Social Sciences. 1:114–123.
Sobal J, Bisogni CA. 2009. Constructing Food Choice Decisions. ann behav med. 38:37– 46.
Song Q, Zheng Y-J, Xue Y, Sheng W-G, Zhao M-R. 2017. An evolutionary deep neural network for predicting morbidity of gastrointestinal infections by food contamination. Neurocomputing. 226:16–22.
Torkashvand AM, Ahmadi A, Nikravesh NL. 2017. Prediction of kiwifruit firmness using fruit mineral nutrient concentration by artificial neural network (ANN) and multiple linear regressions (MLR). Journal of Integrative Agriculture. 16:1634–1644.
Vecchio R, Loo EJV, Annunziata A. 2016. Consumers’ willingness to pay for conventional, organic and functional yogurt: evidence from experimental auctions. International Journal of Consumer Studies. 40:368–378.
Wang D, Everett B, Northall T, Villarosa AR, Salamonson Y. 2018. Access to food choices by older people in residential aged care: An integrative review. Collegian. 25:457–465.
World Health Organization. 2018a. Healthy diet. World Health Organization [Internet]. [cited 2018 Oct 29]. Available from: http://www.who.int/news-room/fact-sheets/detail/healthy-diet
World Health Organization. 2018b. Non communicable diseases. World Health Organization [Internet]. [cited 2018 Nov 29]. Available from: http://www.who.int/news-room/fact-sheets/detail/noncommunicable-diseases
Zeković Z, Bera O, Đurović S, Pavlić B. 2017. Supercritical fluid extraction of coriander seeds: Kinetics modelling and ANN optimization. The Journal of Supercritical Fluids. 125:88–95.
Appendix A
Tables A.1 to A.3 show the results obtained for the influence of the sociodemographic variable on eating motivations.
Table A.1. Eating motivations by age, gender and marital status.
Age group
Type of motivations1
Mean value ± Standard deviation2
HE EM EC&AV SC&CL EN&PO MA&CO
Young adults: 18 ≤ age ≤ 30 15.73±28.09a 1.49±34.74b 6.06±26.85b -2.56±25.26ab 9.40±35.08a -11.63±29.20c
Average adults: 31 ≤ age ≤ 50 23.61±27.64b -6.11±34.69a 1.12±28.10a -5.36±24.72a 18.37±34.84b -22.19±29.40ab
Senior adults: 51 ≤ age ≤ 65 28.84±27.89c -9.31±32.95a 1.84±27.11a -5.27±23.68a 23.57±33.63c -24.48±28.11a
Elderly: Age ≥ 66 34.74±25.40d -8.52±31.25a 8.25±29.24b -1.30±24.08b 25.49±31.14c -20.75±30.45b Test-statistic3 148.196 65.505 31.849 13.144 105.787 147.623 P-value3 < 0.0005 < 0.0005 < 0.0005 < 0.0005 < 0.0005 < 0.0005 Eta-squared 0.036 0.016 0.008 0.003 0.026 0.036 Gender Female 22.69±27.05 -0.03±34.66 3.75±27.23 -3.56±24.66 16.73±33.96 -16.98±29.08 Male 15.48±30.80 -9.68±33.80 4.13±28.09 -4.58±25.40 9.78±37.59 -17.65±31.13 Test-statistic4 11.959 14.009 -0.680 2.033 9.391 1.082 P-value4 < 0.0005 < 0.0005 0.496 0.042 < 0.0005 0.279 Eta-squared 0.013 0.016 0.000 0.000 0.008 0.000 Marital status Single 15.50±28.16a 0.78±35.07bc 6.37±27.22b -2.68±25.56a 10.07±35.20a -11.52±29.37b Married/Living Together 24.60±27.78b -5.85±34.12ab 1.22±27.44a -4.91±24.41a 18.29±34.62b -21.81±29.07a Divorced/Separated 25.23±27.89b -3.67±33.88bc 6.06±27.18b -4.77±23.25a 19.89±35.74b -22.93±28.69a Widow 34.38±26.20c -10.76±32.65a 3.71±29.47ab -3.36±22.15a 26.35±31.73c -24.00±30.45a Test-statistic3 123.341 387.642 34.211 7.815 64.751 127.528 P-value3 < 0.0005 < 0.0005 < 0.0005 < 0.0005 < 0.0005 < 0.0005 Eta-squared 0.030 0.010 0.009 0.002 0.016 0.031 Total 20.62±28.35 -2.79±34.69 3.86±27.48 -3.85±24.88 14.74±35.17 -17.17±29.68
1HE – health motivations; EM – emotional motivations; EC&AV – economic and availability motivations; SC&CL – social and cultural motivations; EN&PO –
environmental and political motivations; MA&CO – marketing and commercial motivations.
2Scale from -100% (not at all motivated) to +100% (strongly motivated).
3Values in the same column for the same variable with the same superscript are not statistically different, ANOVA with Tukey HSD post-hoc test (p < 0.05). 4T-test for independent samples (p < 0.05).
Table A.2. Eating motivations by country and living environment.
Country
Type of motivations1
Mean value ± Standard deviation2
HE EM EC&AV SC&CL EN&PO MA&CO
Argentina 14.44±25.82cd -1.42±33.91cde 6.62±27.23efg -3.92±25.05de 6.63±36.21abcd -8.45±27.28fg
Brazil 16.75±26.49cde 0.85±35.55ef 1.68±25.62def -4.63±22.38de 15.11±32.56defg -17.94±28.00cde
Croatia 20.02±27.60defg -8.26±33.01bcd 6.36±23.64efg -5.80±23.87cde 7.44±33.73abcde -11.67±26.99efg
Egypt 26.13±23.98ghi 13.98±34.15g 10.49±28.65gh 15.80±26.64h 22.67±30.31g 3.98±24.37h
Greece 17.14±30.01cdef -2.31±34.36cde -5.51±25.55abc -12.66±24.61b 17.34±35.85fg -20.07±31.71bcd
Hungary 6.24±33.84ab -19.11±39.33a 13.57±31.39h -20.59±33.74a -0.36±44.76a -26.73±30.83ab
Italy 19.82±23.55defg -1.11±33.86de -6.82±25.41ab -6.76±18.04bcd 31.60±28.56h -26.70±26.44ab
Latvia 15.13±23.81cd 8.95±34.92fg 25.85±31.17i 5.83±29.60fg 9.42±38.91bcdef -7.42±25.71g
Lithuania 31.28±26.68i 11.05±34.50g 14.27±26.13h 10.80±22.43gh 6.24±36.31abc -11.45±26.14efg
Netherlands 2.58±23.49a -6.02±31.58bcde 8.32±22.15fgh -6.27±19.10cde 13.81±31.11cdef -14.96±26.62def
Poland 22.35±23.51efg -0.42±28.82de -9.30±21.19a 2.62±19.30f 10.93±31.35bcdef -24.09±25.56bc
Portugal 38.27±25.36j -10.09±27.37bc 1.19±19.81cde -3.92±17.47de 38.40±26.44h -33.01±32.34a
Romania 30.89±27.4hi -1.43±37.42cde 0.96±31.98cde -7.84±23.85bcd 17.51±33.09fg -24.93±26.72bc
Serbia 12.81±28.51bc -14.68±35.05ab -0.69±26.62bcd -8.81±23.31bcd 4.00±36.26ab -24.40±27.63bc
Slovenia 23.93±22.88fgh -6.97±33.74bcde -6.38±25.26ab -11.40±22.41bc 16.14±30.85efg -20.31±26.96bcd
United States of America 6.04±32.16ab 1.37±35.85ef 6.21±30.01efg -3.68±25.10de 0.21±35.33a -5.52±30.52g
Test-statistic3 100.384 42.970 75.032 87.792 83.621 94.510 P-value3 < 0.0005 < 0.0005 < 0.0005 < 0.0005 < 0.0005 < 0.0005 Eta-squared 0.119 0.054 0.091 0.105 0.101 0.112 Living Environment Rural 21.29±26.07b -0.83±36.43b 6.71±29.14b 0.25±28.22b 16.78±33.98b -11.24±29.37b Urban 21.88±28.75b -3.37±34.27a 3.27±26.90a -4.71±24.03a 15.41±35.64b -19.71±29.54a Sub-urban 15.00±28.22a -2.37±34.53ab 3.44±27.91a -4.38±24.37a 10.10±34.07a -12.82±29.24b Test-statistic3 48.275 4.369 12.531 31.928 22.321 90.847 P-value3 < 0.0005 0.013 < 0.0005 < 0.0005 < 0.0005 < 0.0005 Eta-squared 0.008 0.001 0.002 0.005 0.004 0.015 Total 20.62±28.36 -2.79±34.69 3.86±27.48 -3.85±24.88 14.74±35.17 -17.17±29.68
1HE – health motivations; EM – emotional motivations; EC&AV – economic and availability motivations; SC&CL – social and cultural motivations; EN&PO –
environmental and political motivations; MA&CO – marketing and commercial motivations.
2Scale from -100% (not at all motivated) to +100% (strongly motivated).
Table A.3. Eating motivations by level of education and professional area.
Level of education
Type of motivations1
Mean value ± Standard deviation2
HE EM EC&AV SC&CL EN&PO MA&CO
Primary School 23.07±31.31b -0.02±38.54a 13.64±34.83b 2.82±32.96c 15.01±35.92a -4.11±26.70c Secondary School 17.24±29.19a -3.80±34.94a 4.18±27.64a -5.97±25.59a 12.08±35.58a -14.22±29.58b University Degree 22.53±27.56b -2.29±34.38a 2.96±27.01a -2.83±24.01b 16.30±34.82a -19.36±29.58a Test-statistic3 48.943 3.407 22.732 31.261 19.759 66.856 P-value3 < 0.0005 0.033 < 0.0005 < 0.0005 < 0.0005 < 0.0005 Eta-squared 0.008 0.001 0.004 0.005 0.003 0.011 Professional area Nutrition 19.37±28.47bc -2.62±34.39bc 0.63±25.89a -3.82±22.66ab 13.61±33.78ab -17.00±29.83ab Food 17.13±26.62ab 0.49±33.58cd 5.37±27.09bc -2.67±24.68ab 12.61±34.66ab -16.26±27.15abc Agriculture 16.31±28.43ab -8.13±33.95a 0.82±29.37a -3.58±26.89ab 16.38±35.97b -16.70±29.35ab Sport 24.49±26.19d 6.96±34.56e 7.31±27.50c 6.44±27.24c 15.33±34.98b -4.23±29.05d Psychology 13.67±29.19a 3.39±35.69de 5.98±29.62bc -1.38±25.83b 9.41±36.65a -12.43±31.42c Health 21.48±26.85cd -1.02±34.95bcd 5.27±27.34bc -4.02±23.97ab 13.05±33.76ab -14.71±27.54bc Others 21.70±29.22cd -5.52±34.44ab 3.20±27.44ab -5.50±24.80a 16.37±35.80b -20.37±30.33a Test-statistic3 14.284 22.543 7.807 25.215 6.150 38.489 P-value3 < 0.0005 < 0.0005 < 0.0005 < 0.0005 < 0.0005 < 0.0005 Eta-squared 0.007 0.011 0.004 0.012 0.003 0.019 Total 20.62±28.35 -2.79±34.69 3.86±27.48 -3.85±24.88 14.74±35.17 -17.17±29.68
1HE – health motivations; EM – emotional motivations; EC&AV – economic and availability motivations; SC&CL – social and cultural motivations; EN&PO –
environmental and political motivations; MA&CO – marketing and commercial motivations.
2Scale from -100% (not at all motivated) to +100% (strongly motivated).