Maria Madalena da
Silva Andrade
Serão os impactos de nanotubos de carbono ou do
aumento de temperatura acrescidos em Mytilus
galloprovincialis expostos ao ar?
Are the impacts of carbon nanotubes or increased
temperature enhanced in Mytilus galloprovincialis
submitted to air exposure?
DECLARAÇÃO
Declaro que este relatório é integralmente da minha autoria, estando devidamente
referenciadas as fontes e obras consultadas, bem como identificadas de modo claro as
citações dessas obras. Não contém, por isso, qualquer tipo de plágio quer de textos
publicados, qualquer que seja o meio dessa publicação, incluindo meios eletrónicos, quer de
trabalhos académicos.
Maria Madalena da
Silva Andrade
Serão os impactos de nanotubos de carbono ou do
aumento de temperatura acrescidos em Mytilus
galloprovincialis expostos ao ar?
Are the impacts of carbon nanotubes or increased
temperature enhanced in Mytilus galloprovincialis
submitted to air exposure?
Dissertação apresentada à Universidade de Aveiro para cumprimento dos requisitos necessários à obtenção do grau de Mestre em Toxicologia e Ecotoxicologia, realizada sob a orientação científica da Doutora Rosa de Fátima Lopes de Freitas (Investigadora pós-doutorada e professora auxiliar do Departamento de Biologia & Centro de Estudos do Ambiente e do Mar) e co-orientação da Doutora Etelvina Maria de Almeida Paula Figueira (Professora do Departamento de Biologia da Universidade de Aveiro).
o júri
presidente Doutora Isabel Maria Cunha Antunes Lopes
Investigadora principal do centro de estudos do ambiente e do mar (CESAM) da Universidade de Aveiro
Doutora Georgina Alexandra Rivera-Ingraham
Investigadora de Pós-Doutoramento do centro de investigação da Biodiversidade Marinha, Exploração e Conservação (MARBEC) da Universidade de Montpellier (França)
Doutora Rosa de Fátima Lopes de Freitas
Investigadora pós-doutorada e professora auxiliar do Departamento de Biologia e Centro de Estudos do Ambiente e do Mar (CESAM) da Universidade de Aveiro
conclusão deste trabalho com sucesso. À minha coorientadora, Professora Etelvina Figueira pela disponibilidade, por me ajudar a decifrar a história por detrás de alguns dos resultados e a solucionar problemas relacionados à bioquímica. Ao professor Rui, que me ajudou a construir o sistema de marés usado neste trabalho e que graças a este sistema este trabalho demonstrou ser um sucesso. Agradeço pelo tempo despendido comigo e principalmente a oportunidade que me deram para aprender sobre uma área do qual pouco conhecia e da qual adorei conhecer.
Aos colegas de laboratório, Adília, Ângela, Anthony, Big Ruí, Carina, Francesca, Lucia, Luís, Luísa, Matilde, Paulo, Silvana, Simão, Ricardo e Rui que sempre demonstraram disponibilidade para ajudar, tirar dúvidas e pelo bom ambiente e humor que sempre me motivou a continuar a trabalhar. Em particular, agradeço à Luísa que me ajudou a relembrar a bioquímica e ensinou que errar é normal. À Francesca que apesar de sempre atarefada ajudou-me sempre que precisei. E em especial, à Lucia que apesar de ocupada, usou o seu tempo para me ajudar, descobrir os meus erros e porque sem ela este trabalho seria impossível.
Aos meus antigos colegas de Ciências do Mar, Alexandre, Carla, Henrique, João, Luís, Marcelo e Miguel, que apesar da maioria ter seguido para lados diferentes sempre me fizeram companhia especialmente ao almoço, demonstraram apoio incondicional e um interesse enorme pelo meu bem-estar. Agradeço especialmente ao João, do qual muito orgulho e apoio me deu, e pela grande motivação ao longo deste trabalho.
Aos meus “amigos do Porto”, Handy, Rafa e Joana, que sempre se importaram imenso com o meu bem-estar e que apesar de desaparecida iam convidando para “sair” e desanuviar imensas vezes. Em especial, agradeço à Joana, pois sem ela não era o que sou hoje, e que sempre se demonstrou disponível para me ouvir e pela grande força, motivação e acima de tudo a grande amizade não só nesta fase da minha vida, mas também ao longo destes últimos 10 anos.
Aos meus pais, pelo esforço e a oportunidade que me deram para continuar a estudar, sempre a pensar no melhor futuro para mim. Agradeço em especial a minha mãe que sempre me deu o maior apoio possível, principalmente pelas palavras de força nos momentos que mais precisei. E à minha irmã, agradeço a companhia durante a escrita deste trabalho enquanto ela escrevia os dela.
palavras-chave Mexilhões, nanoparticulas, aumento da temperatura, stress oxidativo, metabolismo, regime de marés.
resumo Espécies intertidais estão frequentemente expostas a mudanças ambientais associadas a múltiplos stresses, dos quais estas devem evitar ou tolerar desenvolvendo certas estratégias. Algumas das mudanças naturais estão ligadas ao ciclo de maré, do qual organismos devem tolerar as diferenças entre o ambiente aquático e o ambiente aéreo. Para além disso, estes organismos estão também sujeitos ao aquecimento global e consequentemente, ao risco de dessecação especialmente sob ambiente aéreo. Ademais, a exposição a poluentes de fontes antropogénicas é um outro stress diário com que os organismos devem lidar. O presente estudo avaliou os impactos em Mytilus galloprovincialis expostos a diferentes temperaturas (18ºC e 21ºC) ou a nanopartículas de carbono (0.01mg/L MWCNT) quando continuadamente submersos ou expostos a marés (5h de maré baixa, 7h de maré alta) por 14 dias. Os resultados evidenciaram que os mexilhões foram fisiologicamente e bioquimicamente afetados pelo aumento da temperatura ou exposição de MWCNTs, especialmente quando também expostos a marés. Quando só expostos ao aumento da temperatura, o stress induzido foi o suficiente para ativar as defesas antioxidantes dos mexilhões gastando reservas de energia e evitando danos oxidativos. Quando só expostos a MWCNTs ou só a marés, o stress induzido não foi suficiente para induzir as defesas antioxidantes dos mexilhões resultando em danos oxidativos. Contudo, a combinação de marés e temperatura, resultou numa alta produção de espécies reativas de oxigénio (ROS), a qual levou a um decréscimo significativo no teor de lípidos (LIP), a uma ativação das defesas antioxidantes (superóxido dismutase, SOD e glutationa peroxidase, GPx) e ao aumento da glutationa oxidada (GSSG), contudo os organismos não foram capazes de prevenir os danos celulares demonstrando um aumento de peroxidação lipídica (LPO). Desta forma, a combinação do aumento da temperatura e da exposição ao ar durante marés baixas demonstrou induzir maior stress oxidativo. Quando expostos à combinação de marés e MWCNTs, os mexilhões demonstraram uma alta produção de ROS, associada ao aumento do metabolismo, o qual levou ao aumento significativo de defesas antioxidantes (SOD, GPx) e de GSSG, e desta forma os organismos foram capazes de prevenir os danos celulares não demonstrando LPO ou cabonilação proteica (PC). Desta forma, os organismos pareceram ser capazes de tolerar MWCNTs e exposição ao ar durante marés baixas, contudo a combinação de ambos os stressores demonstrou induzir maior stress oxidativo.
Estes resultados indicam que o aumento do aquecimento global e da presença de nanopartículas de carbono em ecossistemas marinhos poderá induzir impactos subletais e mais tóxicos em organismos intertidais quando comparados a organismos que estão continuadamente submersos no ecossistema marinho. Além do mais, os resultados também indicaram que a exposição ao ar poderá influenciar a avaliação de diferentes stressores em organismos a viver em sistemas costeiros.
keywords Mussels, nanoparticles, increased temperature, oxidative stress, metabolism, tidal regime.
abstract Intertidal species are frequently exposed to environmental changes associated with multiple stressors to which they must avoid or tolerate by developing certain strategies. Some of the natural environmental changes are correlated with the tidal cycle which forces organisms to tolerate the differences between an aquatic and an aerial environment. Apart of these differences, intertidal mussels are also subjected to global warming and consequently, the risk of desiccation especially under aerial environment. Furthermore, pollutants exposure from anthropogenic sources is another daily stress that organisms must cope with it. The present study evaluated the impacts in Mytilus galloprovincialis exposed to different temperatures (18ºC and 21ºC) or carbon nanoparticles (0.01 mg/L MWCNT) when continuously submersed or exposed to tides (5 h of low tide, 7 h of high tide) for 14 days. Results evidenced that mussels were physiological and biochemical affected by increased temperature or MWCNTs exposure, especially when exposed to tides. When only exposed to increased temperature, the stress induced was enough to activate mussels’ antioxidant defenses by spending energy reserves and avoid oxidative damage. When only exposed to MWCNTs or only exposed to tides, the stress induced was not enough to activate mussels’ antioxidant defenses which resulted in oxidative damage. Nevertheless, the combination of tides and temperature, resulted into high production of reactive oxygen species (ROS), which lead to a significant decrease of lipids (LIP) content, activation of antioxidant defenses (superoxide dismutase, SOD and glutathione peroxide, GPx) and increase of oxidized glutathione (GSSG), yet organisms couldn’t prevent cellular damage, showing an increase of lipid peroxidation (LPO). Therefore, the combination of increased temperature and air exposure during ebb tides demonstrated to induce higher oxidative stress. Similarly, when mussels were exposed to the combination of tides and MWCNTs, resulted into high production of reactive oxygen species (ROS), associated with an increase of metabolism, which lead to a significant increase of antioxidant defenses (superoxide dismutase, SOD and glutathione peroxide, GPx) and oxidized glutathione (GSSG), and thus organisms were able to prevent cellular damage, showing no lipid peroxidation (LPO) or protein carbonylation (PC) levels. Therefore, organisms seemed to be able to tolerate MWCNTS and air exposure during ebb tides, however the combination of both stressors demonstrated to induce higher oxidative stress.
These findings indicate that the increasing global warming and the increasing presence of carbon nanoparticles in marine ecosystems can induce sub-lethal and higher toxic impacts, respectively, in intertidal organisms compared to organisms continuously submersed in marine ecosystems. Furthermore, our results may indicate that air exposure can act as a cofounding factor on the assessment of different stressors in organisms living in coastal systems.
Contents
Chapter 1 – General Introduction ... 1
1.1. Estuaries and associated environmental alterations ... 2
1.1.1. Tidal regime ... 3
1.1.2. Climate change: temperature increase ... 4
1.1.3. Emerging contaminants: nanoparticles in the environment ... 5
1.2. Marine bivalves as bioindicators ... 8
1.2.1. Responses of bivalves to air exposure ... 9
1.2.2. Responses of bivalves to warmer temperature ... 9
1.2.3. Responses of bivalves to nanoparticles ... 10
1.3. Objectives ... 11
Chapter 2 – Material and Methods ... 13
2.1. Test organisms ... 14 2.2. Sampling area ... 15 2.3. Experimental conditions ... 16 2.4. MWCNTs characterization ... 19 2.5. Biological responses ... 19 2.5.1. Physiological parameters ... 21 2.5.1.1. Respiration Rate ... 21 2.5.1.2. Condition Index ... 21 2.5.2. Biochemical parameters ... 22 2.5.2.1. Metabolic capacity ... 23 2.5.2.2. Energy reserves ... 24 2.5.2.3. Oxidative damage ... 25 2.5.2.4. Antioxidant enzymes ... 26 2.6. Data analysis ... 27 Chapter 3 – Results ... 30 3.1. MWCNTs characterization ... 31
3.2. Air Exposure: physiological parameters ... 31
3.2.1. Mortality ... 31
3.2.2. Respiration rate ... 31
3.2.3. Condition index ... 32
3.3. Air exposure: biochemical parameters ... 33
3.3.1. Metabolic capacity... 33
3.3.2. Energy reserves ... 33
3.3.3. Oxidative damage ... 34
3.3.4. Antioxidant enzymes ... 36
3.4. Temperature increase and air exposure: physiological parameters ... 38
3.4.1. Mortality ... 38
3.4.2. Respiration Rate ... 38
3.4.3. Condition Index ... 38
3.5. Temperature increase and air exposure: biochemical parameters ... 40
3.5.1. Metabolic capacity... 40
3.5.2. Energy reserves ... 40
3.5.3. Oxidative damage ... 42
3.5.4. Antioxidant enzymes ... 44
3.6. MWCNTs and air exposure: physiological parameters ... 46
3.6.1. Mortality ... 46
3.6.2. Respiration rate ... 46
3.6.3. Condition Index ... 46
3.7. MWCNTs and air exposure: biochemical parameters ... 47
3.7.1. Metabolic capacity... 47 3.7.2. Energy reserves ... 48 3.7.3. Oxidative damage ... 50 3.7.4. Antioxidant enzymes ... 52 Chapter 4. Discussion ... 55 4.1. Contextualization ... 56
4.2. Air exposure: physiological responses ... 56
4.2.1. Respiration rate. ... 56
4.2.2. Condition index ... 57
4.3. Air exposure: biological responses ... 57
4.3.1. Metabolic capacity and energy reserves ... 57
4.3.2. Oxidative damage ... 58
4.3.3. Antioxidant enzymes ... 59
4.4. Temperature increase and air exposure: physiological responses ... 60
4.4.1. Respiration rate ... 60
4.4.2. Condition index ... 61
4.5. Temperature increase and air exposure: biochemical responses ... 61
4.5.1. Metabolic capacity and energy reserves ... 61
4.5.2. Oxidative damage ... 63
4.5.3. Antioxidant enzymes ... 64
4.6. MWCNTs and air exposure: physiological responses ... 65
4.6.1. Respiration rate ... 65
4.6.2. Condition index ... 66
4.7. MWCNTs and air exposure: biochemical responses ... 66
4.7.1. Metabolic capacity and energy reserves ... 66
4.7.2. Oxidative damage ... 67 4.7.3. Antioxidant enzymes ... 69 Chapter 5 – Conclusions ... 71 5.1. Conclusions ... 72 5.2. Future considerations ... 73 Chapter 6 – References ... 74
List of figures and tables
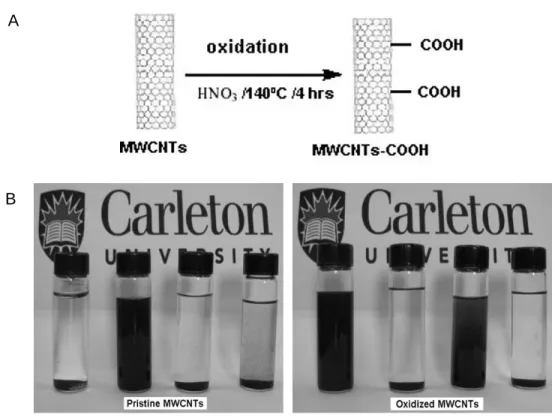
Figure 1.1.A- Surface functionalization of MWCNT surface; B- Solubility of pristine MWCNT and MWCNT-COOH in different solvents (from left to right, deionized water, dichloromethane,
methanol, and hexane) (Adapted from Salam et al., 2017). ... 7
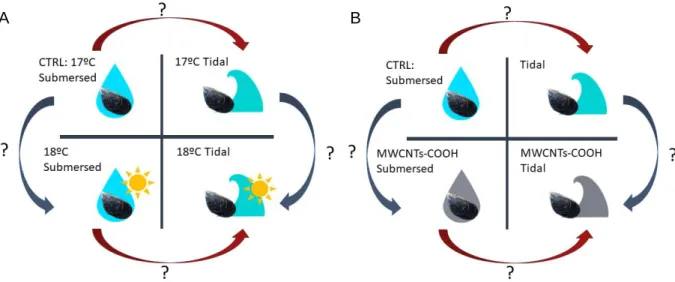
Figure 1.2.Graphical representation of possible interactions between: A – Air exposure and different temperatures; B – Air exposure and MWCNTs. ... 12
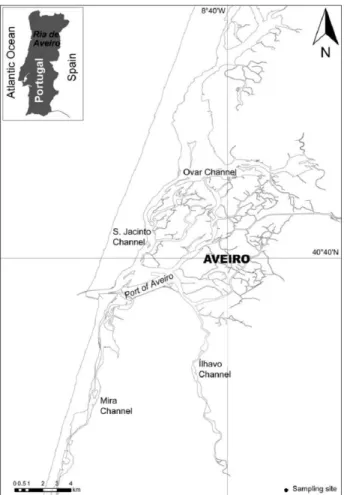
Figure 2.1. Study area: Ria de Aveiro. ... 15
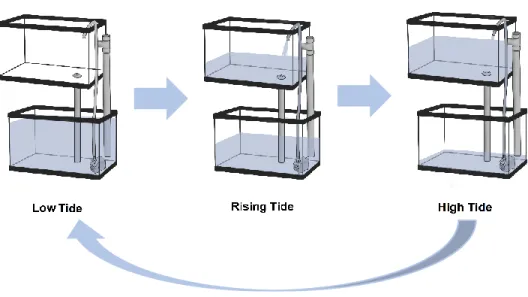
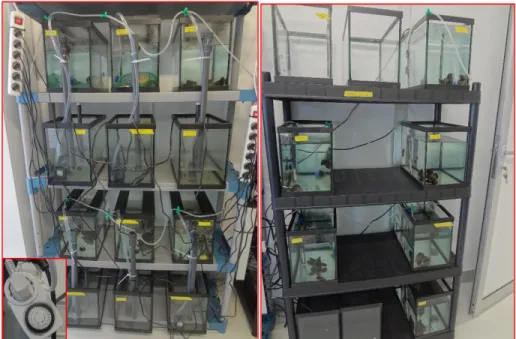
Figure 2.2. Experimental design of the automatic system developed to simulate tidal regime. ... 17
Figure 2.3. Experimental setup in one climatic room. Aquariums on the left were linked to a timer to simulate tidal regime while on the right organisms were always kept submersed, half of the aquariums were contaminated with MWCNTS. ... 18
Figure 2.4. Mussels’ dry shells and tissue after being carefully separated and put in an oven. ... 22
Figure 2.5. Homogenization process of mussels’ dry tissue. ... 22
Figure 2.6. Homogenization process of mussels’ frozen tissue with liquid nitrogen. ... 23
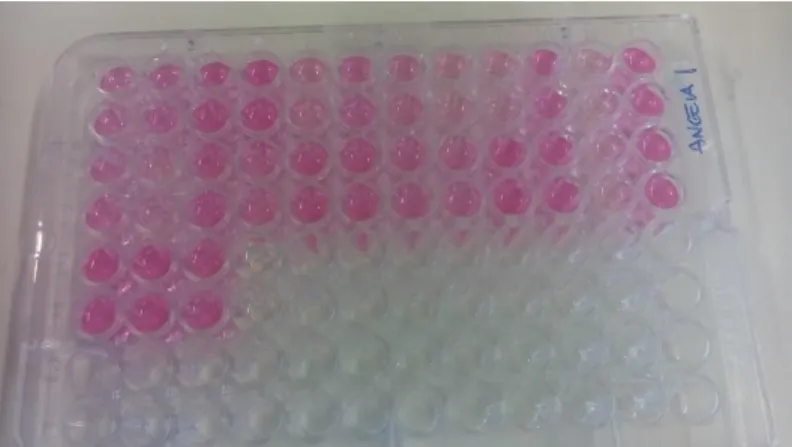
Figure 2.7. LPO colored samples after the reaction being stopped. ... 25
Figure 2.8. Samples with DNPH changing color by reacting with NaOH. ... 26
Figure 3.1. A: Respiration Rate (RR); B: Condition Index (CI), in Mytilus galloprovincialis always submersed (Sub) and exposed to tides (Tide) conditions for 14 days. Results are the means + standard errors. White bars represent organisms submersed during the entire experiment while gray bars represent organisms exposed to tides. Different letters represent significant differences (p≤0.05) between conditions. ... 32
Figure 3.2. A: Electron transport system (ETS) activity; B: Glycogen (GLY) content; C: Lipids (LIP) content, in Mytilus galloprovincialis always submersed (Sub) and exposed to tides (Tide) conditions for 14 days. Results are the means + standard errors. White bars represent organisms submersed during the entire experiment while gray bars represent organisms exposed to tides. Different letters represent significant differences (p≤0.05) between conditions. ... 33
Figure 3.3. A: Lipid peroxidation (LPO) levels: B: Oxidized glutathione (GSSG) content; C: Protein carbonylation (PC) levels, in Mytilus galloprovincialis always submersed (Sub) and exposed to tides (Tide) conditions for 14 days. Results are the means + standard errors. White bars represent organisms submersed during the entire experiment while gray bars represent organisms exposed to tides. Different letters represent significant differences (p≤0.05) between conditions. ... 35
Figure 3.4. A: Superoxide dismutase (SOD) activity; B: Catalase (CAT) activity; C: Glutathione peroxidase (GPx) activity, in Mytilus galloprovincialis always submersed (Sub) and exposed to tides (Tide) conditions for 14 days. Results are the means + standard errors. White bars represent organisms submersed during the entire experiment while gray bars represent organisms exposed to tides. Different letters represent significant differences (p≤0.05) between conditions. ... 37 Figure 3.5. A: Respiration Rate (RR); B: Condition Index (CI), in Mytilus galloprovincialis
exposed to different conditions (Sub, Sub+Temp, Tide, Tide+Temp) for 14 days. Results are the means + standard errors. White bars represent organisms submersed during the entire experiment while gray bars represent organisms exposed to tides. Continuous line represent control temperature while dashed line represent increased temperature. Different letters represent significant differences (p≤0.05) among conditions. ... 39 Figure 3.6. A: Electron transport system (ETS) activity; B: Glycogen (GLY) content; C: Lipids (LIP) content, in Mytilus galloprovincialis exposed to different conditions (Sub, Sub+Temp, Tide, Tide+Temp) for 14 days. Results are the means + standard errors. White bars represent organisms submersed during the entire experiment while gray bars represent organisms exposed to tides. Continuous line represent control temperature while dashed line represent increased temperature. Different letters represent significant differences (p≤0.05) among conditions. ... 41 Figure 3.7. A: Lipid peroxidation (LPO) levels: B: Oxidized glutathione (GSSG) content; C: Protein carbonylation (PC) levels, in Mytilus galloprovincialis exposed to different conditions (Sub, Sub+Temp, Tide, Tide+Temp) for 14 days. Results are the means + standard errors. White bars represent organisms submersed during the entire experiment while gray bars represent organisms exposed to tides. Continuous line represent control temperature while dashed line represent increased temperature. Different letters represent significant differences (p≤0.05) among conditions. ... 43 Figure 3.8. A: Superoxide dismutase (SOD) activity; B: Catalase (CAT) activity; C: Glutathione peroxidase (GPx) activity, in Mytilus galloprovincialis exposed to different conditions (Sub, Sub+Temp, Tide, Tide+Temp) for 14 days. Results are the means + standard errors. White bars represent organisms submersed during the entire experiment while gray bars represent organisms exposed to tides. Continuous line represent control temperature while dashed line represent increased temperature. Different letters represent significant differences (p≤0.05) among conditions. ... 45 Figure 3.9. A: Respiration Rate (RR); B: Condition Index (CI), in Mytilus galloprovincialis
exposed to different conditions (Sub, Sub+MWCNTs, Tide, Tide+MWCNTs) for 14 days. Results are means + standard errors. Different letters represent significant differences (p≤0.05) among conditions. ... 47 Figure 3.10. A: Electron transport system (ETS) activity; B: Glycogen (GLY) content; C: Total lipid (LIP) content, in Mytilus galloprovincialis exposed to different conditions (Sub, Sub+MWCNTs, Tide, Tide+MWCNTs) for 14 days. Results are means + standard errors. Different letters represent significant differences (p≤0.05) among conditions. ... 49
Figure 3.11. A: Lipid peroxidation (LPO) levels: B: Oxidized glutathione (GSSG) content; C: Protein carbonylation (PC) levels, in Mytilus galloprovincialis exposed to different conditions (Sub, Sub+MWCNTs, Tide, Tide+MWCNTs) for 14 days. Results are means + standard errors. Different letters represent significant differences (p≤0.05) among conditions. ... 51 Figure 3.12. A: Superoxide dismutase (SOD) activity; B: Catalase (CAT) activity; C: Glutathione peroxidase (GPx) activity, in Mytilus galloprovincialis exposed to different conditions (Sub, Sub+MWCNTs, Tide, Tide+MWCNTs) for 14 days. Results are means + standard errors. Different letters represent significant differences (p<0.05) among conditions. ... 53
List of Abbreviations
GHG – greenhouse gases NPs – nanoparticles
CNPs – carbon-based nanoparticles CNTs – carbon nanotubes
PECs – predicted environmental concentrations SWCNTs – single-walled carbon nanotubes MWCNTs – multi-walled carbon nanotubes
MWCNT-COOH – functionalized/oxidized MWCNT NCB – nano carbon black
C60 – C60-fullerene nTiO2 – nano-titatinum
n-SiO2 – nanosilica
ROS – reactive oxygen species SOD – superoxide dismutase CAT – catalase
LPO – lipid peroxidation GPx – glutathione peroxidase GSH – reduced glutathione GSSG – oxidized glutathione LIP – total lipid
GLY – glycogen
ETS – electron transport system CI – condition index
RR – respiration rate DW – dry weight FW – fresh weight
1
Chapter 1
General Introduction
2
1.1. Estuaries and associated environmental alterations
Coastal systems are dynamic and frequently subjected to natural and anthropogenic changes. In fact, being commonly defined as the interface or transition between sea and land (FAO, 1998), coastal areas are exposed to a wide variety of environmental factors affecting them. In particular, estuaries are often semi-closed coastal systems with a restricted opening to the sea and are highly related to the tidal environment. The tidal cycles, being semidiurnal, diurnal, weekly, fortnightly, equinoctial and annual, along with the processes caused by the interaction of freshwater and seawater, the wind, rainfall, evaporation and other oceanic events such as upwelling, currents and storms with the spatially and temporally varying bathymetry and geomorphology, result in the fact that estuaries have never a steady state on its hydrodynamic regimes (Dyer, 1997; Prandle, 2009).
Estuaries also provide habitats and food source to a wealth of wildlife within the intertidal and subtidal zones, making these ecosystems extremely ecological and economical valuables. In fact, these are some of the several essential ecological functions of estuaries in combination with others such as high biological productivity, hydrological regulation and the biogeochemical cycling of metals and nutrients (Caçador et al., 2007; Mitsch and Gosselink, 2015; Xiao and Li, 2004). However, estuaries are also important human and industry settlement places, being therefore subjected to increasing environmental stress (Haslett, 2008).
The estuarine ecological functions are highly dependent on physical and chemical disturbances from natural to anthropogenic sources, typical of transitional coastal ecosystems (Dauvin and Ruellet, 2009; Elliott and Quintino, 2007). Therefore, and due to their nature, coastal systems such as estuaries, represent one of the hardest environments to endure for inhabiting organisms. Among the most stressful conditions to face, species that inhabit these areas are subjected to tides and a large variation of climatic conditions, such as temperature, salinity, as well as high desiccation risk and oxygen availability between aquatic and aerial conditions (Davis, 1985; Freire et al., 2011; Horn et al., 1999, Underwood and Kromkamp, 1999). Furthermore, inputs of chemicals associated with industrial, domestic and agriculture activities from the surrounding areas is another disturbance that these organisms must cope with in a daily basis (Amiard-Triquet and Rainbow, 2009, Elliott et al., 2014).
3
1.1.1. Tidal regime
Intertidal organisms are daily subjected to air exposure due to a tidal regime typical of coastal systems. At the sea, tides are a sequence of sinusoidal, tidal harmonic components which differ for every location. Depending on their sequence, tides are giving different nominations such as flood tide during rising tide, ebb tide during falling tide and slack water during intermediate periods (Wolanski and Elliot, 2015). However, in estuaries tides are distorted as they propagate these coastal systems being the point at which they are no longer observable called the tidal intrusion limit or tidal limit (Prandle, 2009). Moreover, tides are often asymmetric in these coastal areas since ebbs and flood tides may differ in duration. This asymmetry is controlled principally by the bathymetry, bottom friction and the river inflow of the estuary, being considered a function of its hydromorphology (Wolanski and Elliot, 2015).
In intertidal conditions, organisms may have to avoid or withstand exposure to desiccation, osmotic stress, temperature stress and UV radiation, in addition to exposure to air during ebb tides (Rawlings, 1999). Tidal regime may also act as a stressor by frequent re-immergence in intertidal organisms. Furthermore, as a consequence of air exposure, organisms may also face prolonged hypoxia or/and anoxia conditions, which may bring negative impacts to these organisms (Almeida and Bainy, 2006; Altieri, 2006; Andrade et al, 2018; Chandurvelan et al., 2013; Letendre et al. 2008, 2011; Yin et al., 2017). It is known that organisms may exhibit structural, behavioral and physiological adaptations in response to these stressors. In fact, in these intertidal habitats, it is visible a distribution and vertical zonation of intertidal communities affected by the temperature gradients, desiccation and oxygen availability, especially for sessile and sedentary organisms (Menconi et al., 1999; Newell, 1979; Wethey, 1983; Zandee et al., 1986). Different organisms have also shown physiological responses such as increased thermal resistance (Sokolova et al., 2000), heat stability of key metabolic enzymes (Sokolova et al., 2003), and stress-induced expression of heat stress proteins (Tomanek and Somero, 2000). During ebb tides, organisms as bivalves have been demonstrating behavioral responses as closing their valves undergoing anaerobic metabolism or exhibiting alternate valve closure and using valve gaping allowing the maintenance of aerobic respiration under hypoxia conditions (Famme and Kofoed, 1980; Widdows et al., 1979).
Although some of the intertidal organisms’ responses to the tidal regimes are well documented, the biochemical and physiological impacts induced by re-immersion in organisms
4
in this type of environment, especially under laboratory conditions, are still even scarcer. Furthermore, scientific literature about the consequences of this frequent exposure to air in combination with other abiotic factors such as temperature differences due to climate change and anthropogenic contamination are still scarce.
1.1.2. Climate change: temperature increase
Due to climate change, intertidal organisms may face environmental stresses in addition to air exposure during tidal regimes. Furthermore, daily and seasonal environmental changes during the tidal regime such as temperature, salinity and pH differences may be enhanced with the global climate change. Its is known in fact that climate change is influencing global temperature, oceans’ pH, salinity and other factors such as rising sea levels, which in consequence influences coastal systems and the organisms present in these ecosystems (IPCC, 2014; Letcher, 2009). In particular, the marine organisms such as intertidal organisms, are frequently exposed to natural changes of these factors presenting high tolerance to them in a wide range of values. These organisms are subjected to extreme temperatures resulting in frequent fluctuations of over 30ºC in their bodies temperature (Helmuth et al., 2003). Furthermore, intertidal organisms also live close to their physiological tolerance limits being subjected to other stressors such as desiccation, rapid fluctuations in salinity, oxygen availability and nutrients levels (Burnett, 1997; Davenport and Macalister, 1996; Foster, 1971; Hutchins, 1947; Li and Brawley, 2004; Wolanski and Elliott, 2015). In this way, with the enhanced stressors due to climate change, organisms’ tolerance level may be exceeded with negative impacts at different biological levels.
In particular, as a consequence of global climate change, the increase in temperature may cause deleterious effects in intertidal organisms (IPCC, 2007). It is known that the cumulative emissions of anthropogenic greenhouse gases (GHG) such as carbon dioxide (CO2), methane (CH4) and nitrous oxide (N2O) in the last decades driven by economic and
population growth are extremely correlated to the global warming observed since the mid-20th
century (IPCC, 2014). In fact, these GHGs absorb long-wave infrared radiation emitted from the earth’s surface, reflecting back afterwards and trapping the energy associated within the atmosphere, consequently increasing earth’s surface temperature in comparison to when the GHGs were low (Reddy and DeLaune, 2008). The predicted continuous increase of mainly
5
atmospheric CO2 until the end of the 21st century is considered one of the most important
factors contributing to global warming (1.0-4.0ºC) and consequently, to an increase of the global mean air and ocean temperatures (IPCC, 2007). As a consequence, the glacial melting and thermal expansion of oceans will increase the sea level, thus flooding of coastal regions as estuaries and shifting the wetland areas in direction to landward (Reddy and DeLaune, 2008).
Intertidal organisms that are exposed to increased temperatures associated with aerial exposure may be subjected to extreme desiccation events (IPCC, 2001). Different studies have already demonstrated that temperature exceeding the organisms’ thermal tolerance range can cause physiological and molecular perturbations, as in the individuals’ growth and reproduction (Pörtner and Knust, 2007; Boukadida et al., 2016) and, in addition, the decrease of aerobic capacity, metabolic rate and respiratory capacity (Jansen et al., 2009; Pörtner et al., 2005, 2010; Velez et al., 2017). It is also known that extreme desiccation events, not only can have sublethal and lethal consequences at the populations’ phenotypic traits (Jones & Boulding, 1999) but, as well, at the individuals’ physiology (Helmuth & Hofmann, 2001; Tsuchiya, 1983; Silva et al., 2005b). Furthermore, warming can also enhance reactive oxygen species (ROS) production in the cells (Kefaloyianni et al., 2005; Verlecar et al., 2007), leading to oxidative stress.
1.1.3. Emerging contaminants: nanoparticles in the environment
Pollution may be defined as the result of adding a xenobiotic material in an ecosystem where it brings biological effects and often a reduction in the health of the system (McLusky and Elliot, 2004). The reduction in health may be manifested in different biological levels, from cell to individual, and consequently population, community and ecosystem, with the effect of the xenobiotic moving though each level unless the system can absorb it or there is a survival of one component (i.e. cell, individual, population, etc) without its functions being debilitated (Tett et al., 2013). Estuaries are dynamic interface zones between water draining from inland river basins and oceans, and for this reason normally receive high concentrations of natural and anthropogenic materials (Amiard-Triquet and Rainbow, 2009; Müller et al., 1995; Lopes et al., 2011). Furthermore, xenobiotics from different anthropogenic sources are increasing in marine ecosystems which can cause adverse effects (Fu et al., 2003; Maanan, 2008).
6
An emergent field in the industry and science that has been increasing in the last years is the nanotechnology. In fact, nanoparticles (NPs) have been increasingly used in numerous applications including medicine, chemistry and electronics (Renn and Roco, 2006) and, thereby, the increased introduction of these materials into the aquatic systems is expected to occur. Nanomaterials, as NPs may be defined as a natural, incidental or manufactured material with dimensions between 1 and 100 nm containing 50% or more particles in an unbound, aggregated or agglomerated state (EC, 2011). Due to their unique physical and chemical properties there has been an increase of production and research on NPs at a global level. However, besides anthropogenic sources, NPs are also naturally released in the environment by natural sources (e.g. volcanos and forest fires) (Mottier et al., 2017).
Among NPs, carbon-based NPs (CNPs) present a diversity of applications (Solarskaciuk et al., 2014; Vlasova et al., 2016; Wu et al., 2013; Muller and Nowack, 2008; Köhler et al., 2008). In fact, these CNPs are already been used in daily life products such as paints, energy storage and waste water treatment being very likely released to the environment (Keller et al. 2013, Mitrano et al., 2015; Petersen et al., 2011). Among the most important CNPs are carbon nanotubes (CNTs) (Eckelman et al., 2012; Sanchez et al., 2012; Scown et al., 2010), recently detected in aquatic systems at predicted environmental concentrations (PECs) of approximately 0.001-1000 µg/L reported from the most recent literature (see for example Zhang et al., 2017; De Marchi et al., 2018b).
CNTs are constituted by hollow graphene cylinders which can be divided in single-walled (SWCNTs) with 0.7 to 3nm of diameter, and multi-single-walled (MWCNT) with 10 to 25nm of diameter (Baughman et al., 2002). In the aquatic environment CNTs can be easily accumulated by the aquatic biota through body surface, digestive and respiratory system (Jackson et al., 2013) due to their hydrophobic and non-biogradable nature, making the dispersion of CNTs in the water rather difficult (Donaldson et al., 1998). Because of their property to easily aggregate in solution, particularly in saltwater (Kataoka et al., 2016), CNTs are functionalized through chemical modifications such as amidation and esterification of the nanotube-bound carboxy acids making them more dispersible (Sun et al., 2002). The nanotubes dispersibility is increased by breaking the nanotubes bundles essential to solubility (Sun et al., 2002) and by eliminating the functional groups on nanotubes surface (Shahnawaz et al., 2017). In fact, inserting polar groups as carboxyl groups (-COOH) in the chemical functionalization of CNTs (Figure 1.1. A), is one of the most used approaches to produce better dispersibility of CNTs in
7
aqueous media (Figure 1.1. B) (Shahnawaz et al., 2017). CNTs with higher water dispersible characteristics have shown to induce higher levels of toxicity to biological systems (Arndt et al., 2013; Kataoka et al., 2016). Although the use of CNTs is increasing at global levels, their biochemical and physiological impacts towards aquatic organisms are still very limited.
Figure 1.1. A- Surface functionalization of MWCNT surface; B- Solubility of pristine MWCNT and MWCNT-COOH in different solvents (from left to right, deionized water, dichloromethane, methanol, and hexane) (Adapted from Salam et al., 2017).
A
8
1.2. Marine bivalves as bioindicators
Bivalves are easily identified by their two shell valves connected by an elastic ligament. The shell is mainly composed by calcium carbonate (CaCO3) where this mineral component
represents more than 95% of the shell weight (Gosling, 2015). The vast majority of bivalves are suspension- or filter-feeding organisms where their gills, with several ciliary tracts, are used to remove suspended particles in the water that was before pumped through the mantle cavity. Most bivalves have sessile adult lives which, such as oysters and mussels, attach themselves to hard surfaces using byssal threads making them sessile epifaunal bivalves (Gosling, 2015).
The sessile and feeding condition of the majority of the bivalves, leads to the constant exposure of most environmental and biological stressors, reflecting site-specific conditions. In fact, bivalves are regularly subject to abiotic stressful conditions, such as variations in temperature, salinity and oxygen availability, alterations on food availability and in the quality of the surrounded environment (Almeida et al. 2007; Davis 1985; Gagné et al., 2006; Horn et al., 1999). It is known that these abiotic factors may affect marine bivalve species (Carregosa et al., 2014b; Parker et al 2013). Furthermore, bivalves are known to tolerate high concentrations of xenobiotics, however their ability to filter high quantities of water either for feeding or respiration may result in ecotoxicological effects resulted in any xenobiotic dissolved or suspended in the water column and thus, providing a strong and specific response to these pollutants (McEneff et al., 2013). In addition to these factors, bivalves are also organisms with a high abundance and widespread distribution which makes them excellent bioindicator organisms (Catsiki and Florou, 2006; Faggio et al., 2016; Hamze-Chaffai, 2014; Kristan et al., 2014; McEneff et al., 2014; Oliveira et al., 2017). A bioindicator species may be defined as a species or group of species that can reflect and/or reveal the impacts of environmental changes on a population, community or ecosystem (Hamze-Chaffai, 2014).
Because of their habitat characteristics, bivalves present a natural wide range of tolerance to abiotic factors, however under climate changes the limit of abiotic tolerance can be reached (Bielen et al., 2016; Rodrigues et el., 2015). For the assessment of the effects of different abiotic factors such as temperature, salinity and pH on marine invertebrates, bivalves have been recurrently used as model organisms (Anestis et al., 2007; Carregosa et al., 2014b; Dickinson et al., 2012).
9
1.2.1. Responses of bivalves to air exposure
In intertidal areas, as a consequence of air exposure, organisms may face prolonged hypoxia and/or anoxia conditions. Although marine bivalves are among the most hypoxia tolerant macrofauna (Abele et al., 2009; Gray et al., 2002), the impacts of air exposure on the physiological performance of several bivalves have already been observed.
Different bivalves already showed an induction of oxidative stress related to air exposure and reoxygenation. Studies demonstrated for example an increase on antioxidant defenses in the mussels Perna perna and Mytilus galloprovincialis as a defense mechanism against oxidative stress during reoxygenation (Almeida and Bainy, 2006, Andrade et al., 2018). The same biochemical response was observed in Ruditapes philippinarum clams daily exposed to rhythms of air (Yin et al., 2017). Furthermore, in the same study, clams showed lower survival and growth when exposed to increased duration of air exposure (from 0h, 3h, 6h to 9h) after 60 days. The mussels Mytilus edulis demonstrated over-expression of proteins specially involved in cytoskeleton, chaperoning, energetic metabolisms and transcription regulation after emerged conditions (Letendre et al., 2011). For the same species, differences in hypoxia tolerance between mussels transplanted in the upper intertidal and the mussels transplanted in the subtidal portion of their natural depth distribution were observed (Altieri, 2006).
It is known that some bivalves, close their valves when exposed to air (Dowd and Somero, 2013; Nicastro et al., 2010). As a consequence, intertidal bivalves may face complete anoxia while closing their shells at ebb tides to avoid from suffering desiccation, although others may prevent anoxia by simply opening the valves for air gaping as a behavioral adaptation (Rivera-Ingraham et al., 2013).
1.2.2. Responses of bivalves to warmer temperature
The thermal tolerance under changing temperatures have been the focus of many studies (Pörtner and Knust, 2007). Under warmer temperatures, bivalves tend to increase feeding and metabolic rates, leading to an increase in growth and reproduction within the species thermal optimum range with the existence of sufficient food and oxygen (Filgueira et al., 2016). However, with the global warming these conditions may not be obtained and the increase in temperature may negatively affect shellfish.
10
Studies have been demonstrating that exceeding organisms’ thermal tolerance range may cause physiological and molecular perturbations. In M. galloprovincialis the increased of temperature has displayed an increase of the number in abnormal larvae demonstrating a possible impairment of this mussel’s reproduction due to increased temperature (Boukadida et al., 2016). Different bivalves have been demonstrating decreased aerobic capacity, metabolic rate and respiratory capacity under increased temperatures (Jansen et al., 2009; Pörtner et al., 2005; Velez et al., 2017)
The induction of oxidative stress has also been observed in different bivalves exposed to warming conditions. M. galloprovincialis mussels showed an increase of gene expression levels related to antioxidant enzymes and metallothioneins when exposed to heat stress (Banni et al., 2014). In the same organism, significant variations in the immune system were also observed due to increased temperature (Nardi et al., 2017). The clams Ruditapes decussatus
and R. philippinarum displayed an induction of electron transport system and antioxidant enzyme activities, as well as the expression of a chaperone function related gene at an increased temperature of 21ºC (Velez et al., 2017). However, R. decussatus presented a different behavior at 25ºC where results suggested valve closure as a behavioral strategy as well as down-regulating in the expression of genes related with mitochondrial metabolism and chaperone function, while at same temperature, R. philipinarum increased electron transport system and antioxidant enzyme activities, as well the expression of genes related to apoptosis and molecular chaperone (Velez et al., 2017). M. coruscus mussels displayed an increase of enzymatic activity such as superoxide dismutase, catalase, glutathione peroxidase, reduced glutathione, acid phosphatase, alkaline phosphatase and glutamic-pyruvic transaminase with increased temperature (Hu et al., 2015).
1.2.3. Responses of bivalves to nanoparticles
Being emergent pollutants the presence of NPs in the aquatic environmental has been increasing in the last years. In terms of nanoparticle toxicology, it has been suggested that suspension-feeding invertebrates as bivalves mollusks may represent an unique target group (Moore, 2006). In fact, these organisms have developed processes as endocytosis and phagocytosis for the cellular internalization on NPs and microparticles, which are crucial in physiological functions as intra-cellular digestion and cellular immunity (Canesi et al., 2010b).
11
In marine bivalves, the effects of different NPs were already demonstrated. Nano carbon black (NCB) exposure in M. galloprovincialis mussels was shown to induce inflammatory processes (Canesi et al., 2008). In the same organism, exposure to NCB, C60-fullerene (C60), nano-titatinum (nTiO2) and nanosilica (n-SiO2), increased the activation of the
antioxidant enzyme catalase, with n-TiO2 also increasing glutathione transferase (Canesi et al.,
2010a). Exposure to aqueous suspensions of carbon nanoparticles (C60) in these mussels also demonstrated to induce cytotoxicity in circulating phagocytic hemocytes, which is a crucial component of the mussels’ immune system (Moore et al., 2009). M. edulis mussels exposed to Fe2O3 nanoparticles showed to suffer impairment of lysosomal stability in circulating blood cells
and lipid peroxidation (Kádár et al., 2010). Furthermore, exposure to MWCNTs in the clam R. philippinarum revealed altered energy-related responses, with differences in the metabolic capacity and energy reserves. In addition, this specimen also suffered oxidative stress and neurotoxicity (De Marchi et al., 2017c, 2018a).
1.3. Objectives
In the environment mussels are subjected to tidal changes which may act as a confounding factor when assessing the impacts induced in these organisms by pollutants, such as CNTs, and abiotic changes, as temperature increase. In fact, when mussels are used in environmental monitoring programs and specially under laboratory conditions, it is not considered their natural environment and the possible derived implications to assess the impacts of other stressors. Moreover, it’s possible that the tidal changes may alter organisms’ tolerance and responses to contaminants and abiotic factors, as air temperature and CNTs. Within this context, the present study aimed to evaluate if physiological and biochemical alterations imposed by the presence of multi-walled CNTs (MWCNTs) or increased temperature were dependent on the submersion/tidal regime, to better understand the possible interactions of exposure to air with warming (Figure 1.2. A) or MWCNTs exposure (Figure 1.2.
12
Figure 1.2. Graphical representation of possible interactions between: A – Air exposure and
different temperatures; B – Air exposure and MWCNTs.
13
Chapter 2
Material and Methods
14
2.1. Test organisms
Among bivalves, mussels have been extensively used to assess environmental contamination. Among mussels, M. galloprovincialis (Lamarck, 1819) is widely distributed from temperate to subarctic coasts across the globe, inhabiting generally infra littoral areas from the top of the intertidal zone to depths of a few meters (FAO, 2016; Vazzana et al., 2016). In Portugal, this species exists along the entire coast as well in the northern areas of the Iberian Peninsula (Mitchelmore et al., 1998), being present on rocky areas, cliffs, boulders or substrates that are relatively movable (ropes) and to which it adheres (FAO, 2016; Vazzana et al., 2016). Although being native in Portugal, this species was introduced in various locations across the globe most likely due to its association with large shipping ports being transported via ballast water or hull fouling, were it colonized and formed naturalized populations (Branch and Steffani, 2004).
Although considered an invasive species in some locations M. galloprovincialis may also be ecological and economic relevant. In fact, this mussel can improve water quality thought the filtration of particles and excess of nitrogen in aquatic environment (Shumway et al., 2003). The invasion of this species has also benefit a near-threatened bird species, the African black oystercatcher Haemotopus moquini, which switched its diet to this mussel and increased its food availability this way (Hockey and Schurink, 1992). There’s a high wordwide annual production of M. galloprovincialis, estimated to around 116 269 tonnes in 2014 (FAO, 2016) and aquaculture facilities for this production can also provide refuge to fish or even function as a nursery ground for juvenile fish and crustaceans (Shumway et al., 2003).
M. galloprovincialis is frequently exposed to tidal changes and, as a sedentary filter feeding organism, has also the capacity to accumulate pollutants from the environment and reflect the imposed toxic impacts. Furthermore, bivalves are known to tolerate high concentrations of xenobiotics and provide a strong and specific response to pollutants and, for these reasons, M. galloprovincialis has been widely used as a bioindicator species (Catsiki and Florou, 2006; Faggio et al., 2016; Kristan et al., 2014; Oliveira et al., 2017; Sureda et al., 2011). These organisms, present in a wave-exposure environment associated to rocky intertidal shores, appear to exhibit adaptive physiological, behavioral and morphological traits (Dowd et al., 2013; Sherratt and Mackenzie, 2016) such as the valves closure to protect from stressful conditions (Gazeau et al., 2013; Ishii et al., 2005; Poulain et al., 2011).
15
2.2. Sampling area
In the present study, M. galloprovincialis specimens were collected in an intertidal area at the Mira Channel in the Ria de Aveiro (Figure 2.1.). Ria de Aveiro is a shallow coastal lagoon in the Northwest of Portugal and represents one of the most important estuarine systems in the country. Between low and high spring tides, the Ria de Aveiro comprises an area between 66 and 83 km2 being 45 km long, 10 km wide and connected to the ocean by a single inlet (Dias
and Lopes, 2006). Furthermore, its characterized by a very complex geometry of distinct intertidal areas, such as mud flats and salt marshes, and a web of narrow channels (Dias et al., 2000; Dias and Picado, 2011). Connected to the ocean entrance, there are four main branches: Mira, S.Jacinto, Ílhavo and Espinheiro channels (Picado et al., 2010). Among them, the Mira channel is considered the least impacted channel (Castro et al., 2006), while Estarreja channel together with Laranjo Bay are considered the most impacted areas due to substantial contamination in bottom sediments (Pereira et al., 2008).
16
The hydrology of Ria de Aveiro is tidal dominated (Dias et al., 1999) where the strongest currents reaching values higher than 2 m/s are predominated at the inlet channel (Vaz et al., 2009). In fact, the water circulation is dominated by the seawater input (70 x 106 m3 in spring
tides) rather than by the input of freshwater (1.8 x 10⁶ m3 per tidal circle) (Moreira et al., 1993).
The tidal inputs are effectuated from the navigation channel (Dias et al., 1999) and fresh water discharges ranging between 1.0 to 61.3 m3/s from rivers and streams that flow into Ria de
Aveiro, being the most notorious, Rio Vouga, Antuâ, Fontão and Boco (Dias et al., 2003; Santos et al., 2014). It is also notorious a seasonal and spatial gradient of salinity in this lagoon (Dias et al., 2011). With the combined effects of the freshwater and tidal inputs, the longitudinal gradient of salinity can go from 0 near the river entrances to about 36 at the inlet channel (Lopes et al., 2007).
The Ria de Aveiro can also be considered one of the most important coastal systems of Portugal in a conservationist point of view. This lagoon presents a large number of characteristics and biotopes that makes life ideal to a large number of different species, such as salt marshes (Sousa et al., 2017a), seagrass meadows of Zostera noltei (Azebedo et al., 2013; Sousa et al., 2017b) and dune systems (Lopes et al., 2007). In the case of the benthic populations distribution, such as the species used in this work, there is a high correlation with to the lagoon hydrodynamics and salinity gradients (Rodrigues et al., 2011).
2.3. Experimental conditions
After sampling, the collected mussels in Mira channel were placed in aquaria for depuration and acclimation to laboratory conditions for 7 days. Artificial seawater (salinity 35 ± 1), made with artificial salt (Tropic Marin®SEA SALT from Tropic Marine Center) and deionized water, was used. In order to resemble estuarine conditions, organisms were maintained during this period at 18ºC ± 1.0 ºC and pH 8.0 ± 0.1, and kept under continuous aeration during a 12 h light: 12 h dark photoperiod.
For the laboratory experiment, organisms were distributed into different aquaria (20 L seawater, salinity 35), with six individuals per aquarium and three aquaria per treatment. The treatments tested were divided in three experimental setups. For the first experimental setup, submersed under control temperature (Sub) and exposure to tides simulation under control
17
temperature (Tide) treatments were considered. For the second experimental setup, submersed under increased temperature (Sub+Temp) and exposure to tides simulation under increased temperature (Tide+Temp) treatments were considered, using the first experimental setup as control treatments. For the third experimental setup, submersed with MWCNTs 0.01 mg/L at control temperature (Sub+MWCNTs) and exposed to tidal simulation with MWCNTs 0.01 mg/L at control temperature (Tide+MWCNTs) treatments were considered, using the first experimental setup as control treatments as well. Aquaria were placed in two different climatic rooms to maintain the temperature levels at 18 ± 1.0 ºC (control temperature) and 21 ± 1.0 ºC (increased temperature). For the tidal simulation, an automatic system that mimicked the estuary tidal regime typical of this species habitat (5 hours of low tide and 7 hours of high tide cycles) was developed and used (Figure 2.2.). Figure 2.3. illustrates the experimental setup performed in this work.
18
Figure 2.3. Experimental setup in one climatic room. Aquaria on the left were linked to a timer to simulate tidal regime while on the right organisms were always kept submersed, half of the aquariums were contaminated with MWCNTS.
The control temperature of 18 ± 1.0 ºC was chosen considering the average temperature of the sampling area during September (IPMA, 2017). To simulate warming conditions, temperature of 21 ºC was selected taking in account the annual range of average temperatures (13.4-22.9 ºC) for M. galloprovincialis habitats in the Ria de Aveiro (Coelho et al., 2014; Santos et al., 2009; Velez et al., 2015) and considering the predicted increase of temperature from 1.0 ºC to 4.0 ºC (IPCC, 2007).
The concentration of MWCNTs used was chosen taking in account previous works carried out by De Marchi et al. (2017b, 2017c, 2018) in the clam R. philippinarum and the polychaetes D. neapolitana and H. diversicolor, where 0.01 mg/L was the lowest concentration inducing observable physiological changes and following the predicted environmental concentrations (PECs) of CNTs in aqueous systems (0.001-1000 µg/L).
During the experimental period (14 days) organisms were fed three times per week with Algamac protein plus (107 cells/animal). After 7 days of beginning of the experiment, seawater was renewed re-establishing seawater characteristics, including salinity, temperature, pH and MWCNTs concentration. An experimental period of 14 days was chosen taking in account
19
previous studies in mussels (Andrade et al., 2018; Hu et al., 2015; Huang et al., 2018; Letendre et al., 2011; Verlecar et al., 2007) which observed physiological changes after this period.
At the end of the experimental period (14 days), the organisms were immediately frozen at -80 ºC until analysis with the exception of two organisms per aquarium which were immediately used for respiration rate determination. After each week, water samples were taken right before of seawater renewal to characterize MWCNTs in the water column.
2.4. MWCNTs characterization
The functionalized MWCNTs were produced via catalytic carbon vapor deposition (CCVD) process. These carbon nanoparticles were purchased from Times Nano: Chengdu Organic Chemicals Co. Ltd., Chinese Academy of Sciences (MWCNTs-COOH: TNMC1 series, http://www.timesnano.com and manufacturer specifications of: diameter 2-5 nm; length 10-30 μm; carbon purity 98%; surface area 400m2/g; amorphous carbon 8-10% and -COOH 3.86 wt%).
The concentration of MWCNTs used in this study (0.01 mg/L) was prepared from a stock solution of 50 mg/L concentration. For particles characterization, the average size distribution of MWCNTs suspensions in seawater in each exposure condition was analyzed by dynamic light scattering (DLS), using a DelsaTM NanoC Particle Size Analyser (Beckman Coulter). Measurements were performed on 1 mL of suspension measurements and each analysis was repeated three times.
The hydrodynamic radius and polydispersity index (PDI) of the analysed dispersions were calculated on three replicates of each sample collected after a week of the experimental period by using the cumulant method. Undetected colloidal material at the end of each measurement was indicated as Invalid data (I.d.).
2.5. Biological responses
Physiological indicators are used to study the existence of seasonal metabolic variations normally attributed to the changes in environmental parameters as environmental stressors and the physiological status (Livingstone, 2001; Schiedek et al., 2006; Schmidt et al.,
20
2013). Respiration rate (RR) may also be used to assess the alterations induced by different stressors in organisms (Gestoso et al., 2016; Freitas et al., 2017; Wang et al., 2015). Furthermore, the condition index (CI) is the index most frequently used which provides information on both the physiological status and the growth of organisms (Andral et al., 2004).
The metabolic capacity of marine organisms and energy reserves can further provide information on the organisms’ physiological status. In this respect, the energy production at the mitochondrial level such as the electron transport activity (ETS) and energy reserves for metabolism such as glycogen (GLY) and total lipid (LIP) content and can be estimated, giving thus an indication of organisms’ metabolic capacity (Coen and Janssen, 1997, 2003).
When organisms are exposed to natural and anthropogenic stressors, the production of reactive oxygen species (ROS) may affect especially lipids, proteins, carbohydrates and nucleic acids (Freitas et al., 2016a). When organisms are then exposed to oxidative stress, a cascade of defensive reactions is activated in order to cope with the ROS overproduction. This process attempts to protect the cells and tissues avoiding severe and generalized pro-oxidative damage (Correia et al., 2016). Some biomarkers related to oxidative stress and oxidative damage can then be determined for the assessment of the contaminant and abiotic stressors in the organism. When cells’ defense mechanisms fail or are insufficient, the lipids attacked by radicals and ROS, initiate an autocatalytic oxidative process known as lipid peroxidation (LPO) were lipids are oxidized generating lipid hydroperoxides (Catalá, 2009; Freitas et al, 2016a; Regoli and Giuliani, 2014). There is an antioxidant enzymatic mechanism involving glutathione peroxidase (GPx), which reduces lipid hydroperoxides, with the consequent oxidation of reduced glutathione (GSH) to oxidize glutathione (GSSG) and thus neutralize directly ROS. GSH can also be a cofactor of glutathione-dependent enzymes (Regoli and Giuliani, 2014). Another process that can be promoted by ROS, is the protein carbonylation (PC) were, similar to LPO, proteins are oxidized (Suzuki et al., 2010). However, the first mechanism acting at the enzymatic defense level, and to be used as a biomarker, is the superoxide dismutase (SOD), catalyzing the dismutation of superoxide (O2̅) in oxygen and hydrogen peroxide (McCord and
Fridovich, 1969). However, the formed hydrogen peroxide is also a harmful sub-product which is needed to be eliminated and degraded from the organism. Thus, a second enzymatic mechanism, catalase (CAT), is activated to avoid more damage in the cells and tissues. This last mechanism is involved in the conversion of hydrogen peroxide in water (Aebi, 1984).
21
2.5.1. Physiological parameters
2.5.1.1. Respiration Rate
Paragraph should be change to: “After 14 days of exposure, respiration rate (RR) was measured in six mussels per condition (two per aquarium/replicate). Measurements were performed by simple static respirometry, using two organisms of the same aquarium per respirometric chamber. Each of these chambers, which were equipped with an oxygen sensor spot glued to its inner wall using silicon paste, was filled with the same seawater used during the experimental period. Organisms were placed in these chambers under dark and fully-oxygenated concentrations where they were allowed to acclimate for 30 min to avoid the influence of manipulation on RR. After this period, chambers were filled to their maximum capacity (1L) to avoid the formation of air bubbles and were then air-tight sealed. Measurements started in fully oxygenated medium and RR was recorded as a function of declining O2 concentration (mg/L) over time every 15 min during 2h, with a multi-channel fiber
optic oxygen meter (Multi channel oxygen meter, PreSens GmbH, Regensburg, Germany) for simultaneous read-outs. Data were recorded using the software PreSens Measurement Studio 2. Twenty-two measurements were carried out at a time (including a blank, i.e. chamber containing no organisms to account for background respiration). Organisms were posteriorly dried and weighed. Respiration rate was expressed in mg O2 consumed per h per g dry weight
(DW).”
2.5.1.2. Condition Index
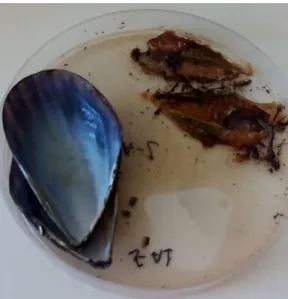
The CI was calculated considering that this parameter can give an indication of the general physiological status of the animals. After the 14 days of the experimental period, the soft tissues of six frozen organisms per condition, previously used for RR determination, were carefully separated from the shells. Both shells and tissues were put in an oven at 60 ºC for 48 h (Figure 2.4.). After this period, the dry soft tissues and shells were weighed and CI calculated. Following Matozzo et al. (2012), CI values were expressed as the ratio between the DW of softs tissues and the DW of shell x 100. The dry tissue was stored and used for lipid quantification.
22
Figure 2.4. Mussels’ dry shells and tissue after being carefully separated and put in an oven.
2.5.2. Biochemical parameters
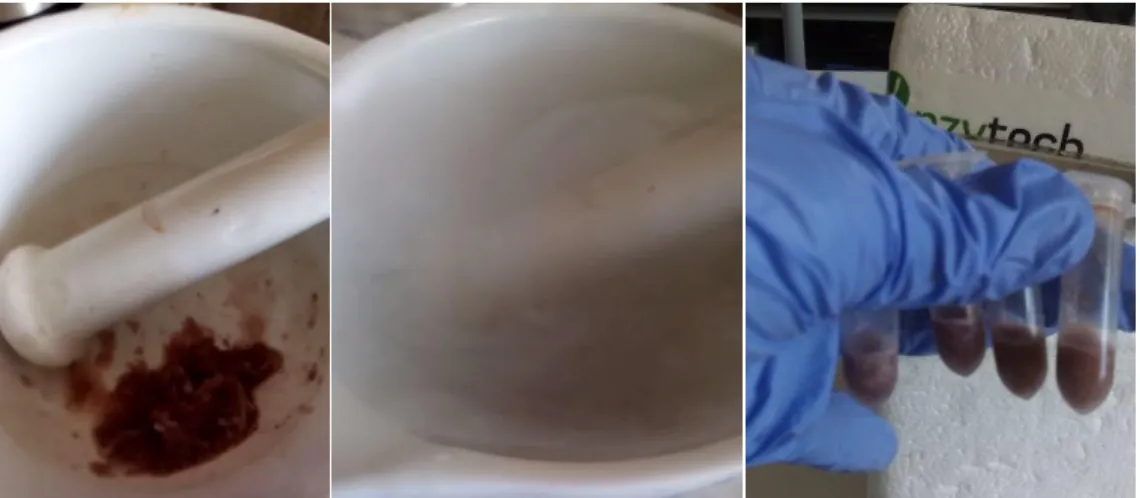
After the 14 days of the experimental period, the soft tissue of six frozen organisms per condition (used previously for the CI and RR) were carefully separated from the shells to determinate mussels’ LIP content. Both shells and tissues were dried in an oven at 50ºC for 48h. After this period, dry tissue was homogenized with a mortar and a pestle, divided in 0.5 g aliquots and stored for further LIP quantification (Figure 2.5.).
23
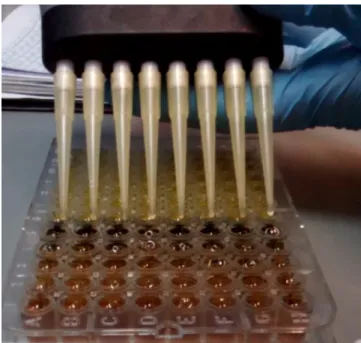
For all other parameters except LIP, shells of the frozen organisms (four per aquarium/replicate, twelve per condition) were removed and the frozen whole soft tissue was homogenized using a mortar and pestle with liquid nitrogen. The homogenized tissue of each organism was distributed in 0.5 g aliquots (Figure 2.6.).
Figure 2.6. Homogenization process of mussels’ frozen tissue with liquid nitrogen.
For each biochemical parameter, a specific buffer was used in the extraction of the supernatant using a proportion of 1:2 (w/v). Firstly, the tissue sample were homogenized using a TissueLyser II (Qiagen) during 1 min, after which they were centrifuged 20 min at 10,000 g or 3,000 g depending on the biomarker at 4 ºC. Supernatants were stored at -80ºC or immediately used to determine: ETS activity; GLY content; LIP content; LPO levels; GSSG content; PC levels; and activity of antioxidant enzymes (SOD, CAT, GPx). Two replicates per sample were used for the determination of each biochemical parameter.
2.5.2.1. Metabolic capacity
The ETS activity was measured based on the method of King and Packard (1975) and modifications by Coen and Janssen (1997). The supernatant extraction was done with 0.1 M Tris-HCL pH 8.5, 15%(w/v) PVP, 153 mM magnesium sulfate (MhSO4) and 0.2%(v/v) Triton X-100. 35.7 µL of supernatant was incubated on a microplate with 107 µL of buffered substrate
24
solution (0.13 M Tris-HCl, 0.3% (v/v) Triton X-100, pH 8.5) and 35.7 µL of NAD(P)H (1.7 mM NADH and 250 µM NADPH). The reaction started after 71.4 µL of 8 mM p-IodoNitroTetrazolium were added. Absorbance measurement was performed during 10 min at 490 nm with intervals of 25 s and the extinction coefficient of 15.900 M-1cm-1 was used to calculate the amount of
formazan formed. Results were expressed in nmol min per g fresh weight (FW).
2.5.2.2. Energy reserves
The GLY content was measured according to the sulfuric acid method (Dubois et al, 1956), using glucose standards. The supernatants were extracted with sodium phosphate buffer, pH 7.0 (50 mM sodium dihydrogen phosphate monohydrate, 50 mM, disodium hydrogen phosphate dehydrate, 1 mM ethylenediamine tetraacetic acid disodium salt dihydrate (EDTA); 1% (v/v) Triton X-100; 1% (v/v) polyvinvlpyrrolidone (PVP); 1 nM dithiothreitol (DDT)). For the GLY determination, 10 µL of the each sample was used. To every sample, 100 µL of phenol (5%) and 600 µL of sulfuric acid (H2SO4, 96%) were added. The standard curved was
generated with GLY standards (0 mg to 5 mg/L). Absorbance measurement was executed at 492 nm after samples being incubated for 30 min at room temperature. The results were expressed in mg per g of FW.
The LIP content was determined following the methods developed by Folch et al. (1957) and Cheng et al. (2011). To each 10-15 mg sample of dry tissue, 5 mL of a mixture of methanol/chloroform (2 chloroform:1 methanol) was added and vortexed. The samples were then centrifuged for 10 min at 3500 rpm and 10 ºC and a standard curve was determined using cholesterol standards (0–100%). Tubes with 1 mL of each sample were left at 50 ºC until the next day. 1 mL of sulfuric acid (95%) was then added to each tube, agitated and left for 10 min at 100 ºC, being vortexed after this procedure. 5 mL of vanillin solution were mixed with 200 µL of each sample. After 1 h of color development in the dark at the room temperature, the absorbance was measured at 520 nm. Results were expressed in percentage per mg DW.