A Work Project, presented as part of the requirements for the Award of a Master Degree in Finance from the NOVA – School of Business and Economics.
The effects of the new accounting standard for leases on firms: A practical case of
TAP’s Financial Statement Reformulation for IFRS 16.
Duarte Nuno Amiguinho Gouveia 3936 (ID:24002)
A Project carried out on the Master in Finance Program, under the supervision of: Filipa Castro
2
Abstract
IASB published the new IFRS 16 which succeeds IAS 17 on 1st January 2019. The standard requires the recognition of the operating leases in the firms’ balance sheet, aiming to increase the comparability and transparency of the financial statements. Therefore, the created impacts at organizational and accounting level were investigated as well as repercussions on the stakeholders’ perception.
The purpose of this study is to present, based on TAP’s Financial Statement Reformulation, the main requirements to be in compliance with the standard and the effects on financial ratios, and to corroborate the material effects on the airline industry.
Keywords: IFRS 16 “Leases”, Lessee, Financial Statements, Financial Ratios
I would like to thank to Professor Filipa Castro, my advisor from NOVA, for the guidance and
willingness to help me during the making of this academic paper. As well as to Luís Pedro
3
Table of Contents
Literature Review ... 4
Impacts on the Financial Statements ... 4
Impacts on the Financial Ratios ... 6
Impacts on the Investors ... 8
Credit Agencies and Borrowing Costs ... 9
Debt Covenants ... 10
The Accounting Standards and Introducing IFRS 16 ... 10
Accounting Adjustments ... 16
Practical Case: Reformulation of TAP’s Financial Statements adjusted for IFRS 16 18 Introduction ... 18
Methodology ... 19
Empirical Analysis ... 21
Balance Sheet ... 21
Statement of Cash Flows ... 22
Financial Ratios Analysis ... 22
Sensitivity Analysis ... 24
Conclusion ... 25
Attachments ... 26
Attachment 1 - EY Methodology for IFRS 16 ... 26
Attachment 2 – Depreciation of Assets and Amortization of Liabilities ... 28
Attachment 3 – Lease Expense over the Lease Period under IAS 17 and IFRS 16 ... 29
Attachment 4 – TAP’s Consolidated Statement of Financial Position ... 30
Attachment 5 – TAP’s Consolidated Income Statement ... 31
Attachment 6 – TAP’s Statement of Comprehensive Income ... 32
Attachment 7 – TAP’s Consolidated Statement of Changes in Equity ... 33
Attachment 8 – TAP’s Consolidated Statement of Cash Flows ... 34
Attachment 9 – Basis for TAP Financial Leases’ Depreciation: ... 35
Attachment 10 – Internal Rate of Return on Delta Air Lines’ Capital Leases ... 36
Attachment 11 – Reclassification of 2017 TAP’s Financial Statements ... 37
Attachment 12 – Sensitivity Analysis: Components of the Financial Statement ... 38
4
Literature Review
Over decades, lease capitalization has been a subject of interest for academics who investigated and developed opinions about the obtained leases by firms as well as assessed the impacts on their financial statements.
It is crucial to understand the diversity of the findings about the impact on Financial Statements, the impact on Financial Ratios and the stakeholders’ standpoint.
Impacts on the Financial Statements
According to Branswijck (2011), the most important measure of IFRS 16 is the elimination of the distinction between operating and financials leases in accounting terms. Since the standard was announced, it has been subject of matter. Barone, E., et al (2014) states that accountants are worried about the complexity of IFRS 16 and the implied costs to be implemented.
Over decades, the impacts of the operating lease capitalization on the financial
statements have been measured. Imhoff et al. (1991) were the earliest academics who created a constructive capitalization method which was used afterwards by other researchers, in order to treat the long-term operating leases to be accounted as asset and liability in the balance sheet, making possible the comparison between companies. They investigated 14 US Companies for 1987 in seven industries and have observed an increase in unrecorded lease assets and liabilities in 32,4% and 72,8%, respectively.
Similarly, the impact caused on the financial statements for a sample of 232 UK listed firms in 1994 were analyzed by Beattie et al. (1998). On average, the unrecorded liability was 39% of the recognized long-term debt and the unrecorded assets only 6% of the total booked assets.
5 Duke and Hsieh (2006), using the Imhoff’s Method (1991 and 1997) evaluated six US firms and calculated an average off-balance sheet liabilities of 89,5% of total unadjusted liabilities and a mean unregistered asset of 39,4% of total unadjusted assets.
Durocher (2008) found similar results to the literate above, studying the impacts for the 100 largest Canadian companies in revenue. It is concluded capitalizing operating leases lead to the recognition of important additional assets and liabilities on the balance sheet, adding the income statement is less affected.
Kilpatrick and Wilburn’s (2006) suggested, replicating the study of Imhoff et al. (1991) for nine companies, a higher increase on the total labilities compared to the total assets, due to the greater depreciation amount compared to the lease payments in the earlier stage of the lease term.
Despite the mentioned researchers used different sample dimensions and jurisdictions, and the obtained results have distinct magnitudes, the outcomes after operating leases
capitalization showed a growth trend for the liabilities and assets, and a decrease in equity value, being that the increase on assets is lower than on liabilities.
A research conducted by PwC on the expected impact of lease capitalization in 2016 evaluated the 2014 operating leases from financial statements of 3199 entities. Thus, the reported debt is expected to increase with a median of 22%. They also found that retail will be the most affected sector, as roundly 35% of retailers’ reported debt will increase more than 25%. Goodacre (2003) evaluated the significance of operating leases in the UK retail sector. They were the main source of financing in this sector, representing 3.3 times of the long-term debt and 28% of the recognized assets. Following this sector, the airline sector is expected to register the second highest impact (median increase in debt of 47% and 50% of entities with 25% of increase), as depends on massively on leased aircrafts. Öztürk and Serçemeli (2016)
6 studied the lease capitalization effects on a Turkish company, identifying an increase by 52,2% in the liabilities, 29,3% in the total assets, and a decrease of 12,5% in equity.
Therefore, researchers evidenced the industries are distinctively impacted by the capitalization of leases.
Impacts on the Financial Ratios
The financial ratios are extensively used in analyzing the financial statements by investors, analysists and loan officers (Branswijck et al., 2011). The investors and analysts use the financial ratios to evaluate the distinct aspects of financial performance and vitality of a company. The financial ratios are extremely valuable to grant the comparability between companies with different sizes and over different period.
Those indicators are divided in three dimensions: balance sheet/leverage and profitability, and the solvency. The leverage indicators that studied the balance sheet structure simultaneously (Gearing Ratio or Debt to Assets) assesse the firm’s capital structure. Regarding the profitability, those measure the ability of the company to generate earnings from its associated expenses, such as the Asset Turnover, Return on Assets (ROA), and Return on Equity (ROE). The solvency ratios (Interest Coverage Ratio) assesse the firm’s capital structure and the capacity to meet its financial obligations.
One of the first researches about the impact of lease capitalization on accounting ratios was proceeded by Nelson (1963). For a sample of 11 US companies, some measures were substantially affected, and in 56% of the cases the ranking firms changed. Later on, Ashton in 1985 analyzed a group of ratios for 23 UK companies, and evidenced that only the Gearing ones were materially affected.
Imhoff et al. (1991) detected under their capitalization method the Return on Assets may decrease by 9% and the Leverage Ratio increase in approximately 30%. In a study conducted by the same academics, using the same assumptions for a sample of 29 airlines and
7 51 grocery stores for fiscal years between 1984 to 1989, found an average increase in Debt to Assets ratio of 16,2% for airlines and 15,9% for the retail firms, which was corroborated by Durocher (2008) for Canadian firms. Similarly, K. Bennett, et. al. (2003), for 38 listed firms in the New Zealand Stock, concluded that there is a material impact on the recognized liabilities. On average, liabilities increased 22,9% and Liability/Assets ratio increased from 0,469 to 0,519. Moreover, the current ratio falls from 2,11 to 1,81 and ROA decreases from 12,6% to 11,5%. The decline on ROA is also supported by Duke et. al (2009).
In the study conducted by Beattie et al. (1998) for the UK listed companies evidenced a significant impact on financial ratios, corroborating the previews results, but also proved the decrease on asset turnover.
Branswijck et al., (2011) have studied the possible effects for companies that operate in Belgium and Holland, across different industries, on ROA, the leverage ratio and current ratio. They have concluded these three ratios were negatively affected by the capitalization of the operating leases, and presented distinct results by industry. Besides, the author found the impacts were more significant in Dutch companies than on Belgium ones, showing the impacts depends on the jurisdiction where firms are.
Fitó et al. (2013) has tested 52 listed companies using consolidated data for periods 2008-2010, and found significant impacts on the financial metrics, affecting the gearing ratios but also the performance of the company affecting ROA and ROE. The analysis was
discriminated by sectors, having been concluded that the retail services sector is the most impacted one.
Regarding the impact on ROE, there are contradictory findings. Wong and Johi (2015) found a decrease of 1,23% on this ratio. In spite of, Beattie et al (1998) and Fülbier et al. (2008) expected an increase for ROE, 4,8% and 0,9%, respectively.
8 The effects on Interest Cover Ratio will be not the same whatever the case. In the research conducted by Kargin, et al. (2017), who studied the impacts of operating
capitalization in a Turkish airline company, concluded that interest cover would decrease from 167% to 129%. Lee et al. (2014) also predicted the ratio deteriorates after the capitalization.
Therefore, prior literature evidenced the impacts created on the firms’ financial statements result in changes on financial metrics, particularly for ones which intensively used operating leases before the standard application. Academics stated the ROA and Asset
Turnover decreases, as well as the Leverage Ratio and Debt to Assets increases. The interest cover generally decreases and the Return on Equity trend depends on the fluctuation on Net profit compared to Equity.
The resulting changes on the financial ratios not only impact the way that investors perceive the firms’ financial position. The mentioned effects could negatively affect the loans’ commitments and the credit concession.
Impacts on the Investors
Over the years, there has been studies realizing whether the stakeholders adjust to the reality of the firms, and not be biased by the manner upon on the financial statements are created.
Dyckman (1964) stated that the investors are influenced by the way the firms divulge the financial statements, rather than on being concerned on the business itself. Moreover, Maines in 1995 reinforce these statement stating the distinct accounting policies for same context can be differently judged.
Along with this idea, the research conducted by Hirshleifer and Teoh (2003),
9 al. (2016) stressed the difficulty among the investors to make the adjustments given the
absence of the information.
According to Libby et al (2002), investors reject to adjust the information provided by firms although they know the firms adopting some accountant policies create an unreal perception.
Credit Agencies and Borrowing Costs
The credit agencies provide independent ratings that reflect the financial position of the company, being valued by investors and creditors. They improve the pricing and support the raise of capital on industries.
Prior literature evidences Credit Agencies are sophisticated market participants and consider the off-balance leasing when evaluate firms’ credit risk (Lim, et al., 2003; Sengupta & Wang, 2011). Indeed, Standard & Poor’s and Moody’s Corporate Ratings Criteria
incorporate the operating lease when compute the probability of default.
Altamuro, et al. (2014) studied 5812 bank loans of companies and defended the sophisticated users adjust to the operating leases. According the academics, rating agencies and banks adjust for the off-balance operating leases. For companies which have attributed a S&P Rating, lenders use these grade to be adjusted. In case there is no rating available, the adjusted financial ratios have explanatory power of spreads. According IASB, the lenders set interest rates in function of credit rating agencies, which belief that leasing it is a source of financing, representing an obligation of future outflow from the company. This body considers that any effect on borrowing costs results from the improvement of transparency and the availability of more accurate information about the risk price and lease liabilities amount for the lenders.
10
Debt Covenants
FRS 16 will create impacts on the financial ratios, which are linked to the debt covenants, forcing some companies to restructure the metrics after violate them. The debt covenants on existing leasing contracts, without prior adjustment for off balance sheet leases can be no longer complied after the operating leases capitalization. Lee, et al. (2014) studied this topic for US businesses. They stated the firms cross the initial threshold of covenants as the financial ratios were negatively affected.
Grossman and Grossman (2010) defended that the violation of debt covenants may cause difficulties for credit financing for firms.
However, Paik, et al., 2015 stated the lender already incorporate the capitalization of leases on debt covenants in the lease agreements.
In most of the cases, the new standard will not have a dramatic effect on existing debt covenants, as this issue can be reverted. According a study conducted by Moody’s in 2011 on a sample of corporate credit agreements, the change on the standard was mitigated by a clause in credit agreement that allows calculate the covenants based on the accounting requirements at the initiation of the contract (“freezing” GAAP approach). Alternatively, based on a survey in 2015 conducted by the European Financial Reporting Advisory Group, most lenders respondents stated that there will be the opportunity to renegotiate the debt covenants including the standard changes. The agreement may result in the fairest deal for each other, preserving the original intent of the covenants. IASB expects the company’s economic position will be not affected by the accounting changes.
The Accounting Standards and Introducing IFRS 16
The accounting standards can be defined by a set of rules, guidelines and policies based on which companies prepare their financial statements. They establish how the transactions and company’s rights and obligations should be measured, recognized and
11 disclosed. Listed companies and financial institutions are compulsory to prepare their
financial statements based on accepted accounting standards.
Standards have the purpose to contribute to the transparency and reliability of the information provided by companies. The uniformity makes information more comparable which in return promotes confidence and empowerment of investors. This creates a far more favorable environment for firms to raise capital.
Furthermore, for audit professionals, accounting standards performs an important role as the standardization of financial statements helps to identify material misstatements caused by deviations from criteria and mitigate fraud events.
The International Financial Reporting Standards (IFRS) are one of the rules globally implemented, being accepted in more than 140 jurisdictions. They represent an enormous relevance in the preparation of some financial standards, being investors highly interested in understanding their framework. It is principles-based and therefore leaves some discretion to management. The International Accounting Standards Board (IASB) issues the IFRS and it sets the standards through a transparent, participant and inclusive process. So far, there had been issued 17 IFRSs and 41 IASs. Each standard is a norm used by firms to properly report their financial information.
Once IFRS a global and complex standard, they fulfill the need of industries, business or jurisdictions across the world. Despite the implementation process to be extensive and in need of consultation, debates and public feedback to consider this procedure, it is also veridic that not always the standard is suitable to be implemented or there are unexpected conditions that make them enforceable. Once implemented the IASB must observe the adequacy of the standards, and, if needed, issue some amendments for certain parts, or even create a new
12 standard to replace the existing one, establishing new principles to report or account the financial information.
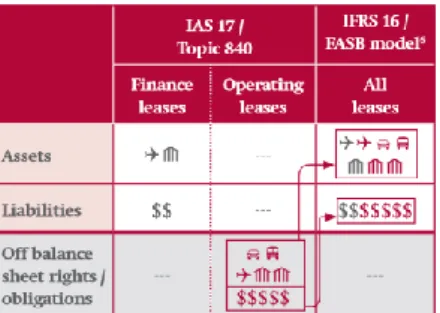
There was the need to implement the new IFRS 16 that was issued in January 2016 and is effective for accounting periods that start on or after the 1st of January 2019, being possible the premature adoption of the standard. This new standard requires the lessees to recognize their leases agreements in the balance sheet, replacing the IAS 17 interpretation, which distinguished them into financial and operating leases.
Under IAS 17, financial leases were commonly defined as long term agreements, in which all the risks and benefits related to the ownership are transferred to the lessee, and there is a purchase option of the asset. Oppositely, all the others were considered as operating leases (rents), being that the ownership and the risk of obsolesce still belongs to the owner of the asset. They are uniquely accounted in the Income Statement, in the form of operating expense which represented the lease payment. Additionally, the lessees are also required to disclose the minimum lease payments by maturity and a general description of significant lease arrangement.
The mentioned distinction was the trigger of the creation of IFRS 16, as there were off-balance sheet leases that made the investment decision somewhat difficult. Some operating leases were not cancelable and represented a liability, although they were hidden from the markets. For Frecka (2008) the fact that companies hide their leases could represent an unethical issue. Thus, the new IFRS 16 improves the transparency and comparability regarding the leverage. Under IAS 17, only sophisticated investors could evaluate the factual financial position of a company (Donkersy, 2016).
The portfolio of leases is now accurately identified by the investors and the real liability amount is effortlessly assessed. According to Ilkka Kestia, from Nordea Market Risk
13 Advisory, “(…) some companies have taken advantage of operating leases to evade
investment budgets.” “For external observers, it will be easier to see what kind of business the firm has, and how it is financed.”
The definition of lease changed with the introduction of IFRS 16. To be classified as lease, an underlying asset and benefits from its use may be identified. So, it does not matter who takes risks and rewards on the lease. The main focus is on who takes the right to use the identified asset. Differentiate lease and non-lease components is necessary. Sometimes leases pay installments in exchange of the use of an asset as well as a service associated (i.e.
maintenance). For IAS 17, these could be fully accounted in the Income Statement. Under IFRS 16, to be included in the Balance Sheet it should satisfy the mentioned requirements, which requires a careful analysis from firms.
Regarding the measurement of the leases, the ones considered as financial are
registered in the same way as before. Oppositely, operating leases that before were accounted as operating expenses in the Income Statement, are now included in the Balance Sheet as well. Both leases are disclosed now under the same method.
Despite the accounting and financial effects that will be explained on the following chapters and are needed to be estimated, the new IFRS 16 also produces impacts at the
organizational level. It is not just an accounting transition. Therefore, the standard is expected to produce implementation costs of different natures to companies.
The companies should beforehand prepare the transition, understand the necessary changes in the organization and anticipate the magnitude of the impacts. A cross-functional team and an effective project management may be created to guarantee the compliance. The standard adoption requires a wholly engagement of all the departments, being necessary a transversal training around the new standard.
14 The existing lease contracts need to be identified as well as the data associated
gathered to guarantee the completeness and accuracy of the lease portfolio, useful to compute the effects on financial statements. However, a lot of information needs to be gather and the contracts are usually unstructured. The current contracts may not be all reunited as well as the terms and conditions needed to make computations and to guarantee the compliance to the new standard.
Furthermore, once it becomes necessary distinguish the lease and the non-lease components, the company is required to update their processes to collect the adequate information.
This standard requires judgmental decision either to evaluate when a contract meets the new definition of lease or to correctly identify the capitalization exceptions (short-term lease and low-value assets). This being said, becomes crucial to update the accounting policies and procedures to guarantee the compliance as well as supply to the collaborators training around the IFRS 16 and its’ areas of judgement.
The IT Systems and procedures may be also affected by the standard. Despite the IFRS 16 requires lot of judgmental decisions, the automated systems should fulfill the needs of lease capitalization subject to the new standard. The requirements in the disclosure should be contemplated either to update or replace the existing IT Systems. This should be
continuously considered along the current efforts of IT financial reporting project to avoid additional cost related the integration of the IFRS 16. Moreover, companies that decide to be early adopters have the possibility to adopt a full retrospective approach, which imply them prepare supplementary comparative information for the year before the effective date, restating this data. Thus, IT Systems may be prepared to automatically compute the parallel lease data.
15 Lastly, there are management decisions associated to the leases that should be
reassessed. The present value of lease payment over the lease term and the lease definition have changed. Thus, during the negotiations of the leases, lessee should consider their current needs, trying to exploit the existence of variable components and short-term contracts.
Moreover, given the impact on financial statements, lessees should also consider the costs from buy the asset against lease it.
Indeed, the adoption will require effort, time and money from firms. There is a novel issue which all departments should manage. Then, the migration for IFRS can be supported by an external entity which provide advisory at organizational level and, technical knowledge to assure the compliance. The services are carefully designed to individual clients and are addressed to specific organizational, regulatory and financial threats they face. In the
Attachment 1, there is presented the Methodology developed by Ernst & Young, the company where I have been working during the elaboration of this academic paper, to advise its’ clients (see Attachment 1 for further information).
The complexity of the implementation process, and consequently, the impacts caused are not homogeneous across adopters. Given the complexity of the process, lessees are able to adopt either a full or modified retrospective approach. On the one hand, the Full Retrospective Method requires companies to restate the financial statements at the earliest comparative period, as the standard had been adopted as the beginning of the contract. The components of the firm’s financials are computed as the commencement date, at the historical interest rate. Therefore, the lessee disclosures financial information for 2018 in compliance with IAS 17, and also prepare comparative information which are restated according the new standard, to be included in 2019’s IFRS Financial Statements. Although the method increases the reporting quality and accuracy, it is implied more effort to collect all historical data.
16 On the other hand, the Modified Retrospective Approach implies that IFRS 16 starts to be applied from 2019 and there is no need to produce comparative information. Under this approach, leases have two options: 1) recalculate at 01/01/2019 the present value of lease liability discounted at the incremental borrowing rate 1, and assuming the same value for the right of use assets; 2) compute at the beginning of 2019 the liability, but also adjust the right of use asset as if the standard had been applied since the commencement, both discounted by the previously mentioned rate. The following interest and depreciation expenses are computed over the remaining lease period. This approach does not produce such accurate financial statements and the results are less intuitive to percept, but it is not so costly and effortless. The lessees should make a trade-off decision, considering the benefits from convey an accurate financial position to the stakeholders and the implementation costs associated on gather the historical data.
Accounting Adjustments
The new standard will produce significant effects, mainly for the lessees that have off-balance operating leases. IFRS 16, as mentioned before, eliminated the classification applied before as either operating or financial leases. Under IFRS 16, all the contracts that are considered as leases by definition are now also recognized
in the Balance Sheet. It is estimated that US$2,8 Trillion will become to be registered in the Balance Sheet.
The lessee, initially needs to be recognized the
liability – the present value of lease payments and expected payments at the end of the lease period – as well as the right of use asset (ROU) generally at the same value associated to the
1Incremental borrowing rate is “the rate of interest that a lessee would have to pay to borrow, over a similar term for an alike security, the
funds necessary to obtain an asset with the same value of right-of-use asset in the identical economic environment”.
17 off balance operating leases. Thus, the most significant effect for lessees will be the increase in assets and liabilities.
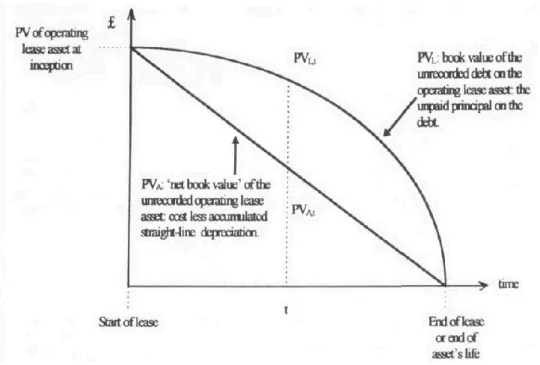
The amount of lease asset decreases faster than lease liability, despite the values are generally the same in the commencement. In each period, the liability initially registered decreases by the amount of lease payments made but increases by the reduction of interest expenses over the period, whereas the lease asset generally straight-line depreciated (see Attachment 2). Thus, over the lease period, the shareholder’s equity value is lower compared to
IAS 17 for off-balance lease companies. The effect on equity value depends on the financial leverage, the ratio between equity and liabilities, and the terms of leases.
Regarding the impact on the company’s Income Statement, the classification of expenses associated to the operating leases changes, and the financial leases are
equally accounted in the income statement as before. The leases measurement is now aligned. The straight-line operating leases cost under IAS 17 was a full amount paid, even for non-lease components such as cleaning services. Applying the IFRS 16, the lessee considers the depreciation individually and the interest expenses (finance costs). Therefore, the EBITDA and Operating Profit increases.
The depreciation is recognized according the IAS 16 Property, Plant and Equipment, being possible to apply distinctive methods. The depreciation period is the remaining useful life of the underlying asset. Generally, the depreciation method for each period applied is the straight-line method, being the value constant over the period. However, the interest payments become lower over the life of the lease, decreasing the total expense as an individual lease matures. For an individual lease, the sum of depreciation and interest costs start to be higher than the cost registered under IAS 17, decreasing over the remaining lease period (see
18 Attachment 3). The discrepancy between two standards is influenced by the length of the lease
and interest rate applied. In summary, despite the Net Income be distinct for each single period, it is not impacted after the IFRS 16 adoption, as the whole costs associated to the lease remains the same.
In a single period, for a leases’ portfolio the effect produced on the income statement depends on the terms, length and distribution of the leases that constitute the portfolio. An evenly- distributed portfolio2, the impact is expected to be neutral, as there is no difference between the depreciation and interest expenses compared to the fixed cost applying IAS 17. However, for non-evenly distributed portfolio, the Income Statement is affected, as there are leases not equally dispersed over the lease period.
Regarding the lessee’s cash flows statements, the operating cash flows increases by the principal value, the cash from financing activities decrease at the same proportion, compared to the ones registered before. The total cash flow is remains unchanged.
The lessor’s financial statements are not significantly impacted by the new standard as IASB decided to carry forward the application of IAS 17.
Practical Case: Reformulation of TAP’s Financial Statements adjusted for IFRS 16 Introduction
As previously explained, the capitalization of operating leases under IFRS 16 will create impacts on the financial statements, requiring adjustments at the organizational level. In the subsequent subchapters, for a company that have not early adopted the standard selected, the resulting changes were predicted. The purpose of the following research is to corroborate the theoretical effects of the standards, noticing whether they actually significantly materialize.
19 𝐏𝐕𝐀= Present Value of Unrecorded asset;
𝐏𝐕𝐋= Present Value of Unrecorded liability; 𝐑𝐋 = Remaining Lease Life;
𝐓𝐋 = Total Lease Life;
𝐏𝐕𝐀𝐅𝐓𝐋 = Present Value Annuity Factor of Total Lease Life; 𝐏𝐕𝐀𝐅𝐑𝐋= Present Value Annuity Factor of Remaining Lease Life.
Moreover, I will demonstrate, in a simplified exercise, some challenges that they will face and the requirements to comply with standard.
I selected as company to be analyzed the TAP, since I pretended to confirm the prior literature that airline industry, will be significantly impacted and the effects at my jurisdiction. The material impacts results from the high number of aircraft as operating leases. According to Airfinance Journals’ Fleet Tracker, almost $325 billion of aircraft assets will become included in airline balance sheets. Indeed, the airline industry is high related with this standard as the former chairman of IASB, David Tweedie, have confessed his long-life ambition was to fly on an aircraft which existed on an airline’s balance sheet.
Methodology
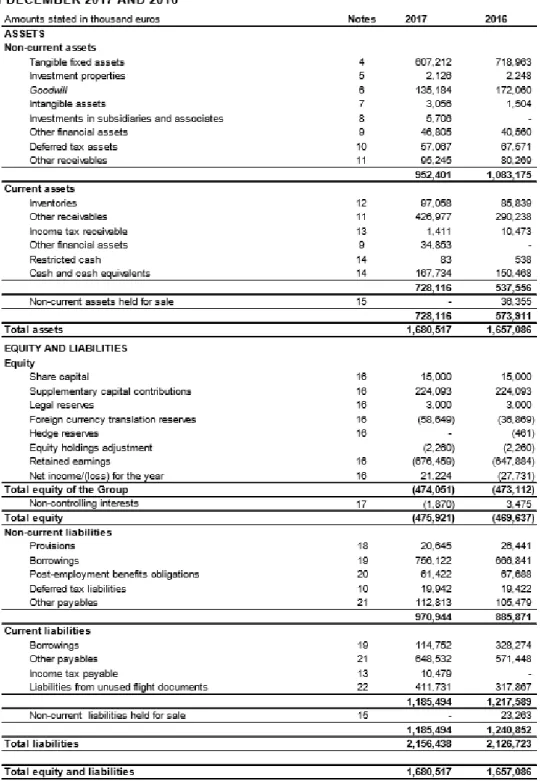
By adopting a Modified Retrospective Approach, TAP will not need to produce comparative information for the preview fiscal year. The Financial Statements as of 2017 will be used for the study (see Attachments 4 to 8).
TAP disclosures the amount of operating lease’s expenses and the resulting liability in 31 December 2017. However, as each operating lease agreement is not available, there are not accurately identified the operating lease’s expenses which are merely associated to lease component and, consequently, the liability in the beginning of the year. Therefore, to compute the asset amount at the end of 2017, I did not assume that the operating lease liability is the same than asset value in the beginning of the year. Alternatively, the estimation of the unrecorded asset developed by Imhoff et al. (1991) at 31 December 2017 was used. The asset was computed as if the standard had been applied from the commencement date, which is one of the permissible options to adopt the standard. The constructive capitalization method implies the following formula:
(1) 𝑷𝑽𝑨 𝑷𝑽𝑳
=
𝑹𝑳 𝑻𝑳×
𝑷𝑽𝑨𝑭𝑻𝑳 𝑷𝑽𝑨𝑭𝑹𝑳 , where20 The following accounting reformulation is a simplified approach. The results are naturally limited by the lack of data and various supported assumptions which are elaborated as solution. Even when the contracts are available, the dimension and complexity of data could be an impediment to get an accurate interpretation.
Under the new accounting standard, a new definition of lease was established. It is assumed the existing contracts only contains lease components subject to be capitalized.
Concerning the depreciation expense and remaining life of the underlying assets, it is unknown in which stage of the useful life the underlying assets are, as under IAS 17 the cost has not been presented. It was assumed that the assets still have half of their useful life – 10 years (see Attachment 9) This assumption is coherent with prior studies that also assumed a ratio remaining life to total life of 50% (K. Bennet et. al., 2003; Fülbier, et. al., 2008).
Regarding the interests paid, the cost of operating leases may be similar to the financial ones. Despite the company states the interests of financial leases are included as financial costs of the period, they were not differentiated. Alternatively, the cost of debt was used as proxy to compute the operating leases interests. This interest rate was used on the proxy for liability in the beginning of the year and it is similar to the one used by Delta Air Lines (Attachment 10).
Under IFRS 16, the operating leases contracts up to 1 year are exempt to be capitalized. This being said, the liabilities with less than 1 year were not included in the Balance Sheet and the paid costs in 2017 related to short-term operating lease contracts are still considered as operating ones. The proportion of liabilities up to 1 year in 2016 were computed and used to reach the respective operating costs.
Finally, a scenario analysis was performed to evaluate how the financial ratios may be affected for different values of depreciation and interest expenses.
21
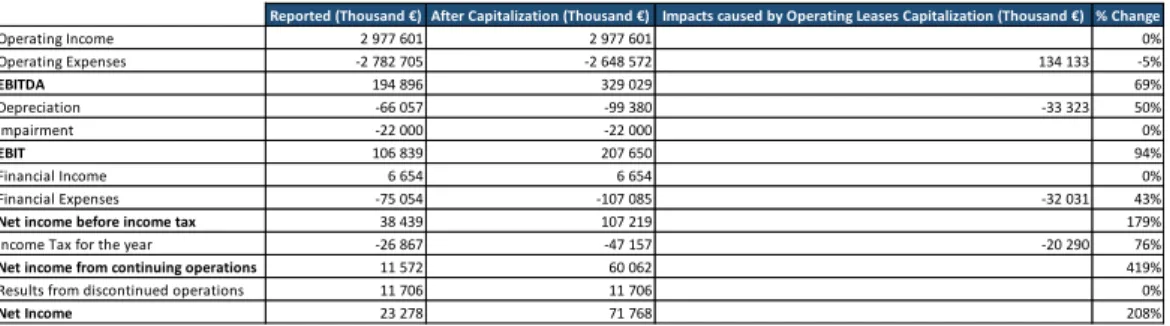
Table 4: TAP’s Income Statement under IAS 17 and IFRS 16 Table 3: TAP’s Balance Sheet under IAS 17 and IFRS 16 Empirical Analysis
Balance Sheet
In the table 3 (see Attachment 11 for further comprehension) are presented the results that illustrate the operating lease capitalization create a significant impact on assets, liabilities, and equity. After adjustments to be in compliance to IFRS 16, there is an increase of 333.225 thousand euros in asset value (+20%) and an increase of 405.877 thousand euros in the total liabilities (19%). Therefore, the equity value becomes even more negative, decreasing to -548.573 thousand euros (-13%). This findings are in line with the mentioned prior literature, as the capitalization of operating leases assets weights the historical depreciation which tends to be higher than the amortization.
Profit and Loss
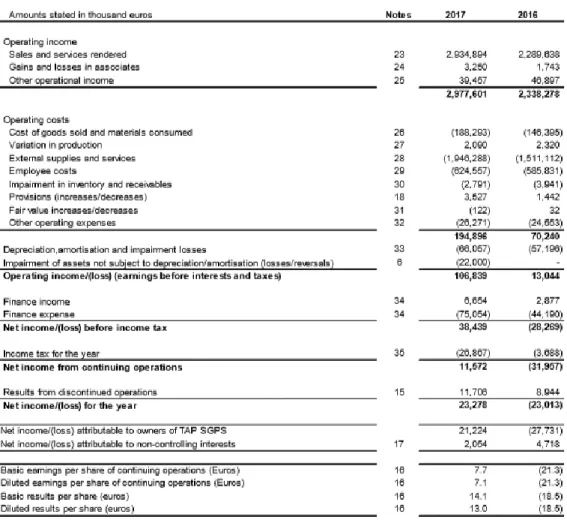
The operating lease expenses are no longer registered, being allocated between an interest charge and the asset’s depreciation expense. Therefore, the operating expenses decreases 134.133 thousand euros (-5%), increasing the EBITDA by 69%.
The depreciation of those underlying assets are registered, under previews assumption, enlarged the total amount by 50%, to 99.380 thousand euros. The value of depreciation is in this period lower than the amortization measured by the operating lease costs, which may result from the fact the remaining lease life be different than the one assumed or the overestimation of amortization which was considered in its entirely as lease component.
Reported (Thousand €) After Capitalization (Thousand €) Impacts caused by Operating Leases Capitalization (Thousand €) % Change
Total Assets 1 680 517 2 013 742 333 225 20%
Total Liabilities 2 156 438 2 562 315 405 877 19%
Total Equity -475 921 -548 573 -72 652 -13%
Reported (Thousand €) After Capitalization (Thousand €) Impacts caused by Operating Leases Capitalization (Thousand €) % Change
Operating Income 2 977 601 2 977 601 0% Operating Expenses -2 782 705 -2 648 572 134 133 -5% EBITDA 194 896 329 029 69% Depreciation -66 057 -99 380 -33 323 50% Impairment -22 000 -22 000 0% EBIT 106 839 207 650 94% Financial Income 6 654 6 654 0% Financial Expenses -75 054 -107 085 -32 031 43%
Net income before income tax 38 439 107 219 179%
Income Tax for the year -26 867 -47 157 -20 290 76%
Net income from continuing operations 11 572 60 062 419%
Results from discontinued operations 11 706 11 706 0%
22
Table 6: TAP’s Financial Ratios under IAS 17 and IFRS 16 Table 5: TAP’s Statement of Cash Flows under IAS 17 and IFRS 16
Furthermore EBIT rises by almost to the double than the reported value, as the change on derecognized operating costs is higher than on depreciation. Moreover, the interests paid on liabilities increase the financial expenses, in 31.207 thousand euros (+42%). Impacted by the changes of these three income statement components, the net income before income taxes exponentially increases from 38.439 to 108.042 thousand euros. It triggered an increase on the taxable amount, being that the income taxes increased 20.532 thousand euros, being
applicable a rate of 29,5%, as the TAP’s income is higher than 35 million euros.
Finally, under the assumptions, the net income rose from 23 to roughly 72 million euros (+211%). In this practical case, the IFRS 16 in the examined period created a positive impact on TAP’s profit, being positively perceived by the stakeholders (see Attachment 11).
Statement of Cash Flows
The Operating Cash Flow, as result of the unrecognition of principal under IFRS 16 and the increase of taxes paid, increases to 208.337 €m (+65%). The principal amount becomes recognized as financing activity. As consequence, the Financing Cash Flow decreases in 98%, instigated also by the rise of interests paid. Thus, Total Cash Flow decreases from 31.296 to -53.055€ m (Attachment 11).
Financial Ratios Analysis
Concerning the effects of operating leases capitalization, the ratios will be assessed by three dimensions: balance sheet/leverage and profitability, and interest coverage ratio. The table above evidences the material effects on financial ratios after capitalization.
Reported (Thousand €) After Capitalization (Thousand €) Impacts caused by Operating Leases Capitalization (Thousand €) % Change
Operating Cash Flow 126 524 208 337 81 813 65%
Financing Cash Flow -168 851 -335 015 -166 164 98%
Net Effect on Cash Flow 31 296 -53 055 -84 351 -270%
Ratios Definition No adjustments After IFRS 16 Adjustments % Variance
Leverage (Gearing) Liabilities/ Equity -4,53 -4,67 3%
Debt to Assets Debt/ Assets 0,52 0,63 22%
Asset Turnover Sales/Total assets 1,75 1,46 -17%
Interest Coverage EBITDA/Interest Expense 4,94 4,66 -6%
ROA Net Income/Assets 1,39% 3,59% 159%
23 The Gearing Ratio and Debt to Assets were used to evaluate the balance sheet
structure and simultaneously to measure the firms leverage position. The value of those financial ratios after the implementation of IFRS 16 suggests the indebtedness of the firm raised. The gearing ratio from -4,53 to -4,67 (-3%), as the liability amount have changed more than the equity value (which presented a negative signal), becoming even more negative. The return on investment with borrowed money is lower than the interests paid. The D/A ratio increased drastically from 0,52 to 0,63 (22%) since the financial debt increased more than the asset value, which implies that TAP become have more claims on the assets. A value higher than 0,5 is often interpreted as a highly leveraged firm. Thus, the mentioned indicators that are proxy for financial leverage may lead to higher potential financial distress and reduce the business flexibility given the conditions that they should fill under credit agreements.
The financing risk of the firm is slightly intensified by the deterioration of the
solvency metric interest coverage ratio, which decreased from 4,94 to 4,66, (-6%). This result suggests the firm have reduced the capacity to pay the interests on outstanding debt. However, as this indicator is higher than 1, it is not a tormenting issue by itself.
Regarding the TAP’s profitability after the IFRS 16’s adoption, the ROA measure the firm’s performance compared to the capital invested in assets, being internally used to track the asset-use. It registered a slightly increase from 1,39% to 3,59%, triggered by a higher percentage increase on net income compared to the observed for the assets amount. The increase of this metrics is not coincident with the prior literature which expects an increase of the ratio since the net income may be constant and assets value increase. However, this fact can be explained by the following factors: the amortization is assumed to be consider as lease component as whole; an unbalanced portfolio which is composed by different agreements in maturity can produce effects on net income in single periods.
24
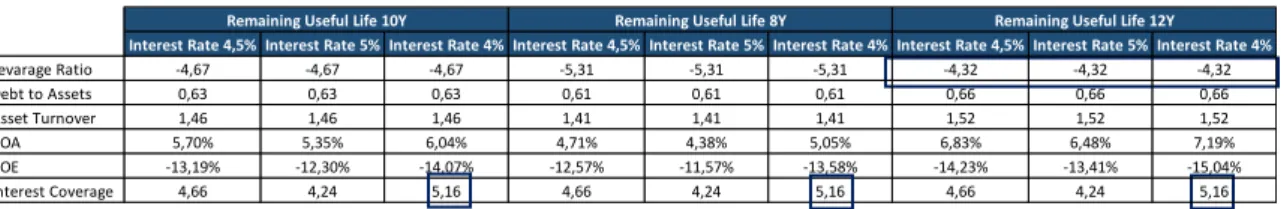
Table 7: Sensitivity Analysis for Depreciation and Interest Costs
The ROE that indicated how much profit the firm generates with shareholder’s equity presented a negative value, before the adjustments despite the net income be higher that equity variation, this ratio become even more negative, which should be necessarily interpreted as an unfavorable situation. Lastly, the Asset Turnover, as consequence of the increase of asset value and sales remain unchanged, is deteriorated from 1,75 to 1,45. Despite the indicator state that efficiency of use the asset decrease, the metric is still higher than 1.
Sensitivity Analysis
In Table 7 (see Attachment 12 for better comprehension) is presented the sensitivity analysis performed pretends evaluate how susceptible the financial ratios are for the
independent variables – depreciation rate and interest rate. The purpose is evaluate the
consistency of the conclusions for different value of those two variables, and how variable are the results. There were formulated 3 scenarios for the depreciation (remaining life of assets of 10 years, 8 and 12 years) and other 3 for interest cost (4,5%, 5%, and 4%).
Each scenario will produce different results on the financial statements components and, as consequence, on the financial ratios. Comparing the results obtained in the different scenarios with the financial metrics’ values without operating leases capitalization, the results are consistent in the most of the cases with prior literature.
However, the Leverage Ratio and Interest Coverage presented divergent values after the capitalization in 3 occurrences. For the first metric, these distinct results can be explained by the fact that a higher remaining life for the underlying asset reduces the asset value under the method, raising the amount for equity. The mentioned ratio become not so negative. The
Interest Rate 4,5% Interest Rate 5% Interest Rate 4% Interest Rate 4,5% Interest Rate 5% Interest Rate 4% Interest Rate 4,5% Interest Rate 5% Interest Rate 4%
Levarage Ratio -4,67 -4,67 -4,67 -5,31 -5,31 -5,31 -4,32 -4,32 -4,32 Debt to Assets 0,63 0,63 0,63 0,61 0,61 0,61 0,66 0,66 0,66 Asset Turnover 1,46 1,46 1,46 1,41 1,41 1,41 1,52 1,52 1,52 ROA 5,70% 5,35% 6,04% 4,71% 4,38% 5,05% 6,83% 6,48% 7,19% ROE -13,19% -12,30% -14,07% -12,57% -11,57% -13,58% -14,23% -13,41% -15,04% Interest Coverage 4,66 4,24 5,16 4,66 4,24 5,16 4,66 4,24 5,16
25 interest coverage creates a positive perception on the markets when the interest rates are minor, as the company has more capacity to the meet its financial commitments.
Conclusion
This research proposes to evaluate the impacts of the capitalization of operating leases on the financial statements of the Portuguese airline company TAP. Thus, it is possible to corroborate the previews studies which indicated the New Standard for Leases would produce material impacts on the airline industry, as well as the impacts on financial statements.
Moreover, it is shown the different requirements to comply with the standard.
I was able to conclude that the Assets, Liabilities and Equity Value were significantly impacted and that the first two components are discrepant. Regarding the effects on the Income statement, the Net Profit increases, as a result of the variation of Operating Expenses, Depreciation and Interests. These impacts of implementing the standard for a single period are aligned with the prior literature.
Moreover, the selected Financial Ratios were negatively impacted by the changes on the financial statements components. The metrics which are valuable to evaluate the financial position of a company, are expected to influence the stakeholders’ perception. This is
aggravated by the fact the company is not traded and the credit agencies do not classify this firm. As the credit rating is used as driver to evaluate the default probability by the lenders, lenders could not consider the operating leases, increasing the cost of borrowing. Once the financial metrics degraded, company became in a situation of non-compliance with the debt covenants, being forced to renegotiate and adjust with the creditors new pacts.
Given the significant estimated effects, TAP will be forced to adjust itself at an organizational level, updating IT systems, procedures, processes, and gather all the data contracts to guarantee the compliance and disclose accurate information to the stakeholders.
26
Attachments
Attachment 1 - EY Methodology for IFRS 16
Ernst & Young (EY) is a worldwide firm, considered as a Big 4, which provide assurance, consulting, tax, and corporate transactions services. The Financial Accounting Advisory Service (FAAS) is a sub-department from Assurance in EY, responsible for the counseling of leading organizations on accounting and reporting challenges. The companies are pressured to deliver higher quality reports to the shareholders, to fulfil the regulation which is constantly changing due to the transparency requirements from the reporting.
For the new leases standard, EY supports the clients on the preparation and adoption of the standard, implementing an effective and continuous plan on the firm to benefit from IFRS 16 and to reduce costly unforeseen events.
As mentioned in the chapter before, the new standard trigger new challenges and modifications on key business areas and processes of the firms. The request for services from external entities is mainly related to the need from firms to organize and collect the current leases contracts and restructure the departments and policies to fulfill the needs that have arisen. Once collected all the contracts, the firm is able to provide expertise and adjust the financial statements to be in compliance.
Workshops are provided to raise awareness of the IFRS 16 and to collect information to understand the nature of the leasing contracts in the company.
For the tough mission of collect and organize its’ lease data to be possible evaluate the impact on the financial statements, EY believes the technology is essential on making this process smoother. Thus, the EY Lease Reviewer is defined as a set of developed tools to fully capture, organize and better analyze the information. Similar information is able to be
27 those can improve the efficiency and accuracy in the treatment of large information on the contracts, being the manual review avoided.
Thus, EY is capable to separate lease and non-lease components or even estimate the economic life, and, therefore, calculate the impacts on financial statements and metrics. Using the EY Lease Accounting Navigator tool, the computations are automatically done and the assessment of financial impacts becomes possible.
EY also evaluates the current IT system implemented by the firm to manage the lease contracts, being identified which system is being used for contract management. Moreover, accounting manuals and policies selected by the firm could be updated in accordance to the requirements of the new standard. Finally, EY also provide inputs to advise the leases on the mentioned strategic business decisions, counseling whether they should continue to lease and helping the firm to modify the terms of the agreements.
Once implemented the changes and adjustments essential for a successful transition for the standard, the plan will produce expected impacts on the financial statements. In the following chapter, these impacts are discussed in detail.
28
Figure 1: Depreciation of Assets and Amortization of Liabilities
29
Attachment 3 – Lease Expense over the Lease Period under IAS 17 and IFRS 16
30
Table 8: TAP’s Consolidated Statement of Financial Position
31
Table 9: TAP’s Consolidated Income Statement
32
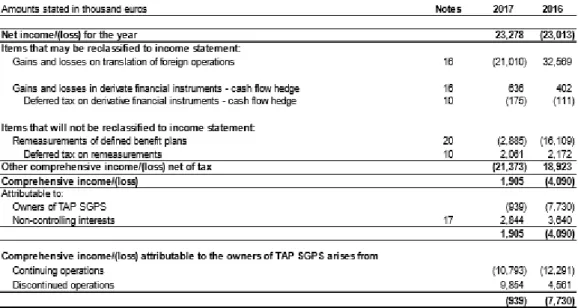
Table 10: TAP’s Statement of Comprehensive Income
33
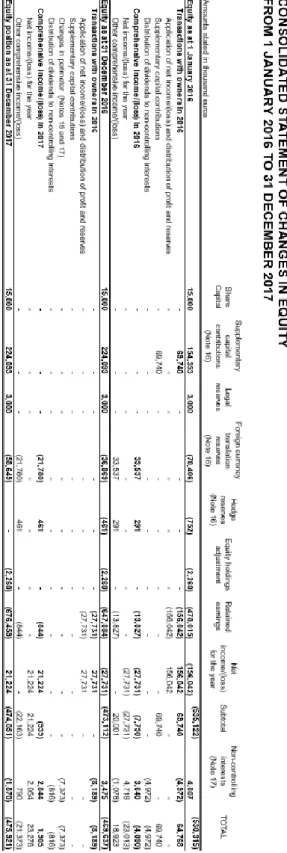
Table 11: TAP’s Consolidated Statement of Changes in Equity
34
Table 12: TAP’s Consolidated Statement of Cash Flow
35
Table 13: Basis for TAP’s Depreciation Expense
36
Table 14: Interest Rate used by a TAP’s Competitor (Delta Air Lines)
37
Table 15: TAP’s Financial Liabilities
Table 16: TAP’s Operating Leases Expenses
Table 17: TAP’s Cost of Debt
Table 18: Estimation of Operating Leases’ Assets for TAP
Table 19: Interests Paid for Operating Leases by TAP
Table 20: Depreciation Expenses for Operating Leases by TAP
Table 21: Effect on TAP’s Balance Sheet
Table 22: Effect on TAP’s Income Statement
Table 23: Effect on TAP’s Statement of Cash Flows
Attachment 11 – Reclassification of 2017 TAP’s Financial Statements
Operating Cash Flow Variation 81 813
Financing Cash Flow Variation -166 164
Net Effect on Total Cash Flow -84 351
38
Table 24: Components of the Financial Statements for different scenarios
39
References
Papers, dissertations, publications:
Altamuro, J. M., Johnston, R., Pandit, S., & Zhang, H. 2014. “Operating Leases and Credit Assessments.” Contemporary Accounting Research, 31(2): 551-580; doi: 10.1111/1911-3846.12033;
ARVAL. 2017. “IFRS 16 LEASES, THE IMPACT ON YOUR COMPANY.” Accessed December 2nd, 2018.
https://www.arval.ru/sites/ru/files/media/ifrs_16_the_impact_on_your_company_february_20 17.pdf;
Azih, G. 2018. “IFRS 16 Transition Overview and Two Full Examples for Lessees”.
Accessed November 19th, 2018. https://leasequery.com/blog/ifrs-16-transition-overview-and-examples-for-lessees/;
Barclays. 2018. “IFRS 16 and operating leasing.” Accessed November 19th,
2018.https://www.barclayscorporate.com/content/dam/corppublic/corporate/Documents/Lend ing/ifrs16-and-operating-lease.pdf;
Barnes, P., Prindle, R., Weaver, M., Cribben, N. 2017. “IFRS 16 Leases – What it Means for You” Accessed November 19th, 2018.
https://www.duffandphelps.com/insights/publications/valuation/ifrs-16-leases;
Barone, E., Birt, J., & Moya, S. 2014. “Lease Accounting: A Review of Recent Literature.” Accounting in Europe, 11(1): 35–54; doi: 10.1080/17449480.2014.903630
Beattie, V. Goodacre, A., & Thompson, S. 2000. “Operating leases and the assessment of lease-debt substitutability.” Journal of Banking & Finance, 24(3): 427-470. doi:
40 Bennett, B.K. & Bradbury, M.E. 2003. “Capital non-cancelable operating leases” Journal of International Financial Management and Accounting, 14(2): 101-114. doi:
10.1111/1467-646X.00091;
Branswijck, D., Longueville, S. & Everaert, P. 2011. “The Financial Impact of the Proposed Amendments to IAS 17: Evidence from Belgium and the Netherlands.” Accounting and Management Information Systems, 10(2): 275–294.
Chapman Tripp. 2018. “IFRS 16 Leases and you.” Accessed November 19th, 2018. https://www.chapmantripp.com/Publication%20PDFs/2018-PUB-Leases-September.pdf; CPA Canada. 2016. “Financial Reporting Alert – IFRS” Accessed September, 17th. https://www.cpacanada.ca/-/media/site/business-and-accounting-resources/docs/financial-
reporting-alert-ifrs-16-leases-april-2016.pdf?la=en&hash=D129862AF80D945F40CCCEF1B206145D1EF460B9; Daubeney, H. 2017. “The only constant is change” Accessed October 5th, 2018. https://pwc.blogs.com/ifrs/2017/07/the-only-constant-is-change.html;
Deloitte. 2016. “Leases: A guide to IFRS 16.” Accessed September 7th, 2018.
https://www2.deloitte.com/content/dam/Deloitte/sg/Documents/audit/sea-audit-IFRS-16-guide.pdf
Deloitte. 2017. “Balancing the books: IFRS 16 and Aviation Finance.” Accessed November 22nd, 2018.
https://www2.deloitte.com/content/dam/Deloitte/ie/Documents/FinancialServices/ie-Balancing-the-Books-IFRS-16-and-Aviation-Finance-Report_Dec2017-5.pdf;
41 Donkersley, K., Ravelli, R., & Buchanan, P. 2016. “IFRS 16 Leases”. Accessed October 23th, 2018.
http://www.ifrs.org/Alerts/ProjectUpdate/Documents/2016/Webinar-IFRS-16-Leases.pdf;
Duke, J. C., & Hseih, S. J. 2006. “Capturing the benefits of operating and synthetic leases.” The Journal Corporate Accounting & Finance, 18(1): 45-52. doi:
Duke, J.C., Hsieh, S., & Su, Y. 2009. “Operating and synthetic leases: Exploiting financial benefits in the post-Enron era.” Advances in Accounting, incorporating Advances in International Accounting, 25: 28-39. doi: 10.1016/j.adiac.2009.03.001;
Durocher, S. 2008. “Canadian evidence on the constructive capitalization of operating leases.” Accounting Perspectives, 7(3): 227-256. Doi: 10.1506/ap.7.3.2
EY. 2012. “IFRS Outlook”. Accessed October 5th, 2018.
https://www.ey.com/Publication/vwLUAssets/Outlook_May2012/%24File/Outlook%20May %202012.pdf;
EY. 2016. “IFRS Practical Matters – Leases make their way onto the balance sheet: Navigating the journey for a smooth landing.” Accessed October 28th, 2018.
https://www.ey.com/Publication/vwLUAssets/IFRS_Practical_Matters_-_Leases_make_their_way_onto_the_balance_sheet:_Navigating_the_journey_for_a_smooth_ landing/$File/PM-Leases-Feb2016.pdf;
EY. 2016. “Leases - A summary of IFRS 16 and its effects.” Accessed September 2nd, 2018. https://www.ey.com/Publication/vwLUAssets/ey-leases-a-summary-of-ifrs-16/$FILE/ey-leases-a-summary-of-ifrs-16.pdf
EY. 2017. “EY Lease Reviewer global proof of concept launches to support lease accounting changes.” Accessed October 28th, 2018.
https://www.ey.com/gl/en/newsroom/news-42
releases/news-ey-lease-reviewer-global-proof-of-concept-launches-to-support-lease-accounting-changes;
EY. 2018. “IFRS 16: Proposed changes to the analytical approach by rating agencies.” Accessed November 19th, 2018. https://www.ey.com/Publication/vwLUAssets/ey-ifrs-16-ratings-agencies/$FILE/EY-IFRS-16-ratings-agencies.pdf
EY. n.d. “Lease Accounting Supporty.” Accessed October 28th, 2018.
https://www.ey.com/gl/en/services/assurance/financial-accounting-advisory-services/ey-lease-accounting-support
Fitó, M.À., Moya, S., & Orgaz, N. 2013. “Considering the effects of operating lease capitalization on key financial ratios” Revista Española de Financiación y Contabilidad, 42(159): 341-369. doi: 10.1080/02102412.2013.10779750;
Frecka, T.J. 2008. “Ethical Issues in Financial Reporting Is Intentional Structuring of Lease Contracts to Avoid Capitalization Unethical?” Journal of Business Ethics, 80(1): 45-59; doi: 10.1007/s10551-007-9436-y
Fülbier, U.R., Silva, J.L., & Pferdehirt, H.M. 2008. “Impact of Lease Capitalization on Financial Ratios of Listed German Companies.” Schmalenbach Business Review, 60(2): 122-144; doi: 10.1007/BF03396762
Goodacre, A. 2003. “Operating lease finance in the UK retail sector.” International Review of Retail, Distribution and Consumer Research, 13(1): 99-125;
Grossman, A.M., & Grossman, S.D. 2010. “Capitalizing lease payments. Potential effects of the FASB/IASB Plan.” The CPA Journal, 80(5): 6-11; doi: 10.1080/17449480.2014.903630;
43 Hirshleifer, D., & Teoh, S.H. 2003. “Limited Attention, Information Disclosure, and Financial Reporting.” Journal of Accounting and Economics, 36: 337-386; doi:
10.1016/j.jacceco.2003.10.002
Hoogervorst, H. 2016. “Shining the Light on Leases”. Accessed September 13th, 2018. https://www.ifrs.org/news-and-events/2016/03/hans-hoogervorst-article-shining-the-light-on-leases/;
IFRS. n.d. “Why Global Accounting Standards.” Accessed October 5th, 2018. https://www.ifrs.org/use-around-the-world/why-global-accounting-standards/;
Imhoff, E.A., Lipe, R.C., & Wright, D.W. 1991. “Operating leases: Impact of constructive capitalization.” Accounting Horizons, 5(1): 51-63;
Imhoff, E.A., Lipe, R.C., & Wright, D.W. 1997. “Operating leases: Income effects of constructive capitalization.” Accounting Horizons, 11(2): 12-32;
International Accounting Standards Board. 2016. “Effects Analysis: IFRS 16 Leases.” Accessed September 7th, 2018. https://www.ifrs.org/-/media/project/leases/ifrs/published-documents/ifrs16-effects-analysis.pdf;
Kargin, S., Arıcı, N.D., & Aktaş, R. 2017. “Changes New Leases Standard IFRS 16 Has Brought and Evaluation of Its Possible Effects on Financial Reports and Financial Ratios of Corporations.” Journal of Business Research – Turk, 9: 858-881. Doi:
10.20491/isarder.2017.362.
Kilpatrick, B. G. & Wilburn, N.L. 2006, “Off balance sheet financing and operating lease: Impact on lessee financial ratios” RMA Journal, 89(4): 80-87. Doi:
44 King & Spalding. 2018. “Covenants Reconsidered In Preparation for New Lease Accounting Rules (ASC 842; IFRS 16).” Accessed November 19th, 2018.
https://www.jdsupra.com/legalnews/covenants-reconsidered-in-preparation-65513/; KPMG. 2016. “Leases Transition Options.” Accessed November 19th, 2018. https://www.in.kpmg.com/ifrs/files/Leases-Transition-Options-Nov-2016.pdf KPMG. 2017. “IFRS Leases Supplement.” Accessed September 12th, 2018.
https://assets.kpmg/content/dam/kpmg/xx/pdf/2017/12/ifrs16-ifs-supplement-2017.pdf; KPMG. 2017. “Leases Discount rates.” Accessed November 19th, 2018.
https://home.kpmg/content/dam/kpmg/xx/pdf/2017/09/leases-discount-rate.pdf;
KPMG. 2018. “New leases standard – Introducing IFRS 16” Accessed September 5th, 2018.
https://home.kpmg/xx/en/home/insights/2016/01/leases-new-standard-balance-sheet-transparency-slideshare-first-impressions-ifrs16-130116.html;
Lee, B., Paik, D.G., & Yoon, S.W. 2014. “The Effect of Capitalizing Operating Leases On the Immediacy to Debt Covenant Violations.” Journal of Accounting and Finance, 14(6): 44-70; Libby, R., Bloomfield, R., Nelson, M. 2002. “Experimental research in financial accounting.” Accounting, Organizations and Society, 27(8): 775-810; doi: 10.1016/S0361-3682(01)00011-3
Lim, S.C., Mann, S.C., & Mihov, V.T. 2003. “Market Evaluation of Off-Balance Sheet Financing: You can run but you can’t hide. Texas Christian University.” Working Paper. Retrieved from: https://papers.ssrn.com/sol3/papers.cfm?abstract_id=474784
Moody’s August 24, 2011 Special Comment: “Loan-Covenant Clauses Protect Companies From Default When Accounting Changes.” Accessed September 7th, 2018.
45
https://www.ifrs.org/-/media/project/leases/ifrs/published-documents/ifrs16-effects-analysis.pdf;
Moody’s. 2018. “Announcement: Moody's changes its treatment of leases in response to new IASB and FASB accounting requirements” Accessed December 16th, 2018.
https://www.moodys.com/research/Moodys-changes-its-treatment-of-leases-in-response-to-new--PR_386685
Nakisa. 2018. “Getting Ready for Take-off: Choosing the Right Adoption Method – Retrospective or Modified Retrospective.” Accessed November 19th, 2018.
https://www.nakisa.com/blog/accounting-compliance/choosing-right-adoption-method; Nelson, A.T. 1963. “Capitalising leases – the effect on financial ratios.” Journal of Accountancy: 49-58.
Nordea Bank. 2017. “IFRS 16 – The return of the leases.” Accessed September 12th, 2018. https://nordeamarkets.com/wp-content/uploads/2017/06/Nordea-On-Your-Mind-190617.pdf; Öztürk, M., & Serçemeli, M. 2016. “Impact of new standard ‘IFRS 16 leases’ on statement of financial position and key ratios: a case study on an airline company in Turkey.” Business and Economics Research Journal, 7(4): 143-157;
Paik, D.G.H., Smith, J.A.L., Lee, B.B. & Yoon, S.W. 2015. “The Relation between Accounting Information in Debt Covenants and Operating Leases.” Accounting Horizons, 29(4), 969-996. doi: 10.2308/acch-51214.
PwC. 2016. “A study on the impact of lease capitalization.” Accessed September 12th, 2018. https://www.pwc.com/gx/en/audit-services/publications/assets/a-study-on-the-impact-of-lease-capitalisation.pdf;
46 PwC. 2016. “IFRS 16: The leases standard is changing – are you ready?” Accessed
September 12th, 2018. https://www.pwc.com/gx/en/services/audit-assurance/assets/ifrs-16-new-leases.pdf;
Sengupta, P., & Wang, Z. 2011. “Pricing of Off-Balance Sheet Debt: How Do Bond Market Participants Use the Footnote Disclosures on Operating Leases and Postretirement Benefit Plans?” Accounting & Finance, 51(3): 787-808. doi: 10.1111/j.1467-629X.2010.00368.x Standard & Poor’s. 2013. “Request for Comment: Corporate Criteria: Ratios And
Adjustments” Accessed December 16th, 2018.
https://www.standardandpoors.com/ja_JP/delegate/getPDF?articleId=1494794&type=COMM E;
Thomason, K. 2017. “The Difference Between Principles & Rules-Based Accounting Standards”. Acessed October 5th, 2018. https://bizfluent.com/info-8333888-difference-principles-rulesbased-accounting-standards.html;
Wong, K., & Joshi, M. 2015. “The Impact of Lease Capitalisation on Financial Statements and Key Ratios Evidence from Australia.” Australasian Accounting, Business and Finance Journal, 9(3): 27-44. Websites http://www.efrag.org/; https://home.kpmg/pt/pt/home.html; https://www.demonstratingvalue.org/resources/financial-ratio-analysis; https://www.ey.com/pt/en/home;
47 https://www.ifrs.org/; https://www.ifrs.org/about-us/how-we-set-standards/; https://www.investopedia.com/terms/r/ratioanalysis.asp; https://www.pwc.com/; https://www.stock-analysis-on.net/; https://www.tapairportugal.com/en/about-us/annual-reports; https://www.wallstreetmojo.com/financial-lease-vs-operating-lease/ https://www2.deloitte.com/pt/pt/pages/about-deloitte/articles/about-deloitte.html