Wage Inequality: Trends and Drivers in
Portugal
Francisco Espiga
Dissertation written under the supervision of Joana Silva
Dissertation submitted in partial fulfilment of requirements for the MSc in
Economics, Major in Public Policy and Regulation, at the Universidade Católica
2
Wage Inequality: Trends and Drivers in Portugal
Francisco Espiga
Abstract
This thesis examines the evolution of wage inequality and its potential drivers, using harmonized household surveys and longitudinal matched employer-employee data from Portugal. Wage inequality was relatively stable until 2013 and has fallen since then. Changes in the variance of wages across workers with different skills and sector-occupations contributed to the change in wage inequality. In particular, the reduction in the education and experience premiums and the compression of wages across sector-occupations, played a major role over the past years. Nevertheless, a significant part of the change in inequality occurred among workers with similar skills and sector-occupations. Evidence based on additive worker and firm fixed effects models shows that heterogeneity across firms’ pay premiums reduced wage inequality. In contrast, increased heterogeneity across workers contributed to the relative stability of wage inequality during 2004-13. The evidence also suggests that wage dispersion within firms was relatively constant over time, and most of the registered changes were associated with changes in the wage dispersion between firms. Finally, the evolution of wage inequality differed across business cycles. During the crisis period of 2009-13, wage decreases across all wage percentiles led to a relatively stable inequality trajectory. During the non-crisis period, wage improvements among low-wage sectors and occupations and deterioration among high-wage sectors and occupations led to a gradual reduction in wage inequality.
Keywords: wage inequality, skill groups, education and experience premium, sector-occupation groups, fixed effects, worker, firm, business cycles
3
Desigualdade salarial: tendência e vetores em
Portugal
Francisco Espiga
Resumo
Esta tese examina a evolução da desigualdade salarial e potenciais fatores, usando dados harmonizados de inquéritos às famílias e dados longitudinais empresa-trabalhador em Portugal. A desigualdade salarial permaneceu relativamente estável até 2013 e caiu a partir daí. Mudanças na variância dos salários entre trabalhadores com diferentes aptidões que trabalham em diferentes sectores-ocupações contribuíram para a mudança na desigualdade. Em particular, a redução dos prémios de educação e experiência e compressão dos salários entre sectores-ocupações, desempenharam um papel importante nos últimos anos. No entanto, uma parte significativa da mudança na desigualdade ocorreu entre trabalhadores que têm aptidões e que trabalham em sectores-ocupações semelhantes. Os resultados baseados em modelos aditivos de efeitos fixos de trabalhador e empresa mostram que a heterogeneidade entre prémios pagos pelas empresas reduziu a desigualdade salarial. Contudo, o aumento da heterogeneidade entre trabalhadores atuou no sentido contrário, contribuindo para a relativa estabilidade da desigualdade salarial durante o período 2004-2013. Os resultados também sugerem que a dispersão salarial dentro das empresas foi relativamente constante ao longo do tempo e a maioria das mudanças registadas estiveram associadas a mudanças na dispersão salarial entre empresas. Finalmente, a evolução da desigualdade salarial diferiu entre ciclos económicos. No período de recessão/crise de 2009-13, as reduções salariais nos diferentes percentis salariais levaram a uma trajetória de desigualdade relativamente estável. Durante o período de não crise, as melhorias salariais entre os setores e ocupações de baixos salários e a deterioração entre setores e ocupações com altos salários levaram a uma redução gradual da desigualdade salarial.
Palavras-chave: desigualdade salarial, grupos de capacidade, retribuições de educação e de experiência, grupos de setores-ocupações, efeitos fixos, trabalhador, empresa, ciclos económicos
4
Acknowledgements
I would like to start by thanking my dissertation supervisor Joana Silva for all the guidance and help over the past few months. This dissertation wouldn’t have been possible without the technical expertise and support of Professor Joana, that always motivated me to improve my dissertation. I appreciate all the availability for regular meetings in the last months and trust in my work.
I would also like to thank Instituto Nacional de Estatística (INE) for providing me access to fundamental databases (Quadros de Pessoal and Inquérito às Condições de Vida e Rendimento) used in this study, as well as, for all technical support when necessary. I am also grateful to professors Miguel Portela and Pedro Raposo for helping me with the cleaning of the datasets used in this dissertation, in particular with the coding used on Stata.
I am also thankful to Martim Leitão for the precious help in my thesis’s language revision. A special thanks to Catarina David and all my colleagues from the Applied Economics dissertation seminar for all the mutual help and support with the dissertation throughout this last semester.
Finally, I would like to thank my family, friends, university and all people that directly and indirectly contributed for my success during this last years at the university.
5
Contents
1. Introduction ... 8 2. Empirical methodology ... 12 3. Data description ... 15 4. Results ... 164.1. Wage inequality trends in Portugal and international comparisons ... 16
4.2. Inequality between skill groups: analysis of education and experience premiums ... 22
4.3. Heterogeneity across workers and firms ... 32
5. Wage inequality and business cycle ... 36
6. Conclusion ... 39
References... 40
Appendix ... 45
A1 – Data Sources ... 45
A1.1 Inquérito às Condições de Vida e Rendimento ... 45
A1.2 Quadros de Pessoal ... 48
6
List of Figures
Figure 1 – Evolution of wage inequality, Portugal ... 17
Figure 2 – Wage growth by percentile, Portugal ... 18
Figure 3 – Wage inequality in different OECD countries ... 19
Figure 4 – Evolution of wage inequality using different data sources ... 20
Figure 5 – Evolution of wage inequality by age groups ... 21
Figure 6 – Evolution of the composition-adjusted education premium ... 23
Figure 7 – Evolution of composition-adjusted experience premium ... 24
Figure 8 – Evolution of relative labor supply of different education levels ... 25
Figure 9 – Evolution of relative labor supply of different experience levels ... 26
Figure 10 – Evolution of composition-adjusted experience premium in terms of tenure ... 27
Figure 11 – Evolution of relative labor supply of different experience levels in terms of tenure ... 28
Figure 12 – Decomposition of variance of wages across workers and firms ... 33
Figure 13 –Variance of wages between and within firms ... 36
Figure 14 – Wage inequality in crisis and non-crisis subperiods ... 38
Figure A1.1 – Comparison of QP and ICOR in terms of wage distribution ... 52
Figure A2.1 – Wage growth by percentile on QP ... 55
Figure A2.2 – Evolution of composition-adjusted education premium on ICOR ... 56
Figure A2.3 – Evolution of composition-adjusted experience premium on ICOR ... 57
Figure A2.4 – Evolution of relative labor supply of different education levels on ICOR ... 58
7
List of Tables
Table 1 – Variance of wages within and between skill groups ... 29
Table 2 – Variance of wages within and between skill groups and sector-occupation groups 31 Table A1.1 – Comparison of QP and ICOR in terms of average wage and size ... 51
Table A2.1 – Percentiles of Portuguese wage distribution according to ICOR ... 53
Table A2.2 – Percentiles of Portuguese wage distribution according to QP ... 54
8
1. Introduction
A large body of research studies the increase in inequality and its drivers. Although this trend has marked many developed countries (Acemoglu and Autor 2011; Atkinson 2008) and developing countries (Ge and Yang 2014; Lee and Wie 2017; Lee and Wie 2015), inequality is not increasing everywhere. Recent evidence from Portugal suggests that household income inequality has decreased since 2004 (Alves, Cardoso, and Monteiro 2020; Arnold and Rodrigues 2015). However, this trend has become less pronounced since the financial and sovereign debt crisis.
This thesis examines the evolution and drivers of wage inequality, which is the main component of income inequality1, in Portugal from 2004 to 2018. It focuses on the contribution of worker
characteristics, such as education and experience, as well as firm heterogeneity. Most of the literature emphasizes the role of “secular forces”, such as technological change and trade (e.g. Autor, Katz, and Krueger 1998; Acemoglu and Autor 2011; Krueger 2012; Autor and Dorn 2013; Feenstra and Hanson 1999; Autor, Dorn, and Hanson 2013; Autor et al. 2014; Pierce and Schott 2016). This thesis highlights the role of “cycle dependent forces”, by examining the evolution of wage inequality in periods of slowdown and crisis, versus periods of economic growth.
The thesis uses a rich combination of (harmonized) household survey and longitudinal administrative employer-employee data for Portugal. It has four main parts. The first part documents the pattern of wage inequality in Portugal, comparing it with other Organisation for Economic Cooperation and Development (OECD) countries using similar household survey data. The second part uses richer administrative data from Portugal to analyze labor earnings inequality by workers’ key socio-economic characteristics, computing education and experience premiums, and disentangling the contribution of changes in between- and within-group inequality to changes in inequality. Then, the analysis is extended by including sector-occupation groups, highlighting how wage differences across sectors and sector-occupations contributed to wage inequality changes. In the third part, this analysis is complemented by a study of the role of firm heterogeneity, using longitudinal matched employer-employee administrative data. The study decomposes changes in wage inequality over time into firm and
1 Wages in Portugal represent approximately 65% of total household income in 2017 (computed using data from
9
worker fixed-effects, a model that was first proposed by Abowd, Kramarz, and Margolis (AKM, 1999). It disentangles the contributions of unobserved worker and firm heterogeneity to changes in wage inequality and emphasizes the evolution and contribution of wage dispersion within and between firms to inequality in the Portugal. The fourth part of the thesis relates the business cycle to wage inequality in the country through differential wage dynamics in crisis and non-crisis periods.
The analysis yields four main empirical results. First, in contrast with the reduction in household income inequality, wage inequality in Portugal remained relatively stable until 2013, with a small reduction between 2009 and 2011 (as in Portugal, Raposo, and Reis 2018). But between 2013 and 2018, wage inequality decreased. This reduction resulted from a much faster wage growth at the bottom 5th and 25th percentile of the wage distribution than at the median, 75th and
95th percentile. This trend is particularly relevant, given that the international comparisons
developed in this thesis show that the level of wage inequality in Portugal is above the OECD average, although it is below the levels in the United States and Latin America. Interestingly, compared with older people, younger individuals contributed more to the downward trend in wage inequality in Portugal.
Second, the education premium has fallen over time, contributing to less wage inequality. The premium associated with firm tenure (time working at the same firm) also fell throughout the whole period. In contrast, the labor market experience premium has been almost stagnant until the past few years. Decomposing the contribution to the overall change in wage inequality of between- and within-skill-groups changes in wage inequality, defined in terms of education and experience, I find that the importance of the between-skill-groups component surpassed that of the within-group component and was larger after 2013. This contribution increased significantly when workers’ sector-occupation groups are included. The changes in the variance between sector-occupation groups played a larger role in inequality dynamics after 2013, and their contribution to the overall change in wage inequality surpasses the one from the within component.
Third, firms had a key role in the recent wage inequality dynamics in Portugal. Using AKM models to decompose wage variance, heterogeneity across workers explains between 60% and 70% of the overall inequality, while firm heterogeneity explains between 22% and 28%. This result is consistent with the literature, even if there might be some differences on the
10
specification used (see, for example, Portugal, Raposo and Reis (2018) for evidence for Portugal, and Alvarez et al. (2018) and Card, Heining, and Kline (2013) for evidence for Brazil and Germany, respectively). However, changes in firm heterogeneity has the largest contribution to the reduction of overall inequality during the period under analysis. Between 2004 and 2013, the small reduction in wage inequality (mainly in 2009 and 2010) was due to the reduction in differences across firms and the association between highly remunerated workers and high-paying firms. However, heterogeneity across workers increased over the same period and contributed to a more stable trend in inequality. Between 2009 and 2017, wage inequality also decreased due to the reduction in the differences across workers and firms, contributing to the downward trend after 2013. When decomposing inequality in the wage variance between- and within-firm, the within-firm dispersion remained with a smaller contribution and relatively stable, compared with the between-component, and exhibited a smaller contribution to the change in the overall wage inequality. These results are consistent with Messina and Silva (2019) for Latin America and Song et al. (2019) for the United States. Fourth, during the crisis period (2009-13), all wages fell, both in high- and low-earnings sector-occupations, which explains the relative stability of inequality. During the period that followed (2014-17), there was a combined effect of wage increases among sector-occupations earning less and wage decreases among sector-occupations earning more, resulting in lower inequality. These results differ from those of Autor, Katz, and Kearney (2008) where United States’ wage inequality was shown to be increasing.
This thesis examines wage inequality in Portugal, contributing to three strands of previous literature. First, it contributes to a large literature studying the role of workers’ characteristics, such as education, experience, or occupation, in wage inequality dynamics. Most of this literature focuses on the United States, showing that the increase in wage inequality registered between the 1960’s and the 2000’s was strongly associated with higher differentials between gender-experience-education groups, and between college and high school graduates (e.g., Autor, Katz, and Kearney 2008; Goldin and Katz 2008; Acemoglu and Autor 2011). Latin America has recently received renewed attention, as wage inequality has fallen significantly since 2002 (except in Costa Rica). Recent papers find that two-thirds of the decline in the wage inequality in the region has occurred within skill groups. Although changes in the sectoral, occupational, and formal/informal composition of the workforce matter, they do not fully explain the reduction in within-skill variance (e.g. Messina and Silva 2019). This thesis
11
contributes to this literature by re-examining these questions for Portugal and decomposing the contribution (and relative importance) of changes in both between- and within-group wage inequality to the overall changes in wage inequality in a country with subperiods with markedly different inequality dynamics, and using datasets that cover the whole economy.
Second, the thesis contributes to a growing literature that highlights the role of firms in wage inequality dynamics, using linked employer-employee datasets. Card, Heining, and Kline (2013) document an increase in wage inequality from 1985 to 2009 in West Germany. They show that the key factors behind this trend were greater dispersion across workers and firms and a higher association between high-paying firms and highly paid workers. Studies of the United States between 1978 and 2013 have documented an increase in wage inequality, where the main contributor was the heterogeneity across workers, followed by the covariance of worker and firm effects. In these cases, the heterogeneity across firms decreased. However, when inequality is decomposed into differences between and within firms in the United States, both these terms contributed to the increase in wage inequality (e.g., Song et al. 2019). Recent studies of Latin America also confirm the decisive role played by heterogeneity across firms in the reduction of wage inequality, even if the majority of this inequality is still associated with heterogeneity across workers (e.g., Alvarez et al. 2018; Messina and Silva 2019). A recent paper on Central and Eastern European countries, which also decomposes wage inequality into between- and within-firm components, shows that dispersion across firms was the main contributor to the decrease in wage inequality in the majority of these countries, although dispersion within firms also diminished between 2006 and 2014 (e.g., Magda, Gromadzki, and Moriconi 2019). For Portugal, using high-dimensional fixed effects models, recent papers show that heterogeneity between workers contributed the majority towards wage inequality throughout 1990’s, followed by heterogeneity across firms. The relatively stable worker and firm components contributed to a period of relative stagnation of wage inequality after 1992 (despite a decrease in 2009/2010), even though the association between well-paid workers and high-paying firms followed a downward trend (e.g., Torres et al. 2013; Portugal, Raposo, and Reis 2018). This thesis contributes to this literature by re-examining these issues, covering the recent years where changes in the overall inequality were more significant.
Third, this thesis contributed to the literature that relates the business cycle with wage inequality. It adapts the approach of Autor, Katz, and Kearney (2008). These authors analysed wage variations along occupational skill percentiles in the United States in different subperiods,
12
studying wage growth for low- and high-wage workers. In this thesis, through the study of changes in wages across sector-occupation wage percentile in crisis and non-crisis subperiods, it is possible to characterize wage variations across the business cycle and verify who are the groups (workers in poorer or richer sector-occupations) contributing the most to the wage inequality pattern.
The thesis proceeds as follows. Section 2 presents the empirical methodology. Section 3 describes the data used in the analysis. Section 4 provides the results on the study of wage inequality patterns and drivers. Section 4.1 describes wage inequality patterns in Portugal since 2004, compares them with other OECD countries, and analyses wage inequality dynamics across demographic groups. Section 4.2 shows the evolution of education and experience premiums through time and the related changes on labor supply. The analysis is also complemented by a decomposition of wage inequality changes into changes in the between- and within-skill- (and sector-occupation) components. Section 4.3 presents new evidence on the role of worker and firm heterogeneity for changes in wage inequality, and decomposes the overall change in wage dispersion in its within- and between-firm components. Section 5 examines wage inequality dynamics during periods of crisis and of positive economic growth in Portugal. Finally, section 6 concludes.
2. Empirical methodology
This thesis has three main parts that use distinct empirical methodologies. The initial part of the thesis documents wage inequality trends for Portugal since 2004 and compares them with those in other OECD countries2. It assesses trends in three main wage inequality indexes: the Gini
Coefficient, the variance of earnings and the log 90/10 differential. This part of the thesis uses year-to-year cross-sectional data for Portugal. For comparability, Portuguese information on wages was harmonized using the same methodology as the one applied to other countries (see detail below).
The second part of the thesis uses the richness of the Portuguese administrative data to compare “composition” adjusted education and experience premiums, studying the pattern of the evolution of these premiums over time, disregarding changes on each group composition. The
13
methodology adopted to adjust for changes in composition is based on Autor, Katz and Kearney (2008), Acemoglu and Autor (2011), Centeno and Novo (2014) and Messina and Silva (2019). It includes four steps. First, worker data in each year is allocated between 24 education-experience-gender groups (skill groups). The skill groups are obtained from three education categories (less than high school education, high school education, college education or more), four experience categories (0-9, 10-19, 20-29, 30 or more years of experience) and two genders3. Second, composition-adjusted predicted log of real hourly wages at each skill group
and year are estimated from regressing, for each gender and year separately, the log of real hourly wages on the interaction terms of education and experience categories. Third, weighted averages of predicted log of real hourly wages are computed for broader education or experience groups, using mean employment share of each skill group from 2004 to 2017 as a fixed weight, obtaining the expected wages of a worker with some education or experience skill for each year4. Fourth, education or experience premiums (log relative real hourly wages
between different groups) are obtained by differentiating average predicted log of real hourly wages across education or experience groups in each year.
Afterwards, the previous analysis was complemented by further disentangling the factors behind overall wage inequality trends. It starts with a decomposition of the overall variance of log wages on its between- and within-group components to quantify their relative importance. Skill groups are still defined by education, experience and gender categories as before. Following Messina and Silva (2019), the within-skill component of overall variance is measured by estimating a standard Mincer regression having skill variables and all their interactions as regressors. Specifically, the estimated regression is:
𝑤𝑖𝑡 = 𝑥′𝑖𝑡𝛽𝑡+ 𝜀𝑖𝑡 (1)
where wit stands for log of real hourly wages of worker i in year t, x’it is the vector of all
interactions between education, experience and gender categories for worker i in year t, βt is
the vector of the return to skills in year t and εit is the error term/residual of worker i in year t.
3 Education is divided in three categories based on worker’s highest education level completed. Worker’s
observations without information on education were eliminated. Workers that completed technical courses are considered as having completed high school education. Experience is determined through worker’s age minus 16 (workers completed less than high school level) or 18 (workers completed high school level) or 21 (workers completed college level). Worker’s observations with negative values on experience were eliminated.
4 Other alternative fixed weights can be used in the analysis. Employment share of each group in year 2017 was
14
The variance between skill groups, after computing the variance of log of real hourly wages in each year, was given by the overall variance minus the variance within skill groups. Due to the linearity of this decomposition, it also holds for changes in the variance, the variable of interest. To further decompose the changes within and between groups, the sector-occupation pay differentials dimension was considered and equation (1) was extended as follows:
𝑤𝑖𝑡 = 𝑥′𝑖𝑡𝛽𝑡+ 𝜎𝑆𝑂(𝑖,𝑡)+ 𝜀𝑖𝑡 (2)
where 𝜎𝑆𝑂(𝑖,𝑡) stands for sector-occupation of worker i at year t. After estimating regression (2) in each year, the total wage variance was decomposed in variances among sector-occupations and skill groups, twice the covariance between skill and sector-occupation groups and variance of residual component. The decomposition can also be applied to the changes on variance of log real hourly wages.
The third part of the analysis, examines the role of firms in which workers are employed, a dimension of wage dispersion that the previous analysis did not consider. Workers of different firms may have differences on their earnings even if skills and sector-occupations are identical. Thus, firms become an important dimension of wage inequality, and studying their heterogeneity may shed light on inequality patterns. This thesis decomposes the wage variance on the worker and firm components to evaluate the contribution of firm’s heterogeneity to wage inequality using high dimensional fixed effects model (the AKM model, first proposed by Abowd, Kramarz and Margolis 1999) by subperiods (2004-2009, 2009-2013 and 2013-2017), following Card, Heining and Kline (2013); Alvarez et al. (2018), Messina and Silva (2019) and Song et al. (2019) approach. The AKM regression model estimated in each subperiod is:
𝑤𝑖𝑡 = 𝜔𝑖 + 𝛿𝐹(𝑖,𝑡)+ 𝜏𝑡+ 𝜀𝑖𝑡 (3)
where 𝑤𝑖𝑡 is the log of real hourly wages of worker i at year t and it is given by the sum of 𝜔𝑖, 𝛿𝐹(𝑖,𝑡), 𝜏𝑡 and 𝜀𝑖𝑡 standing for the worker component, firm component, year effect and residual
component, respectively, assuming that residual respect a strict exogeneity condition regarding the other components. Due to the use of longitudinal matched employee-employer data, allowing to follow workers through employers and time, and using Correia (2014) estimation method for high dimensional fixed effects model, it was possible to obtain the workers, firms and year fixed effects in each subperiod. This specification allows to analyze, separately, the earnings for different fixed observable or unobservable worker’s characteristics (for example
15
worker’s ability) remunerated equally across firms from the persistent firm’s pay premiums (worker’s remuneration at each firm associated, for example, with rent-sharing)5. The error term
accounts for temporary wage levels of workers and the fluctuations that might occur. After estimating the fixed effects on the previous AKM model, the wage variance in each subperiod was linearly decomposed in:
𝑉𝑎𝑟(𝑤𝑖𝑡) = 𝑉𝑎𝑟(𝜔𝑖) + 𝑉𝑎𝑟(𝛿𝐹(𝑖,𝑡)) + 𝑉𝑎𝑟(𝜏𝑡) + 2 ∗ 𝐶𝑜𝑣(𝜔𝑖 , 𝛿𝐹(𝑖,𝑡))
+ 2 ∗ 𝐶𝑜𝑣(𝜔𝑖 , 𝜏𝑡) + 2 ∗ 𝐶𝑜𝑣(𝛿𝐹(𝑖,𝑡) , 𝜏𝑡) + 𝑉𝑎𝑟(𝜀𝑖𝑡) (4)
where 𝑉𝑎𝑟(𝑤𝑖𝑡) stands for the variance of log real hourly wages, 𝑉𝑎𝑟(𝜔𝑖), 𝑉𝑎𝑟(𝛿𝐹(𝑖,𝑡)),
𝑉𝑎𝑟(𝜏𝑡) and 𝑉𝑎𝑟(𝜀𝑖𝑡) are the variance of worker, firm, year and residual component, respectively, 𝐶𝑜𝑣(𝜔𝑖 , 𝛿𝐹(𝑖,𝑡)) is the covariance of worker and firm component, 𝐶𝑜𝑣(𝜔𝑖 , 𝜏𝑡) is the covariance of worker and year component and 𝐶𝑜𝑣(𝛿𝐹(𝑖,𝑡) , 𝜏𝑡) is the covariance of firm and
year component. Based on the previous interpretation of the worker and firm component, the variances represent wage heterogeneity across workers related to their fixed characteristics (observable or unobservable) and wage heterogeneity across firms from their distinct pay premiums to employees.
3. Data description
The analysis in this paper draws on two main datasets:
(i) Inquérito às Condições de Vida e Rendimento (ICOR), which is collected by the
Portuguese Institute of Statistics. ICOR is the Portuguese annual household survey and contains information on earnings, demographic characteristics (gender, age, schooling) and job characteristics (job situation, self-definition of working conditions, work experience, occupation and hours of work) of individuals and their families (when applied), besides the information and data on health and living conditions. The ICOR data are available for the period 2004-2018, with close to 29400 individuals and 13700 families covered in 2018. Since ICOR didn’t exist before 2004, the first year studied is 2004. This thesis restricts attention to full-time dependent workers aged between 18 and 65 years old (working age population). It
5 As in Alvarez et al. (2018) and Messina and Silva (2019), time-varying observable characteristics of workers are
not introduced in the model, avoiding the need to consider their effects in small subperiods when changes occur in the within component.
16
uses real gross hourly wages in the main activity of the worker. Sample weights were applied in all computations and estimations. Appendix A1.1 provides more details on the ICOR database and on the treatment of the data used.
(ii) Quadros de Pessoal (QP), which is collected by the Portuguese Ministry of
Employment. It covers virtually all workers and firms in the Portuguese private sector with more than one worker, having around 200,000 firms and more than 2 million workers each year over the 2004-2017 period. It provides comprehensive information on workers’ demographic characteristics (age, gender, schooling), job characteristics (occupational group, professional category, wage, hours worked and firm tenure), along with employing firm identifier codes. Firm-level characteristics include sales, number of employees, equity, percentage of foreign capital, geographical location and date of creation, along with industry code. As the Portuguese classification of firm’s economic sectors (Classificação Portuguesa das
Atividades Económicas - CAE) has been revised in 2007 to match the NACE Rev.2,
a concordance was needed and the analysis since 2007 considers 20 sectors according to the one-digit level classification. In the case of the occupation classification, it was revised in 1994 (Classificação Nacional de Profissões - CNP) and 2010 (Classificação Portuguesa de Profissões - CPP). A concordance was also needed and the analysis done since 2010 considers 11 major groups of CPP/2010. In QP, analysis is restricted to full-time dependent workers aged between 18 and 65 years old (working-age population) from 2004 to 2017. It is used real gross hourly wages on the main activity of the worker. More details and information on the QP database and data treatment in Appendix A1.2.
I supplement this data with information on wage inequality indicators for OECD countries computed using surveys comparable to ICOR.
4. Results
4.1. Wage inequality trends in Portugal and international comparisons
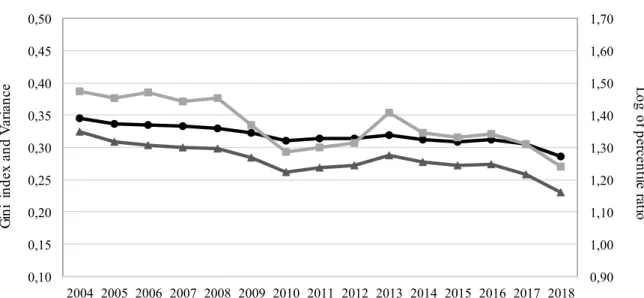
Figure 1 shows the evolution of wage inequality in Portugal since 2004 using ICOR data. It uses three different indicators: Gini index of real hourly wages6, variance of log real hourly
6 The Gini index measures wage’s concentration, varying between zero (perfect equality) and one (perfect
17
wages and log of percentile ratio p90/p10 of real hourly wages7. These three indicators are
important to check the robustness of the findings and serve as the basis for different parts of the remaining analysis. For example, the variance allows one to decompose the overall inequality in its components. Using log of real hourly wages on the variance has the advantage of not being sensitive to identical proportional changes in wages (Atkinson 1970).
A similar pattern emerges across all three indicators: inequality remained relatively stable until 2013, following a downward trend after this period. In particular, inequality had minor fluctuations before 2009, maintaining its level, followed by a decrease of almost 6%, 13% and 12% in the Gini index, variance and log percentile ratio, respectively, from 2008 to 2010. However, the slight increase in inequality between 2010 and 2013, contributes to the stability in wage inequality trend. After 2013, inequality fell around 10%, 20% and 12% when measured using the Gini index, variance and log percentile ratio, respectively, until 2018, presenting a downward trend.
Figure 1 – Evolution of wage inequality, Portugal
Source: Computed using data from Inquérito às Condições de Vida e Rendimento (ICOR)
Note: Figure presents three measures of wage inequality between 2004 and 2018: Gini index of real hourly wages,
variance of log real hourly wages and log of percentile ratio p90/p10 of real hourly wages. Results are generated using cross-sectional sample weights. Wages appear as gross wages in main occupation and it was used the consumer price index to convert in real terms. The 1st and 99th percentile of real hourly wages in each year were
trimmed.
7 The percentile ratio p90/p10 measures wage inequality, focusing on the wage differences between top and bottom
deciles. 0,90 1,00 1,10 1,20 1,30 1,40 1,50 1,60 1,70 0,10 0,15 0,20 0,25 0,30 0,35 0,40 0,45 0,50 2004 2005 2006 2007 2008 2009 2010 2011 2012 2013 2014 2015 2016 2017 2018 Lo g of p erc en tile ra tio G in i in de x an d V ar ia nc e
Gini index of real hourly wages Variance of log real hourly wages
18
Figure 2 presents the 5th, 25th, 50th, 75th and 95th wage percentiles growth between 2004 and
20188. Wage, as before, was defined as real hourly wages and 2008 was chosen as the index
base year. Three findings emerge from this figure, justifying the evolution of wage inequality. First, the increase of almost 10% in the 5th percentile and decrease of around 7% in the 95th
percentile between 2008 and 2010, contributed for the decrease in inequality in that period. Second, between 2011 and 2013 the deceleration of bottom percentiles growth and acceleration of top percentiles growth, contradicted the previous decrease on inequality. Third, the significant growth of more than 30% in bottom percentiles relative to 2008 in comparison with a lower growth at 50th, 75th and 95th percentiles, led to a reduction in wage inequality after 2013.
Figure 2 – Wage growth by percentile, Portugal
Source: Computed using data from Inquérito às Condições de Vida e Rendimento (ICOR)
Note: Figure presents the growth between 2004 and 2018 (index base at 2008) in the 5th, 25th, 50th, 75th and 95th
wage percentiles. Results are generated using cross-sectional sample weights. Wages appear as gross real hourly wages in main occupation and it was used the consumer price index to convert in real terms. The 1st and 99th
percentile of real hourly wages in each year were trimmed.
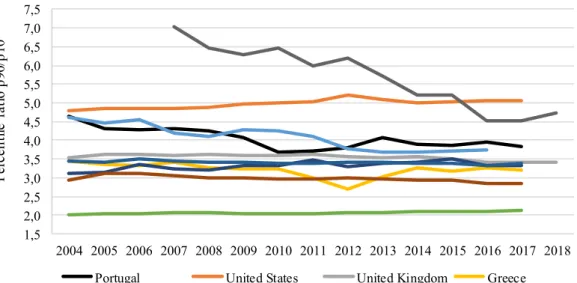
Figure 3 provides a comparative analysis of wage inequality evolution since 2004 on several OECD countries, including Portugal, based on collected data from household or individual surveys for each country. In each country, wage inequality was measured for full-time dependent workers, using the percentile ratio p90/p10 of gross earnings. Inequality in Portugal had one of the highest levels (between 3,69 and 4,65) among the European countries and above
8 Table A2.1 in Appendix A2 provides more information on the 5th, 25th, 50th, 75th and 95th wage percentiles in
19
OECD average level, but being surpassed by US and Latin American countries. Scandinavian countries, for example Sweden, have the lowest inequality levels in Europe (around a ratio of 2,0), while some Central and Eastern European countries, such as Hungary, are in the group of the most unequal countries in Europe. Portugal belongs to the latter group. In terms of changes in inequality, Portugal shows minor fluctuations in inequality in comparison with Latin America, even though there were some fluctuations and a decrease of around 18% in inequality between 2004 and 2017. The percentile ratio p90/p10 continuously decreased in Latin America countries, featuring for example a significant fall of almost 33% in Colombia between 2007 and 2018. In US between 2004 and 2017 and in Germany from 2004 to 2011, inequality grew almost 6% and 12%, respectively. Hungary, as an example of Eastern Europe countries, had fluctuations on wage inequality – this latter decreased by around 19% between 2004 and 2016. Therefore, since 2004, Portugal was one of the European countries in which inequality fluctuated the most, highlighting the relevance of studies on the evolution of inequality in Portugal.
Figure 3 – Wage inequality in different OECD countries
Source: Data from OECD.Stat
Note: Figure presents the percentile ratio p90/p10 for Portugal, United States, United Kingdom, Greece, Sweden,
Germany, Hungary, Japan, Colombia and OECD countries of gross wages for full-time dependent workers. Data from household or individual surveys done to each country.
Importantly, in order to make international comparisons, the current section studied initially inequality using ICOR datasets. However, as discussed in the methodological section, this thesis will use the richness of QP in subsequent parts. Unlike a survey, QP datasets have
1,5 2,0 2,5 3,0 3,5 4,0 4,5 5,0 5,5 6,0 6,5 7,0 7,5 2004 2005 2006 2007 2008 2009 2010 2011 2012 2013 2014 2015 2016 2017 2018 Pe rc en til e ra tio p 90 /p 10
Portugal United States United Kingdom Greece
Sweden Germany Hungary Japan
20
information on all dependent workers in Portugal, allowing to follow each worker over time (longitudinal data) and to identify firms where they work (linked employer-employee dataset), through unique identifiers of employees and employers. Hence, and to check the robustness of our findings to different data sources, Figure 4 plots wage inequality measures using ICOR and QP datasets. Results (in levels and trends) are remarkably similar. In particular, before 2009 inequality maintained its level, but from 2009 to 2011, the Gini index, variance and log percentile ratio decreased by 4%, 7% and 5%, respectively. However, they increase slightly in 2012 and 2013 contributing to the relative stability of wage inequality during this period. Importantly, these trends and levels are also consistent with previous papers analysing wage inequality in Portugal (Portugal, Raposo, and Reis 2018). As documented in this thesis using data from ICOR, data from QP confirms the downward trend in inequality registered between 2013 and 2017. Specifically, the Gini index, variance and log percentile ratio fell by around 8%, 15% and 9% respectively. Figure A2.1 in Appendix A2 presents a detailed analysis of wage growth by percentile, similar to figure 2, further confirming the consistency of wage inequality results across these two datasets9.
Figure 4 – Evolution of wage inequality using different data sources
Source: Computed using data from Inquérito às Condições de Vida e Rendimento (ICOR) and Quadros de Pessoal
(QP)
Note: Figure presents three measures of wage inequality: Gini index of real hourly wages, variance of log real
hourly wages and log of percentile ratio p90/p10 of real hourly wages. Results in ICOR are generated using cross-sectional sample weights. Wages appear as gross wages in main occupation and it was used the consumer price index to convert in real terms. The 1st and 99th percentile of real hourly wages in each year and database were
trimmed.
9 Table A2.2 in Appendix A2 provides the 5th, 25th, 50th, 75th and 95th wage percentiles in each year that were
used to compute percentiles growth in Figure A2.1.
0,90 1,00 1,10 1,20 1,30 1,40 1,50 1,60 1,70 0,10 0,15 0,20 0,25 0,30 0,35 0,40 0,45 0,50 2004 2005 2006 2007 2008 2009 2010 2011 2012 2013 2014 2015 2016 2017 2018 Lo g of p erc en tile ra tio G in i in de x an d V ar ia nc e
Gini index of real hourly wages - ICOR Gini index of real hourly wages - QP Variance of log real hourly wages - ICOR Variance of log real hourly wages - QP
Log of percentile ratio p90/p10 of real hourly wages - ICOR Log of percentile ratio p90/p10 of real hourly wages - QP
21
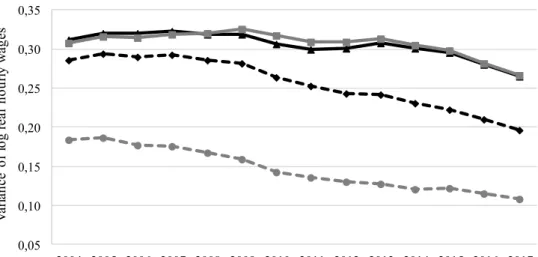
The use of QP, allows us to further exploit a dimension of wage dynamics that Alves, Cardoso, and Monteiro (2020) suggest could have been of particular importance: age. Following Alves, Cardoso, and Monteiro (2020), Figure 5 presents the evolution of wage inequality for different age groups between 2004 and 2017. Two important findings emerge. First, wage inequality is higher among older age groups. This is in line with the stylized fact documented in recent studies of increasing earnings inequality throughout the life-cycle due to effects of cumulative shocks during worker’s professional career (e.g. Alves, Cardoso, and Monteiro 2020). Second, in contrast with older age groups, inequality within younger age groups fell significantly during the period. Older age groups maintained a relatively stable wage inequality with a more continuous decrease only after 2013. In particular, between 2004 to 2017, the Gini index of new entrants fell by around 24% and variance by 41%, while that of 30-39 years old fell by around 17% and 31%, respectively. Before 2009, there was a slight increase of 4% and 6% in Gini index and variance, respectively, for the 50-65 years group. From 2009 to 2011, Gini index and variance for both 40-49 and 50-65 years old groups, decreased around 2% and 5%, respectively. After 2013, the Gini index of 40-49 and 50-65 years old groups decreased around 7% and 8% and the variance decreased 14% and 15%, respectively. Thus, older age groups were the main responsible for the stability of wage inequality between 2004-2013, even if they contributed for its reduction between 2009 and 2011. The common reduction across all age groups after 2013 contributed for the notorious downward trend in wage inequality during that period.
Figure 5 – Evolution of wage inequality by age groups
0,15 0,20 0,25 0,30 0,35 0,40 2004 2005 2006 2007 2008 2009 2010 2011 2012 2013 2014 2015 2016 2017 G in i in de x of re al h ou rly w ag es
Gini index by age groups
22
Figure 5 – Evolution of wage inequality by age groups (cont.)
Source: Computed using data from Quadros de Pessoal (QP)
Note: Figure presents, for each of the four age groups, two measures of wage inequality: Gini index of real hourly
wages and variance of log real hourly wages. The four age groups used for the computations were: 18-29 years old (new entrants), 30-39 years old, 40-49 years old and 50-65 years old. Wages appear as gross wages in main occupation and it was used the consumer price index to convert in real terms. The 1st and 99th percentile of real
hourly wages in each year were trimmed.
4.2. Inequality between skill groups: analysis of education and experience
premiums
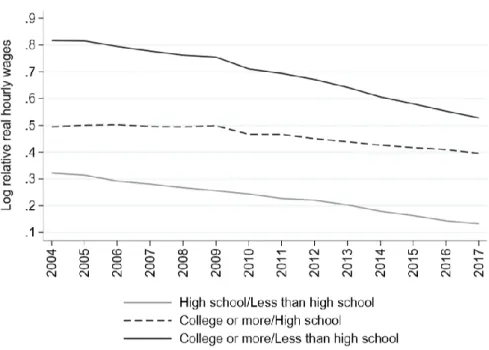
While the previous section presents wage inequality trends, the present and the next sections analyze their potential drivers. In what follows, the focus lies on the contribution of composition-adjusted education and experience premiums. Figure 6 presents the evolution of education premiums between 2004 and 2017, showing a general downward trend. In particular, between 2004 and 2017, log relative real hourly wages between workers with a high school and less than high school level and between workers with college and less than high school education fell by around 0,19 log points (59%) and 0,29 log points (35%), respectively. The gradual reduction on log of real hourly wages for workers with only high school level or a college degree combined with a relative stability followed by an increase on earnings for worker with less than high school, contributed for the observed patterns. Wage gaps between college and high school educated workers remained stable until 2009. In the following years, when average earnings of college educated workers started to decrease faster than high school educated workers, wage gaps between college and high school educated workers fell by around 0,1 log points (20%). Given the observed decrease in wage differentials between workers with
0,05 0,10 0,15 0,20 0,25 0,30 0,35 2004 2005 2006 2007 2008 2009 2010 2011 2012 2013 2014 2015 2016 2017 V ar ia nc e of lo g re al h ou rly w ag es
Variance by age groups
23
different education levels, wage inequality was expected to fall during the entire period, following a downward trend throughout, and not just since 2013. The wage inequality relative stability prior to 2013 suggests the existence of a countering effect from other simultaneous forces. Figure A2.2 in Appendix A2 replicates the analysis of composition-adjusted education premium using ICOR datasets, obtaining similar patterns.
Figure 6 – Evolution of the composition-adjusted education premium
Source: Computed using data from Quadros de Pessoal (QP)
Note: Figure presents composition-adjusted education premium between 2004 and 2017, in terms of log relative
real hourly wages. Graph includes wage gap analysis for workers with high school relative to less than high school level, college or more relative to high school level and college or more relative to less than high school level. Wages appear as gross wages in main occupation and it was used the consumer price index to convert in real terms. The 1st and 99th percentile of real hourly wages in each year were trimmed.
In terms of the evolution of the composition-adjusted experience premiums, Figure 7 provides an analysis of wage gaps between more experienced groups and new entrants (0-9 years of experience) from 2004 to 2017. Experience premium maintained a relative stable path, with some increase in 2011-2013 followed by a decrease in the last years. In particular, from 2015 to 2017, log relative real hourly wages of 20-29 years and 30 or more years groups reduced almost 0,04 log points (19%) and 0,04 log points (21%), respectively, after the increase in 2011-2013 of around 0,02 log points (14%) and 0,03 log points (20%), respectively. The significant reduction of log real hourly wages among the new entrants from 2011 to 2012 and the less significant increase from 2012 to 2013 (in comparison with the 20-29 years and 30 or more years groups), contributed for the observed increase in wage differentials between 2011 and 2013. After 2015, the more significant increase in wages of new entrants supported the decrease
24
of wage differentials. Only log relative real hourly wages of 10-19 years group continuously diminished along the period, especially after 2013 where the observed reduction was around 0.04 log points (27%). The relatively stable wages of 10-19 years group and the increasing wages of new entrants after 2013 contributed for this pattern. Figure 7 also suggests that wage gaps between more experienced workers and new entrants contributed to the wage inequality pattern observed. The increase in wage gaps from 2011 to 2013 are in accordance with the slight increase in inequality during this period, contributing to the stability registered until 2013. From 2013 to 2017, the decrease in observed wage gaps matches the downward trend in inequality. Figure A2.3 in Appendix A2 replicates the analysis using ICOR datasets obtaining stable patterns with some fluctuations, until 2013, and a more consistent decrease after 2015.
Figure 7 – Evolution of composition-adjusted experience premium
Source: Computed using data from Quadros de Pessoal (QP)
Note: Figure presents composition-adjusted experience premium between 2004 and 2017, in terms of log relative
real hourly wages. Graph includes wage gap analysis for workers with 10-19 years of experience relative to 0-9 years, 20-29 years of experience relative to 0-9 years and 30 or more years of experience relative to 0-9 years. Wages appear as gross wages in main occupation and it was used the consumer price index to convert in real terms. The 1st and 99th percentile of real hourly wages in each year were trimmed.
The evolution of composition-adjusted education and experience premiums can be explained, among other factors such as minimum wage or unemployment, by the interaction of labor supply and demand for skills throughout the period. Recent studies, for example for the US, suggest that between the 1980’s and 2000’s, the lower growth of the supply of more educated workers played an important role on the increase of education premium (e.g. Goldin and Katz 2008). In Latin America, studies suggest that the increase in the relative supply of more
25
educated and experienced workers in the 2000’s is consistent with the decreasing wage differentials, even though demand side factors also played a crucial role (e.g. Messina and Silva 2019).
Figure 8 presents the relative labor supply between education groups in Portugal. The relative labor supplies are computed based on the relative number of workers in each education category and year. From Figure 8, the relative supply growth of more educated workers contributed to the reduction of the education premium registered between 2004 and 2017. In particular, the supply of college and high school educated workers grew relative to workers with less than high school level by 0,21 (almost triple) and 0,29 (more than double), respectively. These changes contributed to the decline in their premium. Although supply dynamics play a central role on the premium reduction between 2004 and 2017, demand for skills also contributes for the observed pattern. The supply ratio between college and high school educated workers increased almost 0,17 between 2004 and 2012, maintaining a relative stability in the following years. There is an important role of relative demand between college and high school educated workers to explain premium evolution, as the pattern observed on relative supply differs from that of wage differentials. Figure A2.4 in Appendix A2 presents the relative labor supply by education groups on ICOR datasets, obtaining similar increasing patterns for college and high school educated workers relative to less than high school educated workers supply.
Figure 8 – Evolution of relative labor supply of different education levels
Source: Computed using data from Quadros de Pessoal (QP)
Note: Figure presents relative supply between education groups from 2004 to 2017. Graph includes relative supply
analysis of workers with high school relative to less than high school level, college or more relative to high school level and college or more relative to less than high school level. Wages appear as gross wages in main occupation and it was used the consumer price index to convert in real terms.
26
Figure 9 presents the relative labor supply of different experience groups in Portugal, based on the relative number of workers by experience group. Between 2004 and 2017, the relative supply of workers with more years of experience grew significantly vis a vis that of the workers between 0-19 years of experience. The observed pattern indicates strong population aging effects (increasing supply of more experienced workers), surpassing the effect of a delayed labor market entry of younger cohorts due to an increasing number of schooling years. Given the increasing presence in the working age population of more experienced workers relative to less experienced, a significant decrease on experience premiums would be expected. However, the premiums only fell more significantly after 2015, emphasizing the important role played by the demand side factor for the stability of wage inequality in the initial years. Figure A2.5 in Appendix A2 replicates, for ICOR datasets, the analysis of relative labor supply by experience groups, indicating similar patterns.
Figure 9 – Evolution of relative labor supply of different experience levels
Source: Computed using data from Quadros de Pessoal (QP)
Note: Figure presents relative supply between experience groups from 2004 to 2017. Graph includes a supply
analysis of workers with 20-29 years relative to 0-19 years of experience and 30 or more years relative to 0-19 years of experience. Wages appear as gross wages in main occupation and it was used the consumer price index to convert in real terms.
Wage differentials between different education or experience groups are widely studied using age minus years of education to determine experience of workers (e.g. Autor, Katz and Kearney 2008; Rodríguez-Castelán et al. 2016). This measure indicates the overall experience and skills acquired throughout the professional career since entering the labor market. A complementary
27
measure that I use is firm tenure, measured as the number of years working at the same firm. In the following analysis with firm tenure measuring experience, I still consider 24 education-experience-gender groups (skill groups), obtained from three education categories (less than high school education, high school education, college education or more), four experience categories in terms of tenure (0-1, 2-5, 6-12, 13 or more years of experience) and two genders10.
The previous methodology to obtain composition adjusted experience premiums is repeated. Figure 10 presents the wage differentials between experienced workers and new entrants (0-1 years of experience) in terms of firm tenure between 2004 and 2017. The evolution of wage gaps suggests a reduction on earnings of more experienced workers relative to new entrants contributing to a reduction in wage inequality throughout the entire period. These patterns suggest the presence of countering effects before 2013 contributing to the stability of wage inequality registered.
Figure 10 – Evolution of composition-adjusted experience premium in terms of tenure
Source: Computed using data from Quadros de Pessoal (QP)
Note: Figure presents composition-adjusted experience (tenure) premium between 2004 and 2017, in terms of log
relative real hourly wages. Graph includes wage gap analysis for workers with 2-5 years of experience in the same current firm relative to 0-1 years, 6-12 years of experience in the same current firm relative to 0-1 years and 13 or more years of experience in the same current firm relative to 0-1 years. Wages appear as gross wages in main occupation and it was used the consumer price index to convert in real terms. The 1st and 99th percentile of real
hourly wages in each year were trimmed.
10 Education is divided in three categories based on worker’s highest education level completed. Worker’s
observations without information on education were eliminated. Workers that completed technical courses are considered as having completed high school education. Experience is given by the number of working years at the same current firm (tenure). The fixed weights used to compute the weighted average of predicted log of real hourly wages for broader education or experience groups are still the mean employment shares of each skill group between 2004 and 2017. Employment share of each group in year 2017 was also considered as an alternative weight, demonstrating similar results to the ones presented.
28
Figure 11 depicts the evolution of the relative labor supply between workers with different levels of firm tenure. The relative labor supply follows two distinct trajectories: before 2013/2014, the number of senior workers at firms increased relative to new entrants (0-5 years of experience at the firm) and, in the last years, this ratio has been falling. This changing pattern suggest an increasing trend in recent years for higher worker rotativity, where the number of new workers at firms increased significantly relative to the number of firm seniors. The increase in the relative labor supply of more experienced workers was fundamental for the reduction of composition-adjusted premiums before 2013. Nevertheless, the demand for new or senior workers at firm level may also have played an important role, explaining the premium decrease after 2013.
Figure 11 – Evolution of relative labor supply of different experience levels in terms of tenure
Source: Computed using data from Quadros de Pessoal (QP)
Note: Figure presents relative supply between experience (tenure) groups from 2004 to 2017. Graph includes a
supply analysis of workers with 6-12 years relative to 0-5 years of experience in the same current firm and 13 or more years relative to 0-5 years of experience in the same current firm. Wages appear as gross wages in main occupation and it was used the consumer price index to convert in real terms.
This section also presents the results of a decomposition of the overall inequality in its between- and within-skill-groups components, quantifying the contribution of each component to changes on overall wage inequality.
29
Table 1 presents estimation results of equation 1 with the wage inequality decomposition. Columns 1, 3 and 5 present the total, between-skill-groups and within-skill-groups variance level with the respective share on total variance in columns 2, 4 and 6. Columns 7, 9 and 11 analyse the changes on total, between-skill-groups and within-skill-groups variances, having the percentage contribution to the change in columns 8, 10 and 12, respectively. Table 1 suggests that only around one third of the overall wage variance in each year occurs between skill groups. Within-skill-groups variance accounts for 72,7% of the observed reduction between 2009 and 2011, while between-skill-groups variance explains 56,7% of the continuous decrease and downward trend in wage inequality since 2013. Even though two thirds of total wage variance are explained by differences between workers with similar skills, differences across workers with distinct skills seems to play an important role for the latest reduction and downward trend on inequality. This pattern was not observed in similar studies for West Germany, where within-skill-groups variance played a more decisive role in inequality changes (e.g. Card, Heining and Kline 2013), or for Latin America, where the fall on inequality can be attributed to a major decrease in within-skill-groups variance (e.g. Messina and Silva 2019).
Table 1 – Variance of wages within and between skill groups
Variance component (1) Share of total variance (2) Variance component (3) Share of total variance (4) Variance component (5) Share of total variance (6) 2004 0,2771 100 0,0908 32,8 0,1863 67,2 2005 0,2846 100 0,0947 33,3 0,1899 66,7 2006 0,2827 100 0,0940 33,2 0,1887 66,8 2007 0,2861 100 0,0941 32,9 0,1920 67,1 2008 0,2813 100 0,0945 33,6 0,1869 66,4 2009 0,2812 100 0,0963 34,2 0,1849 65,8 2010 0,2677 100 0,0926 34,6 0,1752 65,4 2011 0,2603 100 0,0906 34,8 0,1697 65,2 2012 0,2594 100 0,0928 35,8 0,1666 64,2 2013 0,2645 100 0,0941 35,6 0,1704 64,4 2014 0,2578 100 0,0899 34,9 0,1679 65,1 2015 0,2529 100 0,0856 33,8 0,1673 66,2 2016 0,2393 100 0,0787 32,9 0,1606 67,1 2017 0,2259 100 0,0722 32,0 0,1537 68,0 Year
Total log of real hourly wage variance
Between-skill-groups variance
Within-skill-groups variance
30
Source: Computed using data from Quadros de Pessoal (QP)
Note: Tables present the decomposition of total variance of log real hourly wages in the variance between and
within skill groups in each year. Besides providing a decomposition of variance, tables also provide the percentage contribution of between- and within-skill-groups variance to the overall variance. The focus continues to be on gross wage’s inequality/variance among full-time dependent workers in the main occupation. Consumer price index is used to convert nominal wages in real terms. The 1st and 99th percentile of real hourly wages in each year
were trimmed.
Workers with similar skills can receive different earnings as they work in different occupations and at different sectors. Table 2 presents the estimation results of equation 2 with the wage inequality decomposition11. Columns 1, 3, 5, 7, and 9 present the variance/covariance levels of
each component, while columns 2, 4, 6, 8 and 10 present their respective share in total variance. Columns 11, 13, 15, 17, 19 display the changes on overall variance and on each of its components in levels, while their percentage contribution for the change on total variance is stated in columns 12, 14, 16, 18 and 20.
Table 2 suggests that, although around one fifth of the variance of log real hourly wages now occurs between sector-occupation groups, around one half continues to occur within skill and sector-occupation groups (residual component) and is not explained by differences across skills or sector-occupations. The positive covariance between skill and sector-occupation groups implies the existence of an association between highly paid skills, sectors and occupations. The residual component accounts for almost half of the observed reduction between 2010 and 2011 followed by the variance between sector-occupation groups explaining 27,6% of the decrease. Regarding the downward trend on overall wage variance from 2013 to 2017, variance between sector-occupations has a major importance, accounting for 30,4% of the decrease, followed by the residual component and the covariance between skill and sector-occupation groups each
11 The worker’s occupation and economic sector are classified according to the one-digit level classification of
CPP/2010 and CAE Rev.3, respectively (more details on the classification systems and a list of the different one-digit sectors and occupations provided in Appendix A1.2). The analysis of the variance and its decomposition are only done from 2010 to 2017, due to the impossibility of harmonizing different classifications of occupations prior and after 2010 at the one-digit level, and it was eliminated worker’s observations without job information.
Variance component (7) Share of total variance (8) Variance component (9) Share of total variance (10) Variance component (11) Share of total variance (12) 2004 - 2009 0,004 100 0,005 132,9 -0,001 -32,9 2009 - 2011 -0,021 100 -0,006 27,3 -0,015 72,7 2011 - 2013 0,004 100 0,004 84,4 0,001 15,6 2013 - 2017 -0,039 100 -0,022 56,7 -0,017 43,3 Year
Change on total log of real hourly wage variance
Change on between-skill-groups variance
Change on within-skill-groups variance
31
explaining around 26%. From this table, it is possible to conclude that even when sector-occupation information is included, there is still a significant amount of inequality occurring within skill and sector-occupation groups. Nevertheless, most wage inequality evolution can be explained by differences across skill and sector-occupation groups. For example, there is a significant contribution for inequality reduction in the past years from the decrease in wage differences between sector-occupations and the association between highly remunerated skills, sectors and occupations.
Table 2 – Variance of wages within and between skill groups and sector-occupation groups
Source: Computed using data from Quadros de Pessoal (QP)
Note: Tables present the decomposition of total variance of log real hourly wages, in each year, in the variance in
skill groups and sector-occupation groups, twice the covariance between the two previous terms and the variance of residual component (referred simply in the table as residual). Besides providing a decomposition of variance, tables also provide the percentage contribution of each component to the overall variance. The focus continues to be on gross wage’s inequality/variance among full-time dependent workers in the main occupation. Consumer price index is used to convert nominal wages in real terms. The 1st and 99th percentile of real hourly wages in each
year were trimmed. Variance component (1) Share of total variance (2) Variance component (3) Share of total variance (4) Variance component (5) Share of total variance (6) Covariance component (7) Share of total variance (8) Variance component (9) Share of total variance (10) 2010 0,2677 100 0,0325 12,2 0,0568 21,2 0,0419 15,7 0,1365 51,0 2011 0,2603 100 0,0316 12,1 0,0547 21,0 0,0412 15,8 0,1328 51,0 2012 0,2594 100 0,0318 12,3 0,0553 21,3 0,0423 16,3 0,1299 50,1 2013 0,2644 100 0,0317 12,0 0,0580 21,9 0,0427 16,2 0,1320 49,9 2014 0,2578 100 0,0307 11,9 0,0558 21,7 0,0406 15,7 0,1306 50,7 2015 0,2528 100 0,0295 11,7 0,0536 21,2 0,0383 15,1 0,1314 52,0 2016 0,2392 100 0,0273 11,4 0,0500 20,9 0,0353 14,7 0,1266 52,9 2017 0,2258 100 0,0252 11,2 0,0463 20,5 0,0325 14,4 0,1219 54,0 Residual Year
Total log of real hourly wages variance Variance in skill-groups Variance in sector-occupation 2* Cov(skill-groups, sector-occupation) Variance component (11) Share of total variance (12) Variance component (13) Share of total variance (14) Variance component (15) Share of total variance (16) Covariance component (17) Share of total variance (18) Variance component (19) Share of total variance (20) 2010 - 2011 -0,0074 100 -0,0009 12,6 -0,0021 27,6 -0,0007 10,0 -0,0037 49,8 2011 - 2013 0,0041 100 0,0001 1,9 0,0033 79,4 0,0016 38,2 -0,0008 -19,4 2013 - 2017 -0,0386 100 -0,0065 16,8 -0,0117 30,4 -0,0102 26,6 -0,0101 26,3 Year
Change on total log of real hourly wage
variance Change on variance in skill-groups Change on variance in sector-occupation Change on 2*Cov(skill-groups, sector-occupation) Change on residual component
32
4.3. Heterogeneity across workers and firms
The decomposition of total wage variances in each subperiod (2004-2009, 2009-2013 and 2013-2017) (equation 4) are presented in Figure 12 and with more detailed information on Table A2.3 in Appendix A2. Figure 12 shows that the variance of worker effects, associated with heterogeneity across workers, accounts for the majority of the variance of log real hourly wages in the three subperiods (between 60% and 70% of total variance), followed by firm effects that explain 22% to 28% of overall wage variance.
Regarding the variation of total wage variance and its components, two patterns emerge. First, in the two initial subperiods from 2004 to 2013, the combination of a decrease in the variance of firm effects and in the doubling of the covariance between worker and firm effects contributed to around 101% and 87% of the reduction on overall wage variance (mainly between 2009 and 2011), respectively. However, the observed decrease in inequality was smaller due to the countering effect of increased variance of worker effects. Thus, from 2004 to 2013, the reduction on heterogeneity across firm’s pay premiums to their workers and on the association between highly remunerated workers and high-paying firms surpassed the increase on heterogeneity across workers, leading to a decrease in wage inequality. Nevertheless, higher variance of worker fixed effects (heterogeneity across workers) contributed to a more stable trend of wage inequality until 2013, with only a mild reduction between 2009 and 2011, countering, for example, the effects of the reduction of education or experience (tenure) premiums documented above.
Second, in the last two subperiods from 2009 to 2017, there was a reduction in the variances of worker and firm effects that contributed to 86% and 47% of the observed decrease on total wage variance (especially after 2013 when the reduction of inequality was more pronounced), respectively. However, the opposite effect of the increase in the covariance between worker and firm effects led to a lower reduction in the overall variance. Thus, from 2009 to 2017, the reduction on heterogeneity across workers (from wage differences between fixed worker characteristics that are paid similarly across firms) and firms (from wage differences between employers related to firm’s pay premiums to their employees) surpassed the effect of increasing association between highly remunerated workers and high-paying firms. This allows a reduction of wage inequality and contributes to the downward trend verified after 2013. From the analysis of the entire period, the decreasing variance of firm effects was the main responsible for the observed decrease on overall variance between 2004 and 2017, accounting