The impact of the 2007-2008 financial
crisis and European Sovereign Debt
Crisis on firms’ capital structure: The
case of Portugal and Ireland
Master Final Work in the form of Dissertation presented to Universidade Católica Portuguesa to fulfill the requirements for the degree of Msc in Finance
by
Beatriz Guimarães Durães Ferreira
Católica Porto Business School June 2019
The impact of the 2007-2008 financial
crisis and European Sovereign Debt
Crisis on firms’ capital structure: The
case of Portugal and Ireland
Master Final Work in the form of Dissertation presented to Universidade Católica Portuguesa to fulfill the requirements for the degree of Msc in Finance
by
Beatriz Guimarães Durães Ferreira
under the supervision ofProfessor Ricardo Cunha
Católica Porto Business School June 2019
Acknowledgments
To my mother, Conceição, thank you for all your support, kind words of strength that helped me through the rough days. To my father, Luís, thanks for your constant knowledge share, for your help and availability at any time. Thank you for all your love. To my brother, Gonçalo, and to Luísa, thank you for your support and even from far away, thanks for always believing in me. I will be forever grateful.
To my boyfriend Mário, I would like to thank you for all the help, support and corrections. Thank you for the love you showed me every day. Thank you for staying with me through the most difficult times and motivating me to get this done in the best way.
To my grandmothers, great-aunts, aunts, uncles and cousins, thanks for always believing in me and for all your motivating and kind words.
I would like to thank my goddaughter, Filipa, and her siblings, Sofia, Miguel and Madalena for helping me relieve the stress during this phase. Also, thank you Rita and Nuno for all your kind words.
Also, I would like to thank my friends for being by my side, always offering their help and support. Thanks for never letting me give up and for always motivating me.
To you all, I dedicate this master thesis.
I would like to thank my co-workers in Vestas, both in Portugal and Denmark, for all the patience and time they had during this phase. Thanks for all your support and for having my back while I was handling this final step of my student life.
I would like to thank my supervisor Professor Ricardo Cunha for all the help and Professor Ricardo Ribeiro for all his help and knowledge shared regarding the econometric model and Stata issues.
Resumo
Este trabalho foi realizado com o objetivo de compreender o impacto que a crise financeira que começou nos Estados Unidos e a crise da dívida soberana na Europa tiveram na estrutura de capitais das empresas cotadas de Portugal e da Irlanda. Esta análise foi realizada para uma amostra de 18 anos dividida em três períodos diferentes: período pré-crise, período da crise nos Estados Unidos e o período da crise europeia.
Baseada na revisão de literatura, foi feita uma análise a diferentes determinantes que influenciam estrutura de capitais, nomeadamente: a Rentabilidade, a Dimensão, a Tangibilidade, as Oportunidades de Crescimento, Outros Benefícios Fiscais para além da Dívida, a Singularidade e a Taxa de Imposto. Esta análise permitiu perceber quais destes determinantes influenciaram a escolha de financiamento das empresas entre 2000 e 2017.
Os resultados da regressão mostraram que a estrutura de capitais das empresas portuguesas e irlandesas não foram tão afetadas assim por estes determinantes como seria de esperar pela literatura. Foi demonstrado que a Dimensão das empresas teve impacto no período de pré-crise (2000 a 2007) nos dois países e teve impacto nas empresas irlandesas no período da crise europeia (2011 a 2017). As Oportunidades de Crescimento das empresas portuguesas influenciaram a escolha de financiamento durante o período de crise da dívida soberana europeia. Empresas portuguesas com mais oportunidades de crescer escolheram ter menos dívida. A Rentabilidade, Singularidade e a Taxa de Imposto não tiveram nenhum impacto na escolha de financiamento das empresas tanto portuguesas como irlandesas ao longo dos 18 anos da amostra.
Palavras-chave: Estrutura de Capitais, Crise Financeira, Crise da Dívida Soberana Europeia, Portugal, Irlanda
Abstract
This thesis was made with the main goal of finding what was the impact that the financial crisis in the United States and the European Sovereign Debt Crisis had on the capital structure of the Portuguese and Irish listed firms. This analysis was conducted for an 18 years’ time sample, divided in three different periods: pre-crisis period, US financial crisis period and the period of the European Sovereign Debt Crisis.
After reviewing the literature, an analysis was made using different determinants that influence the capital structure: Profitability, Firm Size, Tangibility, Growth Opportunities, Non-debt Tax Shields, Uniqueness and Tax Rate. This analysis allowed to understand which of these variables would influence the financing decisions of Portuguese and Irish firms between 2000 and 2017.
The results show that the impact of these determinants was not as expected. We can infer that Firm Size had impact on the financing decision during the pre-crisis period (2000 to 2007) in both countries’ firms, plus it has impact on the Irish firms during the period of crisis in Europe (2011 to 2017). The Growth Opportunities of Portuguese companies influenced the financing decisions during the European Sovereign Debt Crisis period. Portuguese companies with more growth opportunities choose to have less leverage. Profitability, Uniqueness and Tax Rate had no significant impact on the listed firms’ capital structure in either the three periods for neither the two countries in study.
Keywords: Capital Structure, US Financial Crisis, European Sovereign Debt Crisis, Portugal, Ireland
Index of Contents
Acknowledgments ... v
Resumo ... vii
Abstract ... ix
Index of Contents ... xi
Index of Figures ... xii
Index of Tables ... xiii
Introduction ... 1
Chapter 1 - Capital Structure ... 5
1. Theories of Capital Structure ... 5
1.1.Traditional View and Irrelevance Theory ... 5
1.2.Trade-Off Theory ... 6
1.3.Pecking Order Theory and Asymmetry of Information ... 8
1.4.Agency Theory ... 10
2.Capital Structure Determinants... 11
2.1.Profitability ... 11
2.2.Firm Size ... 13
2.3.Tangibility – Nature of Assets ... 15
2.4.Growth Opportunities ... 16
2.5.Non-debt Tax Shields... 18
2.6.Uniqueness ... 19
2.7.Tax Rate... 19
Chapter 2 - Crisis and Capital Structure ... 21
1.The US Financial Crisis ... 21
2.European Sovereign Debt Crisis ... 23
3.Capital Structure and Financial Crisis – Empirical Evidence of determinants’ impact in capital structure ... 26
Chapter 3 - Methodology... 45 1.Sample ... 45 2.Econometric Model ... 46 3.Variables Description ... 47 Chapter 4 - Results ... 50 1.Preliminary Analysis ... 50 2.Regression Results ... 57 Conclusion ... 63 References ... 66 Appendix ... 72
xii
Index of Figures
Figure 1 - Population Graphs for Portugal and Ireland between 2000-2017... 33
Figure 2 - GDP graphs for Portugal and Ireland between 2000-2017 ... 34
Figure 3 - GDP Growth rate for Portugal and Ireland between 2000-2017 ... 35
Figure 4 - Public Debt for Portugal and Ireland 2000-2017 ... 36
Figure 5 - Unemployment Rate for Portugal and Ireland between 2000-2017 ... 37
Figure 6 - Tax Rate for Portugal and Ireland between 2000-2017 ... 38
Figure 7 - GDP Per Capita for Portugal and Ireland between 2000-2017 ... 39
Figure 8 - Corporate Tax Rate for Portugal and Ireland between 2000-2017 ... 40
Figure 9 - Productivity for Portugal and Ireland between 2000-2017 ... 41
Figure 10 - Bank Loans Tax Rate for Portugal and Ireland between 2000-2017 . 42 Figure 11 - Importations for Portugal and Ireland between 2000-2017 ... 43
Figure 12 - Exportations for Portugal and Ireland between 2000-2017... 44 Figure 13 - Graph with median Leverage presented by country and by period.56
Index of Tables
Table 1 - Proxies for Independent and Dependent Variables ... 49
Table 2 - Variables definitions of values... 51
Table 3 - Summary Statistics for independent and dependent variables ... 52
Table 4 - Regression results from the econometric model ... 58
Table 5 - Correlation within variables for Portugal during pre-crisis period ... 72
Table 6 - Correlation within variables for Ireland during pre-crisis period ... 72
Table 7 - Correlation within variables for Portugal during US financial crisis period... 72
Table 8 - Correlation within variables for Ireland during US financial crisis period... 73
Table 9 - Correlation within variables for Portugal during the European sovereign debt crisis period ... 73
Table 10 - Correlation within variables for Ireland during the European sovereign debt crisis ... 73
Introduction
Capital Structure is a long-studied concept by several authors and still today, there is not a correct answer as to the right way chosen by firms to finance themselves and their projects. This work presents a study with the objective of finding out the behavior of the Portuguese and Irish firms during the economic crisis period. That said, we look to answer to the following research question: “What was the impact of the US financial crisis and the European Sovereign Debt crisis in the Portuguese and Irish listed firms’ capital structure?”
Durand (1952) was the first author to discuss the capital structure theme, developing a traditional view in which he believed in the existence of an optimal capital structure which maximized firm value. Modigliani and Miller (1958) were the following to discuss it and are the authors of two propositions – Proposition I and II. Proposition I explains that in a market characterized by perfect conditions, companies in the same business would have the same value. Proposition II establishes a relationship between debt ratio and cost of equity. Later, in 1963, the same authors added corporate taxes to their model.
Trade-off and Pecking Order are both well-known theories among the choice of financing taken by firms. It is known that the Trade-Off theory defends that firms must have an optimal debt ratio; meanwhile the Pecking Order Theory establishes an order that firms must follow to raise external funds preferring internal over external financing and debt over equity [Myers (1984) and Myers and Majluf (1984)]. Jensen and Meckling (1976) also studied the capital
structure theme using the choices made by managers to fund new investments and elaborated the Agency Theory.
All who studied this theme seem to align that there are determinants that influence this choice within firms. The most common determinants are the ones studied in this thesis: Profitability, Firm Size, Tangibility, Growth Opportunities, Non-debt Tax Shields, Uniqueness and Tax Rate.
Profitability was found by most of the authors to have a negative relationship with debt, as firms that were more profitable had less debt [Ozkan (2001), Harris and Raviv (1991) and Rajan and Zingales (1995)], except by Frank and Goyal (2009) who established a positive relationship, more profits meant more usage of debt as they had lower bankruptcy costs.
Firm size was defended by the Trade-off theory to have a positive relationship with debt ratio, since larger and more diversified firms face lower risk of default, they had higher leverage ratio - Titman and Wessels (1988), Harris and Raviv (1991) and Rajan and Zingales (1995) agree with the theory findings.
As firm assets can be used as collateral on a bank loan, Frank and Goyal (2009) have also established a positive relationship within tangibility and leverage. Myers and Majluf (1984) defend the same relationship.
Between growth opportunities and leverage, Rajan and Zingales (1995) and Fama and French (2002), in accordance with the Trade-off theory, defend a negative relationship. Also, it is expected that firms with more unique products want to avoid bankruptcy, therefore avoiding having debt (Harris and Raviv, 1991).
Non-debt tax shields and Tax Rate have opposed expected relationships with leverage. Having more debt, firms can take advantage of tax shields that come within, the relationship of tax rate with leverage is positive (Kraus and Litzenberger, 1973).
This dissertation analyses listed firms from Portugal and Ireland. The firms chosen needed to have at least one year, of the eighteen analyzed, with a total assets’ value to make it into the sample. The choice of analyzing listed firms is justified by the fact that these are firms that can ask for external financing by issuing equity easier or by having better access to bank loans.
As we know, several countries in Europe were affected by the financial crisis that started in the United States and quickly turned out to be a global crisis. Consequently, Europe suffered with a subsequent crisis - the European Sovereign debt crisis. Between the five most affected countries – Portugal, Spain, Ireland, Italy and Cyprus – the choice of Portugal and Ireland among the others was made because both were intervened by European Union and by the International Monetary Fund, but achieving different results.
In order to answer the research question presented above, an econometric model was created, and the capital structure determinants mentioned above were used in this same model – even though some of the results found are not the ones expected by literature reading and analysis.
We were able to conclude that Profitability and Tax Rate had no influence on capital structure in either of the countries or any of the three different periods. On the other side, the Size of the firm was found has having some impact in the Irish listed firms during the European Sovereign debt crisis period. Another determinant that influenced capital structure was the Non-debt tax shields, as it is significant for Irish firms during the pre-crisis period and for Portuguese firms during the European sovereign debt crisis period. The rest of the determinants were not that significative to the model.
Following this introduction, Chapter 1 presents literature review with theories regarding capital structure and the description of the capital structure determinants. Chapter 2 presents the US Financial crisis, the European Sovereign Debt crisis and the economic environment of the two countries in
study; Chapter 3 is the Methodology chapter presenting the sample, econometric model and variables description; Chapter 4 develops the preliminary analysis of the data and the regression results. The conclusion closes the study.
5
Chapter 1
Capital Structure
Different theories are debated in Literature review in what concerns capital structure since the beginning of its discussion. Financial decisions as to new investments and the way to finance them are made by firms based on their capital structure. Theories from Durand (1952) and Modigliani and Miller (1958) – Propositions I and II - are presented aligned with corrected theories (Modigliani and Miller, 1963). The Trade-Off and Pecking Order Theories are also highlighted in this chapter, along with Asymmetry of Information and the Agency Theory.
1.
Theories of Capital Structure
1.1.
Traditional View and Irrelevance Theory
David Durand was the first to discuss capital structure, in 1952. Durand (1952) developed the traditional theory of capital structure where he believed in the existence of an optimal capital structure that maximized a firm’s value. He also proved that equity’s value should never be lower than debt’s value. To get the optimal capital structure, firms would tend to increase debt until the
weighted average cost of capital (WACC 1) was at its minimum. Otherwise, debt
would increase leading the firm to bankruptcy.
Modigliani and Miller (1958) are key authors in the capital structure subject, launching the idea of capital structure irrelevance. Two propositions were made, regarding capital structure, based on perfect market assumptions. These assumptions were: i) no transactions costs, ii) no bankruptcy costs, iii) no taxes, iv) inexistence of asymmetry of information, v) no agency costs, vi) full competition and vii) no arbitrage opportunities. In one hand, Proposition I is about the amount of debt in firm value. In perfect market conditions, firms in the same type of business would have the same value. On the other hand, Proposition II addresses the direct relationship between cost of equity and debt ratio. For the WACC to remain constant, debt and equity must increase accordingly.
In 1963, Modigliani and Miller corrected their 1958 model. As, in the real world, there are no perfect markets, the authors added corporate taxes to the model and found that firm value increases when leverage increases, due to tax deductibility of debt. Thus, capital structure now influences the firm’s value, meaning that the optimal capital structure is reached by maximizing the firm’s debt level.
1.2.
Trade-Off Theory
The Trade-Off Theory identifies an optimal financial leverage in the trade-off between benefits from debt and business risks. This theory was devised by Kraus and Litzenberger (1973), who argued that as interest tax shields are deductible, the firm will choose to finance itself using debt to profit from tax benefits. However, the firm must be able to pay its debt liabilities, or it will face
1 The WACC is a calculation of the firm’s cost of capital where the quantities of equity and debt are weighted
significant bankruptcy penalties. Optimal capital structure is determined by the level of debt that maximizes the firm’s value without taking the firm to bankruptcy – which clearly means that debt policy is not irrelevant to the capital structure.
This theory shows that the benefits of tax shields and costs associated to debt must be balanced to reach an optimal capital structure. It also implies an optimal ratio for firms and indicates a path to achieve it.
More profitable firms with more tangible assets have, according to the authors, higher debt ratios when compared to firms with no profits, with risky assets and more intangible assets. The authors also support the idea that debt is healthy since it increases tax-shields. However, it originates costs related to agency problems, known as agency costs, and it can lead to a possible situation of firm bankruptcy, adding bankruptcy costs to the equation. The probability of firm bankruptcy increases in the same proportion as indebtedness.
The Trade-Off Theory is discussed as dynamic and static. The dynamic Trade-Off theory gives importance to time, to future expectations and to transaction costs deriving from funding. This transaction costs join bankruptcy costs and tax-shields. The way to finance new investments depends on what is better for the firm in the future, since it will have to choose between distribution and raising of funds.
The static Trade-Off Theory got its first approach by Myers (1977) and then Bradley et. al (1984), and searches for an optimal capital structure resulting from market imperfections. Agency costs of financial distress and tax deductibility of debt finance - two market frictions - can generate an optimal capital structure (Chirinko and Singha, 2000). Firm’s optimal debt ratio is determined by a trade-off of the costs and benefits of borrowing, keeping constancy in the firms’ assets. There is the need to balance the value of interest tax-shields against the cost of bankruptcy or financial embarrassment. Firms
can substitute equity for debt and debt for equity up to the maximum firm’s value (Myers, 1984).
Myers (1984) advocated that when the firm’s debt increases, so does risk, but this is balanced by debt tax-shields. He also argues that firms increase their debt levels until the point where the benefits of indebting equal the possible bankruptcy and agency costs (Myers, 2001).
Fama and French (2002) discussed the benefits and costs of debt. The benefits are the tax deductibility of interest and the reduction of free cash flow (FCF) problems - given that, by issuing debt, the firm is committed to pay debtholders and has less cash available for managers to use in perquisites, reducing available FCF. Costs include potential bankruptcy costs and potential agency conflicts between stockholders and bondholders. The authors argue that the balance between costs and benefits of debt leads to an optimal capital structure – at leverage optimum, the benefit of the last dollar of debt offsets the cost. It is possible to achieve an optimal capital structure by balancing debt’s costs – bankruptcy and agency costs – with debt’s benefits – tax deductibility of interests and reduction of free cash flow problem. Potential bankruptcy costs decrease firms’ target leverage and agency costs of free cash flow increases firms’ target leverage (Fama and French, 2002).
1.3.
Pecking Order Theory and Asymmetry of
Information
The Pecking Order Theory, developed by Myers (1984) and Myers and Majluf (1984), suggests several different sources of financing so that firms can choose depending on each source’s costs. The fundamental friction of this theory is the information asymmetry between managers and less-informed third-party investors. Within this theory, there is no optimal target for debt-to-equity ratio and, consequently, there is no optimal capital structure. The theory
defends that the firm reaches its maximum value because of the decision-making process, considering financing choices. Myers (1984) refers a hierarchy where firms prefer internal financing and adapt their target dividend payout ratio to their investment opportunities. If the need to raise external funds arises, firms must issue safe securities first, then issue hybrid securities (such as convertible bonds), and, as a last resort, issue equity bonds. According to internal resources of each firm, its capital structure and indebtedness level will be different between firms. Myers (1984) and Myers and Majluf (1984) claim that firms follow this hierarchy of preference of internal over external and debt over equity, due to asymmetric information and problem identification associated with the choice of external funds.
Shyam-Sunder and Myers (1999) state that “the strong performance of the pecking order does not occur just because firms fund unanticipated cash needs with debt in the short-run”. Their empirical results show that firms plan to finance anticipated deficits with debt. When a firm’s internal cash flows are unsuitable for its investment and dividend commitments, the firm issues debt. These authors tested the Pecking Order theory against the Trade-Off theory resulting that the first has more statistical power than the last.
The capital structure is also influenced by the information asymmetry that occurs mostly between managers and shareholders. Managers have a deeper knowledge of the firm than shareholders, and the last ones tend to be misinformed about the business and the market, about the current situation of the firm and about the business risks. Myers and Majluf (1984) studies showed that, if investors are less informed than actual firm insiders on firm’s assets value, then equity may be mispriced by the market. In consequence and, seldomly, the firm may even consider passing a positive Net Present Value2
(NPV) project if this project needs financing from equity issue. The
2 Net Present Value – used in investments budgeting, it is the difference between value of present cash inflows
and the present value of cash outflows. For example, a positive NPV project means that the future earnings of the investment are higher than its costs.
underpricing of equity may be so severe that new investors, the ones that buy new equity shares issued, may capture more than the new project NPV, which results in a net loss to existing shareholders (Myers, 1984 and Myers and Majluf, 1984 cit in Harris and Raviv, 1991).
In this theory’s simple approach, debt typically grows when investment exceeds retained earnings and reduces when investment is inferior to retained earnings (Fama and French, 2002).
1.4.
Agency Theory
Jensen and Meckling (1976) referred that the agency relationship was one that joined two agents under a contract – where one or more individuals, known as principal, employ someone, the agent, to whom they shall delegate the power for decision-making purpose (Silva and Pinto, 2018). It can exist between a manager and a shareholder or an equity holder and a debt holder.
Given that the manager has its own goal when managing the firm, there is always a conflict of interest. What the manager wants is not necessarily the same the shareholder seeks - their goals might be different. The manager wishes to maximize the firm’s profit without considering the shareholders’ interests; and shareholders want the manager to pay out cash and not investing it. Free cash flow is costly because of this conflict between managers and shareholders. On the one hand, managers wish to retain cash-flows to invest them in projects that will enhance their reputation, power, and compensation. On the other hand, shareholders want managers to pay out cash-flows as dividends, because the projects mentioned above have a negative NPV (Heaton, 2002). The attempt of diminishing these conflicts generates agency costs.
Managers hold less than 100% of the residual claim, meaning that if the firm performs well they earn part of the profit and can consume the perquisites. If the firm performs badly and they do not make any effort to manage it, they will
bear 100% of the costs. As a result, managers tend to waste free cash-flow - excess cash - on perquisites, benefiting themselves. This inefficiency and conflict of interests, and consequent agency costs, can be reduced by increasing the equity fraction owned by the manager. The bigger this fraction, the more effort the manager will engage in managing the firm, since he will want the firm and its shares to hold the highest possible value. Plus, when the firm issues debt it makes the commitment of paying out cash to creditors. Dividends also help to control this problem and reduce this agency costs by forcing managers to pay out more of firm’s excess cash instead of wasting it on personal benefits (Jensen and Meckling (1976), Easterbrook (1984) and Jensen (1986)). This will reduce the excess cash for managers self-use, in the perquisites. It can be concluded that one of the benefits of issuing debt is the reduction of conflict of interests.
2.
Capital Structure Determinants
In this chapter, as shown relevant in the literature, we present the capital structure determinants that will be essential for the development of this thesis. We included Profitability, Firm Size, Tangibility – Nature of Assets, Growth Opportunities, Non-debt Tax Shields, Uniqueness and Tax Rate.
2.1.
Profitability
Profitability allows the researchers to evaluate if the firm resources are being used efficiently and intends to measure the ability of the firm to generate profits. It can be defined as the entity’s gains as opposed to the entity’s value.
Frank and Goyal (2009) defended that profitable firms were the ones with lower bankruptcy costs and, thus, more ability for debt use. Furthermore, these types of firms place more relevance in tax-shields.
As per the Trade-Off theory, there should be a positive relationship between leverage and profitability.
Ozkan (2001) defends a negative relationship between profitability and leverage referring that it is explained by the Pecking Order theory. This theory refers that more profitable firms tend to resort less to debt. This happens because, as they follow possible sources of financing hierarchy, they choose internal funds’ finance first. When firms choose to use internal funds, this means that the amount of external funds is small, and consequently the amount of leverage is also small. Moreover, firms with higher levels of profitability tend to easily generate funds - meaning that these firms can finance themselves effortlessly - having a lower level of indebtedness. According to this theory, there is a negative relationship between profitability and leverage.
Some authors, like Rajan and Zingales (1995) and Harris and Raviv (1991) establish that profitability and leverage are negatively correlated.
Titman and Wessels (1988) also believe in a negative relationship. They indicate that more profitable firms have better access to debt than less profitable firms. However, the latter reach more for debt because they tend to have more important financial problems.
According to Jensen and Meckling (1976), Easterbrook (1984) and Jensen (1986), firms with more assets in place use a bigger fraction of their pre-earnings interest to pay debt and dividends, controlling agency costs derived from the free cash-flow. Controlling for investment opportunities, the dividend payout and leverage are positively correlated with profitability (Fama and French, 2002).
Jensen (1986) argues that in the event of a financial crisis, more profitable firms are the ones that have less difficulties in supporting possible costs that might arise from the crisis because of cash-flow availability.
As per all the above-established relationships, we present here the hypothesis that it is expected a negative relationship between leverage and profitability.
In 2007/2008, the US government stated in report3 from 2012 that the GDP of
the United States declined deeply. A low GDP means less expenditures and less consumption, leading to firms selling less, having lower profitability. Also, as the stock market reacted to the financial crisis, the stock’s prices declined. And, since the stock market is related to the profitability of a firm – firms have an incentive to present profits if they exist so that their shares become more attractive to investors (Lazaridis and Tryfonidis, 2006) - a decline in the stock market reflects a decline in profitability. The level of profitability gives investors a greater certainty as to the firm they want to invest in. In times of crisis, profitability is even more important because investors will put their money on firms that they believe will not default their payments.
2.2.
Firm Size
The Pecking Order Theory defends that size is one of the factors that gives exposure and visibility to the firm in financial markets, next to investors and creditors, diminishing the possibility of information asymmetry. Since small firms have to pay more to issue equity and have less access or a not so easy access to external funds, these firms will use more of their internal funds, reflecting a positive correlation between firm size and leverage (Silva and Pinto, 2018).
Defenders of the Trade-Off Theory also find evidence that size and leverage are positively correlated. Frank and Goyal (2009), for example, state that large and more diversified firms face lower default risk, and older firms with better reputation in the debt market face lower debt-related agency costs – leading to the same conclusion as the theory – larger and more mature firms have more debt. This occurs because bigger firms are more diversified and have more stable cash-flows. Their bankruptcy costs are smaller relatively to the firm value and they have easier access to credit from financial institutions with low interest rates, once their level of default is lower and their negotiating power is higher.
Rajan and Zingales (1995), Titman and Wessels (1988) and Harris and Raviv (1991) agree with the Trade-Off Theory, referring that it is expected that bigger firms are more diversified, and consequently less likely to fail and bankrupt, which means they can borrow more, increasing the debt levels.
Jensen and Meckling (1976) allege that the Agency Theory also indicates a positive relation between size and leverage. This happens because they believe that large firms are more complex and less transparent, bearing more agency costs, than small firms - which are easier to monitor. In a large firm, the monitoring of managers would increase monitor and bonding costs. A possible and feasible solution to avoid all these costs is to issue debt, as when a firm issues debt, managers are controlled by third-parties (Ibrahimo and Barros, 2009). There is another indication that the relationship between size and leverage is positive, as bigger firms decide to borrow more to control managers’ behavior.
For the purpose of this thesis, it is expected a positive correlation between firm size and leverage, as it was encountered in Titman and Wessels (1988), Harris and Raviv (1991) and Rajan and Zingales’ (1995) researches.
Berg and Kirschenman (2010) believed that financial crisis had impact on firms as to their sizes. Credit availability depends on the firm’s size, therefore
when banks suffered the lack of equity during the financial crisis, they had less credit and paid more attention to firms to which they would issue loans. They would prefer larger firms to ensure that they would receive their money back.
2.3.
Tangibility – Nature of Assets
Tangible assets are easier to quantify and easily valued by third-parties leading to less information asymmetry, meaning less financial distress (Frank and Goyal, 2009). In case of the firm’s liquidation or bankruptcy, tangible assets can be given or sold to creditors to reduce bankruptcy costs. Also, tangible assets can be used as collateral on a loan; they can be given as a guarantee that the firm will pay the loan. Hence, the relationship established between tangibility and leverage is positive.
Myers and Majluf (1984) assert that less tangible firms have more problems of information asymmetry and cannot give guarantees to its creditors. Therefore, creditors are more willing to grant credit to firms with more tangible assets as they can give those assets as collateral. Firms with more tangible assets resort more to debt, since they can give assets as assurance, and profit from this opportunity. The relationship between tangibility and leverage is positive. Titman and Wessels (1988) agree with Myers and Majluf (1984) since they claim that debt is easily reached by firms with more tangible assets because this type of firms have less agency problems – also showing that the relationship is positive.
The Trade-Off theory reaches the same conclusion as the authors mentioned above.
Frank and Goyal (2009) show that, as to tangibility, the Pecking Order theory reveals an ambiguity issue. When a firm faces low information asymmetry associated to its tangible assets, it tends to issue equity, because it is less costly –
meaning that a firm with more tangible assets should have inferior debt levels (inverse relationship). However, tangibility increases the adverse selection4
about assets in place resulting in a higher leverage level.
Due to the convergence of opinions, the hypothesis presented is a positive relationship between tangibility and leverage is expected in this paper.
With the 2007-2008 financial crisis, the banks suffered the lack of liquidity already mentioned above. This meant that banks would require more security when issuing a loan for a firm (Berg and Kirschenman, 2010). Besides, investors prefer to invest in a firm that has assets to use as collateral in case something goes wrong. In times of crisis, tangibility is an important aspect.
2.4.
Growth Opportunities
The Trade-Off model predicts that, when controlling the profitability of assets in place, firms with more investments have less leverage. This happens for two reasons (Fama and French, 2002):
(1) This type of firms has more incentives to avoid underinvestment and asset substitution inefficiencies that can arise from stockholder – bondholder problems;
(2) Firms have less needs for discipline of debt payments to control free cash-flow problems.
It can be concluded that there is an inverse relationship between growth and leverage, given the above explanations and having in consideration that firms with more growth opportunities tend to preserve their debt capacity to future
4 Adverse selection, in the market place, generally refers to a situation where the sellers of financial products
have information that the buyers do not have. For example, a firm’s manager may be more willing to issue shares knowing that they are overvalued as to their real value. This may lead the investor to buy overvalued shares, losing money.
moments, giving priority to internal funds and choosing them in the present as source of financing their investments.
Frank and Goyal (2009) defend that growth reduces free cash-flow problems, increases costs associated to financial difficulties and aggravates agency problems related to debt.
Frank and Goyal (2009) and Rajan and Zingales (1995) reached the conclusion that there is an inverse relationship between leverage and growth opportunities.
Due to information asymmetry, firms with higher leverage levels tend to miss investment opportunities. Firms with more growth opportunities tend to have lower levels of leverage (Miller, 1977). This means there is a negative relationship between growth opportunities and leverage.
Empirical research of Titman and Wessels (1988) indicate a negative relationship between growth and leverage. Growing firms have more flexibility to choose in which project to invest and, according to the Pecking Order theory, they choose first to finance with internal funds. This means that growing firms present lower leverage levels.
The agency theory also concludes about this variable. Managers have more freedom to choose how to finance future investments and their choice will be the one that maximizes their utility (Titman and Wessels, 1988). To control managers’ behavior, the firm may issue debt, and, in this case, monitoring is done by outsiders. According to this theory, there is a positive relationship between growth opportunities and leverage.
In agreement with the agency theory and contradicting the rest of opinions, Jensen and Meckling (1976) suggest that there is a positive relationship between leverage and growth opportunities. Firms with less investment opportunities tend to rely less in debt than firms with more growth opportunities. This occurs because if a firm does not have enough internal funds to seize the investment
opportunity, it should use debt as defended by the Pecking Order theory (Silva and Pinto, 2018).
In this thesis, and because it is the prevailing opinion amongst authors, an inverse relationship between leverage and growth opportunities is the foreseen hypothesis.
There is less or no growth for several quarters during the financial crisis period (Baily and Elliott, 2009) due to the decline of economy.
2.5.
Non-debt Tax Shields
DeAngelo and Masulis (1980) show in their article that Miller’s irrelevancy theorem is sensitive to realistic and simple modification in the corporate tax code. The existence of non-debt corporate tax shields such as depreciation deductions or investment tax credits is enough to overturn the leverage irrelevancy theorem. With bankruptcy, agency, or other costs, each firm will have its optimal capital structure whether there are non-debt shields available. Since tax deductions for depreciation, investments or R&D expenses are alternatives for debt tax shields, firms will select a level of debt negatively correlated to the level of available tax shield substitutes for debt (DeAngelo and Masulis, 1980), meaning an inverse relationship.
Bradley et. al (1984) reached a contrary relationship between NDTS and leverage, even though he hoped to reach the same conclusions as DeAngelo and Masulis (1980).
Titman and Wessels (1988) cannot find evidence to support the relation between leverage and non-debt tax shields as they mentioned that this attribute is difficult to measure.
2.6.
Uniqueness
According to Harris and Raviv (1991) firms with more specialized, unique products usually impose higher costs to its customers, suppliers, and workers in case of bankruptcy. This happens because customers will find it harder to acquire a similar product, suppliers of a specific component are now losing a client, and workers with specific skills will have difficulty in finding a new job. Firms with unique industries with more specialized labor will incur in high financial distress costs and consequently less debt (Frank and Goyal, 2009). Since costs imposed on customers when a producer goes bankrupt are higher when the production is unique, these types of firms are expected to have less leverage. The same findings are supported by Titman and Wessels’ (1988) study, stating that in case of a bankruptcy it will be harder for customers to find an alternative product. As the probability of bankruptcy increases with the level of leverage (Harris and Raviv, 1991), it expected that firms with unique products will have less leverage to protect themselves from going bankrupt.
2.7.
Tax Rate
In 1958 Modigliani and Miller’s first proposition affirmed that capital structure of a firm was not affected by taxes. However, this premise was changed by the same authors in 1963, when, in their second proposition, they introduced the tax effect, concluding that taxes really had an impact – the value of the firm increases with tax benefits brought by leverage.
Kraus and Litzenberger (1973) expect a positive relationship between tax rate and leverage since firms know that they can obtain more tax benefits from debt by increasing its level.
Frank and Goyal (2009) defend that high tax rates increase interest tax benefits of debt. The Trade-Off theory predicts that to take advantage of higher interest tax shields, firms will issue more debt when tax rates are higher.
Chapter 2
Crisis and Capital Structure
1. The US Financial Crisis
The critical year of the financial crisis was 2008 even though it started a few years back. Starting in the beginning of the century, in 2001, the tech bubble came to an end resulting in a long period of low interest rates (Goodhart, 2008). With these low interest rates, the banks started to sell new loans, known now as subprime mortgages, to higher default probability customers – either individual or firms (Bernanke, Gertler and Gilchrist, 1996).
By August 2007, the Federal Reserve System decided to increase interest rates, hampering loan pay-back plus interest. These were the mortgage loans which had as collateral the client’s houses instead of cash (Kalse, 2008). For this reason, housing pricing started to decline and, as a consequence, collateral assets were not valuable anymore, starting the housing bust (Taylor, 2009). Banks had no certainty at all that they would get back the loans and presented a lack of liquidity (Berg and Kirschenman, 2010). Since banks had this lack of cash-flow, they depended on Central Banks and third-parties to help them get out of the liquidity crisis (Goodhart, 2008). This was one of the reasons that transformed this crisis in an international and world-spread crisis, affecting other firms.
There were other factors that contributed to the escalation of the financial crisis - the work of rating agencies and the lack of transparency. The above referred loans, subprime mortgages, were new to the market meaning that it was difficult for rating agencies to assess the risk associated thereto (Calomiris, 2008). Besides, a new product was created, Collateralized Debt Obligations (CDO). These structured financial products were determined to take in consideration all the resources from a firm or individual with any value, like corporate loans or mortgages. Such values were then rearranged into the form of bonds and resold to investors. However, the risk of packages, the CDOs, was difficult to measure because they were also new to the financial market. Thus, rating agencies tended to qualify CDOs with high quality ratings, indicating a high reliability of the new financial instrument. The problem was that CDOs presented high risk, and their quality rating should be lower (Calomiris, 2008). Managers knew about this mistake and sold CDOs anyway, not giving this information to investors (Calomiris, 2008).
Since managers had more information than investors, a problem of information asymmetry arose resulting on a lending reduction. Furthermore, the parties that lent money to each other were less willing to continue, which caused a decline in trust and consequently in liquidity (Calomiris, 2008).
The beginning date of the financial crisis is still debatable. It might have started in the Summer of 2007 when the housing bust took place (Taylor, 2009). Or, maybe it started when the market downgraded the rating of the CDOs, in 2007, and investors stopped buying them, because they were worthless. Also, in 2007, banks noticed that most of the loans they made were not going to get payed back; there was an increase in the number of defaulted payments (Kalse, 2008). In 2008, took place the famous episode of Lehman Brothers’ bankruptcy that caused the extreme decline of the NYSE in September 2008, since they were one of the largest investment banks in the United States of America (McDonald, 2016).
For the purpose of this master thesis, the date of September 15th, 2008 is the chosen one for the beginning of the financial crisis. From January 1st, 2000 until that day of September 14th, 2008 we considered the pre-crisis period.
2. European Sovereign Debt Crisis
The European Sovereign Debt Crisis started in 2009 and peaked in 2010 until 2012. Countries from the Euro Zone had difficulties in paying or refinancing their debt without the help of third-parties.
This European Debt crisis was rooted, with high probability, on the financial crisis of 2007, when the European Central Bank (ECB) started the liquidity operations (Honohan et al., 2010) and in 2008 when one of the largest investment banks, Lehman Brothers, immersed the whole financial system in a global crisis. The European banks were highly exposed to the losses in assets-backed securities in the United States market (Lane, 2012). In the beginning of 2009, this crisis hit Europe as stronger as it reached the United States, following the real-estate market crisis and property bubbles.
The most shocking news originated in Greece (Ardagna and Caselli, 2012), in 2009, when the Greek government revealed that the previous government had grossly reported its budget deficit - it misreported the government budget data. Four countries joined Greece in this crisis: Portugal, Spain, Ireland, and Cyprus.
All were unable to repay their government debt. The five countries needed help from financial institutions, like ECB, the International Monetary Fund (IMF) and the European Financial Strategy Stability fund, to avoid payments’ default (Silva and Pinto, 2018).
In the 2003-2007 period, the credit boom was not primarily due to government borrowing. For Ireland, the primary borrowers were households,
fueling debt accumulation in this country. The Irish government was not a net borrower during this period. In Ireland, credit and housing booms directly generated extra tax revenues, driving up assets’ prices, construction activity, and capital inflows boosted the take from capital gains taxes, asset transaction taxes and expenditure taxes (Lane, 2012). Ireland was the most impressive example. Due to Ireland’s banking system high dependence on international short-term funding, this encouraged the government to provide an extensive two-year liability guarantee to its banks at the end of September 2008 (Honohan et al., 2010; Lane, 2011). In Portugal, the most significant borrowers were both the government and firms, and these negative flows were in part offset by significant net accumulation of financial assets by the household sector of the country (Lane, 2012).
The end of the credit boom was especially problematic for Ireland, since the construction sectors had grown rapidly. The decline in the construction business was a major shock to the Irish economic activity and the decline in property prices resulted in severe losses for the Irish banking system (Lane, 2011). Furthermore, abandoned and falling projects indicated large prospective losses for banks that had done too many property-backed loans (Lane, 2012).
Between Ireland and Portugal, the first country to be shut-out of the bond market was Ireland, in November 2010, simultaneously with the bailout request. Portugal was the third country5 (Pereira and Wemans, 2015) to be
shut-out of the bond market in April 2011, requesting bailshut-out one month later, in May 2011 (Lane, 2012).
In each of the bailouts performed by Euro-area governments and IMF (Ardagna and Caselli, 2012), there were established joint European Union/International Monetary Fund (EU/IMF) programs under which a three year funding would be provided under the condition that countries who received it had to implement fiscal austerity packages and structural reforms to
boost country’s growth - especially in Portugal – and recapitalized and deleveraged overextended baking systems – especially important in Ireland. The amount needed and required exceeded the IMF normal levels of lending money and so, the European Union was one bigger provider for the fund. It was also established a temporary European Financial Stability Facility that could issue bonds based on guarantees from the member states to provide official funding in any future crises (Lane, 2012).
Details of the funding plans for both Portugal and Ireland largely copied standard IMF practices; however, they faced some problems (Lane, 2012):
- The plausible time-scale for macroeconomic adjustment was longer than previously established three years, due to the scale of macroeconomic, financial, and fiscal imbalances. However, by June 2011, it was likely that Ireland and Portugal would not be able to obtain full market funding after the expiry of the, at the time, current deals.
- Falls in output production and a rise in taxes diminished households’ disposable income and corporate profits. This increased the private sector default risk. In Ireland, this was identified as an especially strong risk, in view of the scale of household debt.
- The bailout funds were used to recapitalize banking systems apart from covering the “regular” fiscal deficits. This was important in the Irish bailout and it was also present in the Portuguese one.
According to Acharya, Drechsler, and Schnabl (2010), the recapitalization of troubled banks can ameliorate a banking crisis, but if it raises public debt and sovereign risk to an excessive level it is a problematic strategy.
Since mid-2012, funds provided by the European Financial Stability Facility were only enough to address Greece, Ireland, and Portugal’s bailouts, and not enough to offer support to Spain and/or Italy (Lane, 2012).
For the purpose of this master thesis the period of the European sovereign debt crisis is considered to go from April 24th, 2010 until the end of the sample, December 31st, 2017.
3.
Capital Structure and Financial Crisis – Empirical
Evidence of determinants’ impact in capital structure
There is prior research done in this area of capital structure determinants and its influence in the choice of the leverage level.Rajan and Zingales (1995) investigated seven developed countries, named in the paper as G-76, and concluded that the correlation between leverage and its
determinants – like firm’s size and profitability – were fairly similar across the sample (Bancel and Mittoo, 2004). The authors also found that even though the firm-specific determinants influence the capital structure choice, it is also influenced by country-specific factors.
Demirüç-Kunt and Maksimovic (1999) compared capital structure from nineteen developed countries and eleven developing countries concluding that the portion of long-term debt used was different between developed and developing countries.
Graham and Harvey (2001) found moderate support that firms follow the Trade-Off Theory and target their debt ratio but also found support for the Pecking Order Theory. Results of this study show that firms’ value financial flexibility, but its importance is not related to information asymmetry or growth opportunities, as predicted by the Pecking Order Theory. Regarding agency costs, signaling, asset substitution, free cash-flow and product market concerns, little evidence was found by the authors that all these factors have influence in the capital structure choice (Bancel and Mittoo, 2004).
The Graham and Harvey (2001) and Bancel and Mittoo’s (2004) studies showed evidence that financing policies and management behavior were influenced by institutional environment and international operations when studying developed economies like the U.S. and European (De Jong, Kabir and Nguyen, 2007).
By studying firms’ capital structure from developed and developing countries, Booth et al. (2001) found that they were affected by the same firm-specific factors. However, it was also found that country-firm-specific factors such as GDP growth and capital market development also affected the leverage chosen level (De Jong, Kabir and Nguyen, 2007). The same study allowed observing that the capital structure of firms is usually explained by variables that arise out of static Trade-Off Theory, agency, and information asymmetry considerations (Bancel and Mitto, 2004).
Among several prior studies on international capital structures [see for e.g. Booth et al. (2001), Fan et al. (2012)] there is the assumption that the impact of firm-specific factors is the same irrespective of the country. However, it is acknowledged that the impact of these firm-level determinants varies in terms of signs, magnitudes, and significance levels (De Jong, Kabir and Nguyen, 2007).
The French, German and British firms were already object of study by Antoniou, Guney and Paudyal (2002) regarding the determinants of capital structure – firm-specific. They investigated the leverage ratios of firms within these three countries with different financial systems and traditions that have influence in the way that firms choose their capital structure. As expected by the authors, the effects of the determinants in the study were country-specific. These country-specific factors play an important role on how quickly firms need to adjust their debt-equity position to achieve their optimal leverage level. They concluded that capital structure does not only depend on firm’s own
characteristics but also depends on the environment where the firm is involved and the traditions with which it operates.
In a study about capital structure determinants focused on cross-country comparisons of managerial behavior using a sample of sixteen countries, Bancel and Mittoo (2004) found that there are several consistencies with the Trade-Off Theory since firm managers’ care about tax deductibility of interest, volatility earnings and the potential bankruptcy costs. Also, most of the managers in the survey tried to minimize WACC, others admitted they issue debt when interest rates are low or when firm’s equity is undervalued – suggesting that managers use opportunity windows to raise capital. The results show that most firms determine their capital structure by trading-off factors like tax advantages of debt or bankruptcy costs, agency costs and accessibility to external financing (Bancel and Mittoo, 2004). Consistent with the Trade-Off Theory, managers reveal that there is target debt ratio to achieve. Contrary to the Pecking Order Theory, managers answered the survey saying that when there are insufficient profits to finance new investments, they tend to issue equity (Bancel and Mittoo, 2004). Strengthening evidence from Porta, Lopez-de-Silanes, Shleifer and Vishny (1998), related debt factors are more influenced by the country’s institutional structure, especially the quality of its legal system (Bancel and Mittoo, 2004).
De Jong, Kabir and Nguyen (2007) analyzed firm size, asset tangibility, profitability, firm risk and growth opportunities as leverage determinants, finding that the impact of these factors was strong and consistent with capital structure theories. Even though theories of capital structure use US listed firms as role model, the authors find that it works well in similar economies with developed legal environment and high level of economic development. They find that in countries with a better law enforcement system and a healthier economy, firms are not likely to take more debt, but the effects of some
firm-level determinants of leverage such as growth opportunities, profitability, and liquidity are reinforced.
In addition to the sole study of capital structure determinants, several authors wanted to see their influence in capital structure choice in three different periods: before, during and after the 2008 financial crisis in the US.
The 2008 financial crisis gives the opportunity to see how a financial shock impacts on firms’ capital structure (Harrison and Widjaja, 2014). Knowing that there is a possibility of a rare and random economic crisis, firms are more conservative about their financial policy (Bhamra, Kuehn, and Strebulaev, 2010). Also, for financially distressed firms, the velocity of adjustment of their capital structure is low (Ariff, Taufiq, and Shamsher, 2008).
Campello et al. (2010) surveyed 1050 CFOs from firms in the US, Europe, and Asia to assess whether their firms were credit restrained during the financial crisis, in 2008. They conclude that constrained firms planned deeper cuts in tech spending, marketing, employment, and capital spending. Also, these firms had to resort to their savings and had to sell assets to fund new investment opportunities. In fact, numerous firms had to pass attractive investment opportunities due to borrowing incapability. Campello et al. (2010) also reached the conclusion that during the financial crisis, growth opportunities for many firms were affected negatively since it became harder to acquire external funding.
Proença, Laureano and Laureano (2014) investigated capital structure determinants using Portuguese SMEs and examined the effects of the financial crisis of 2008 on the capital structure of the same firms. Liquidity, asset structure and profitability were considered the most important determinants since they were the ones with more impact. The negative relationship established between debt ratios and profitability suggests that Portuguese SMEs have a preference for financing their investment opportunities with internal funds rather than using external financing – which is in line with the
Pecking Order Theory. In parallel with the Trade-Off Theory, the authors reached the conclusion that firms with high levels of tangible assets are expected to issue more debt because this kind of assets can be used as collateral in case of firm bankruptcy.
Iqbal and Kume (2014) examined the impact of financial crisis on the capital structure of listed, non-financial and non-utility firms from the United Kingdom, France, and Germany. They used as determinants tangibility, firm size, market value to book value, growth opportunities and business risk among others. Results from this study showed that leverage ratio increased from pre-crisis (2006-2007) to crisis period (2008-2009) and decreased post-crisis (2010-2011). As to debt and equity, both their levels changed during the crisis and post-crisis years.
Harrison and Widjaja (2014) did a comparative study of capital structure between two periods: before and after the financial crisis of 2008. Their sample is constituted by non-financial and non-utility firms listed in the US SandP 500 index. The determinants studied are tangibility, profitability, size, market to book ratio and liquidity. Results show that the coefficient of tangibility and market-to-book ratio have a stronger influence in capital structure choice during the 2008 financial crisis than prior to 2008. Also, profitability coefficient seems to have less influence in capital structure choice before the crisis. Firm size coefficient has changed signs, being positive before and negative in the crisis period. Firm size’s coefficient decreases drastically between 2004-2007 – the pre-crisis period – and 2008-2011 - the post-crisis period. Harrison and Widjaja (2014) argue that the justification for this last coefficient is that lenders might have looked for lower adverse selection during financial crisis.
4.
Economic crisis in Portugal and Ireland
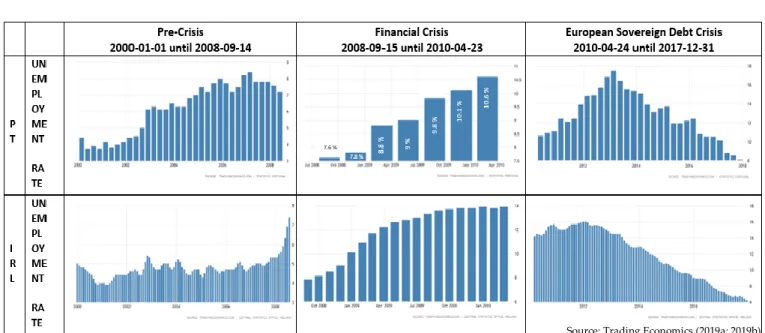
In order to reach some conclusions regarding firms’ performance, we should first understand the economic situation of the countries where these firms are established, Portugal and Ireland. For the purpose of comprehension, a discussion of the following macroeconomic factors is presented: Population, Gross Domestic Product (GDP), GDP Growth Rate, Public Debt, Unemployment Rate, Tax Rate, GDP Per Capita, Company Tax Rate, Productivity, Bank Loans Tax Rate, Imports and Exports.
From 2000 onwards, Portugal’s economy has slow growth, a rising current amount deficit and indebtedness as main characteristics. It is known that for crisis recovery, the government had to instore austerity measures as agreed with the European Council. This happened in March 2010 when the Stability and Growth Program was adopted. As this austerity package was not enough, two more followed in May and in October of the same year.
The Portuguese government negotiated with troika7 the Memorandum of
Understanding where austerity and adjustment rules or policies were established to reduce government indebtedness, deficit and rebalance the accounts by cutting on people’s wages (Caldas, 2012).
The reduction of the government deficit was made through increases in tax and cuts in spending. For example, some of the main taxes that were risen are employees’ contributions to public pension funds and increasing income tax rates, among others. The principal cuts in spending embrace wage cuts in higher pensions and cuts on wages in the public administration.
Ireland’s economy was completely shaken up by crisis in 2008, as before this surprise, the country was living an extraordinary economic era – the Celtic
7 Troika is the name given to a group of 3 members: International Monetary Fund, European Central Bank and
Tiger. Since 2008, there has been an incredible and unbelievable growth in government indebtedness as Ireland became one of the more heavily indebted economies. This is the result of the property bubble breakdown that occurred between 2001 and 2007 as the government destroyed all that had been built in the past, leading to the implosion of the Irish banking system. The property bubble issue along with the rising of unemployment rate turned it impossible for many people to pay their bank loans. In 2010, as Ireland was quickly increasing the debt ratio and had the highest deficit in the Euro Zone, it entered in a European Union and the International Monetary Fund support program, and was, consequently, locked out of the bond market (Rigney, 2012). As of 2008, Irish domestic demand decreased rapidly with the introduction of the five anti-crisis budgets to attempt to correct public finances with the help of consolidation measures (Smyth, 2017).
Below is presented a graphic view of the Portuguese and Irish economies and their evolution during the analyzed periods.
4.1.
Population
The population from both countries was growing during the pre-financial crisis period. Between 2008 and 2010, both countries had its population growing. In Ireland, the population continued to grow after the financial crisis period, during the European sovereign debt crisis years; however, the Portuguese population decreased from almost 10,6 million of people to 10,3 million.
Figure 1 - Population Graphs for Portugal and Ireland between 2000-2017
4.2.
Gross Domestic Product
In the pre-financial crisis period both countries’ GDP were growing during those 8 years. When confronted with the repercussions from the US financial crisis, both Ireland and Portugal had their GDP decreasing, with Ireland presenting a bigger drop than Portugal. During the European sovereign debt crisis, it is possible to see that even though Ireland suffered a bigger drop in GDP, it has rebound better than the Portuguese community. Besides this, the path of recovering GDP values was more constant to Ireland than Portugal and Ireland achieved a higher value in 2017 – after the crisis - than the one it had in 2007 – before the crisis.
Between 2000 and 2007, Portuguese GDP increased at an annual average rate of 1.4% (Caldas, 2012).
Figure 2 - GDP graphs for Portugal and Ireland between 2000-2017
4.3.
GDP Growth Rate
Analyzing the graphics, it is clear to see that during the financial crisis period, in Portugal the value of the rate was mostly negative, reaching the -2.3% in 2009; in Ireland, values were also negative reaching -3.8%. In the last period of the time sample, Portuguese growth rate was mostly positive from 2014 onwards; Irish GDP growth rate reached the higher value of all of the sample in this same period.
Figure 3 - GDP Growth rate for Portugal and Ireland between 2000-2017
4.4.
Public Debt
Here we have each country public debt as a percentage of the GDP. Comparing both countries in the pre-crisis period, we can see that Portugal already had a high percentage of GDP as public debt –Portuguese public debt in 2000 was half of Portuguese GDP and it only increased since then. Irish public debt was always lower than the Portuguese one, and when it increased in the financial crisis period it was still lower than the Portuguese one. The highest levels of public debt in Ireland and Portugal were during the European sovereign debt crisis, where each country reached a maximum of 119.6% and 130.6%, respectively. In this last period, we can see that both countries borrowed more money; however, Ireland has been decreasing the amount of its public debt.
Portuguese GDP increased from 50.4%, in 2000, to 68.3% in 2007 and 107.8% in 2011 (Caldas, 2012).
Figure 4 - Public Debt for Portugal and Ireland 2000-2017