A Work Project, presented as part of the requirements for the Award of a Masters Degree in Finance from the Faculdade de Economia da Universidade Nova de Lisboa.
Return on Equity:
A comparison between companies in Portugal and Brazil:
Similarities and Differences
João Pedro da Costa Andrade Marques
Student Number: 354
A Project carried out on the Accounting and Financial Reporting course, with the supervision of:
Professor Leonor Ferreira
Abstract:
The purpose of this research is to study the Return on Equity of Portuguese and Brazilian companies, through the DuPont method. This project analyses whether differences in the ratios depend on specific features of the country, or if it is influenced by the industry where it is located. From the comparisons it is concluded that Brazilian companies pay higher corporate taxes and while the Portuguese companies are more leveraged, it is the Brazilian companies which pay higher interests. It is also noticeable that Portuguese companies take more advantage from the financing decisions and Brazilian on the investing decisions.
Key Words: Return On Equity; Taxation; Financial Leverage; Portugal and Brazil
1. Introduction
The massive amount of numbers available in the financial statements may confuse and complicate financial analysis. Financial ratios are calculated from the information provided by the financial statements and have always been powerful tools and useful indicators to measure firms’ performances, financial position and its evolution. They also allow companies to improve efficiency by comparing performances with other companies even if they have different currencies, sizes, industries, or belong to different periods. It is important to mention that, financial ratios are only meaningful when compared with other ratios.
This study focuses in analysing the Return on Equity (ROE) ratio, which is a profitability ratio especially relevant for shareholders, using the DuPont Method that breaks down the ROE in a product of several ratios. The DuPont Method allows the understanding of the factors that most affect the ROE, namely the income taxation, the financing and the investing decisions.
growing economies and according to Expresso (2011) Brazil recently became the sixth largest economy in terms of economic output, surpassing the United Kingdom and it is expected to be the fifth in 2015, surpassing France. During the last decade the commercial trades between Portugal and Brazil duplicated, however, that amount remains very low. Bearing this in mind the governments signed economic cooperation agreements in order to strengthen relations between the two countries. They consider that there is a high potential of growth of the commercial trades, for instance the “Câmara Portuguesa de Comércio no Brasil” considers that there is a potential market of $8 billion for Portuguese merchandises in the Brazilian market. This can be an opportunity for Portugal to ease the financial crisis and for Brazil to enter the European market.
According to Cechella (2009), Portugal has been one of the main targets of the FDI (Foreign Direct Investment) of Brazilian companies that consider Portugal as a strategic country to the internationalization process. Moreover, recently, several Brazilian companies have shown interest in taking part in the privatization process of some Portuguese government-owned companies (Diário Económico, 2011). Thus, there is a motivation to study the ROE of Portuguese and Brazilian companies, find similarities and differences and understand the factors underlying them.
Following this Introduction, this work project proceeds as follows. In section 2 it is presented a theoretical background and in section 3 the literature review. Afterwards, in section 4 the research questions are set up, which are answered on section 5. This section provides the calculation of the ROE ratio for Portuguese and Brazilian companies, and at the same time, for financial and non-financial companies. Afterwards, those ratios are compared and differences among them are highlighted,
based on the tax burden and diverse tax systems (section 5.2), the financial leverage, the discussion of capital structure and interested burden (section 5.3) and the return on assets ratio (section 5.4) Finally, the conclusion is presented, together with the limitation of the analysis and suggestions for possible future research.
2. Theoretical and Contextual Background; ROE – The DuPont Method
The return on equity is a profitability ratio which is calculated by the formula below1 𝑅𝑂𝐸 =𝑁𝑒𝑡 𝐼𝑛𝑐𝑜𝑚𝑒𝐸𝑞𝑢𝑖𝑡𝑦
: [1]
This ratio measures the rate of return on the shareholder’s equity, or in other words, shows how efficient the company is using the investment funds to generate profits. In order to find the main sources of differences in the ROE, the DuPont method breaks this ratio in a product of six ratios (regardless extraordinary decisions): tax burden (1), interest burden (2), leverage effect (3), effect of fixed costs (4) gross sales margin (5) and asset turnover (6).
𝑅𝑂𝐸 =𝑁𝑒𝑡 𝐼𝑛𝑐𝑜𝑚𝑒𝐸𝐵𝑇 × �𝐸𝐵𝐼𝑇 ×𝐸𝐵𝑇 𝐸𝑞𝑢𝑖𝑡𝑦� × �𝐴𝑠𝑠𝑒𝑡𝑠 𝐸𝐵𝐼𝑇𝐺𝑆𝑀 ×𝑆𝑎𝑙𝑒𝑠 ×𝐺𝑆𝑀 𝐴𝑠𝑠𝑒𝑡𝑠� [2]𝑆𝑎𝑙𝑒𝑠
(1) (2) (3) (4) (5) (6)
The tax burden (1) measures the effect of the amount of taxes paid every year by the company. Through this ratio it is simple to obtain the effective tax rate. However, this rate is not necessarily equal to the nominal tax rate2
The leverage effect and the interest burden ratios represent the financing decisions of the company. The former measures the degree of financial leverage of the company and , since companies use tax management and planning decisions to originate a gap between effective and nominal tax rate. Moreover, the higher the corporate tax rate, the lower the ROE will be.
1
When performing that ratios, for equity, and assets accounts, It was used the average equity over the beginning and end of the period.
it shows that as the company becomes more leveraged, the ROE increases. However, the higher leverage, the higher the financial expenses. This can be analysed in the interest burden ratio (2) that quantifies the effect of financial costs and income, and shows that the higher the interest expenses, the lower the ROE. Taking into consideration these two factors, there is a trade-off between the leverage effect and the financial expenses. To better understand this, it is important to look at the compound leverage factor3
It is important to mention that the compound leverage effect is larger than one only when the ROA
that shows the aggregate effect of the leverage and of the interest burden. If the compound factor is greater than one it means it has a positive contribution on the ROE, and therefore the company is profiting from the debt it is using. On the contrary, if the compound factor is lower than one, it indicates that the use of debt implies a decrease in the ROE.
4
The contribution of the investing decisions to the ROE can be explained by the ROA ratio, which can be decomposed in three other ratios: the effect of fixed cost, the gross sales margin (GSM) and the assets turnover. The effect of fixed costs measures the operating risk of the company. It indicates that the higher the fixed costs the lower the ROE. The gross sales margin ratio is what remains from sales after deducting the costs associated with the goods sold (COGS) and measures the amount of profit per unit of (Return on Assets) before taxes is larger than the interest rate paid on the borrowings. The Modigliani-Miller theorem (Modigliani and Miller, 1958) also proves that firms can benefit with the use of debt, since profitable companies can deduct interest expenses which reduces the tax payments, while dividend payments cannot be deducted.
3 Compound leverage factor (or financing decisions) = Interest Burden X Leverage Effect 4 ROA=EBIT (Earnings Before Interests and Taxes) /Assets
sales. As expected, a larger gross sales margin contributes positively to the ROE. Finally, the assets turnover ratio indicates how efficient the company is using its assets in generating sales. However, the detailed analysis of the ROA is out of the scope of this research.
2.1 Tax systems:
In Brazil and Portugal, profits of the companies are subject to a corporate tax, which can be understood by equation [2], that reduces the ROE by the so called tax burden (1-t). In Portugal, since 2005, the standard corporate tax rate (IRC, Imposto Sobre o Rendimento das Pessoas Colectivas) has been 25%, and in 2010 a surtax of 12.5 % was imposed for profits below €12,500. However, the companies analysed in this research obtain incomes much larger than €12,500 and therefore this supplemented tax has a very small effect. It is important to mention that the Portuguese tax system also includes a municipal tax that varies depending on the city, but normally it is assumed 1.5%. Thus, the Portuguese corporate tax rate for the period analysed is approximately 26.5%.
Brazil has a more complex system, the corporate tax named IRPJ(Imposto de Renda de Pessoa Jurídica) which consists in a tax rate of 15% plus an additional tax of 10% on the annual revenue that exceeds the R$ 240,0005
2.2 Interest Rates:
. There is also an additional 9% rate for the social contribution and therefore the Brazilian corporate tax rate is about 34%. Comparing the two countries, it can be concluded that as the Brazilian companies face higher corporate tax rates, the negative impact on ROE is stronger.
Damodaran (2010) refers that there are three components that affect the cost of debt: The levels of interest rates, the default premium and the firm’s tax rate. During the period analysed, the level of interest rates was higher in Brazil, for instance the yield to
maturity of the 10 year government bond was in Brazil 6.18% and 4.38% in Portugal. Moreover, the probability of default of Brazilian companies is apparently larger than in Portugal, 8% and 9%6
Considering that Brazilian companies pay higher taxes and that the level of interest rates is higher, which discourages the use of debt, is expected that the investing decisions (ROA) are the ones that boost the ROE. Bearing this in mind, there is an extra motivation to study these topics.
respectively. In order to perform this probability of default, companies credit rating was used. However, several companies do not have market traded corporate bonds, and to ease this situation Damodaran (2010) argues that the interest to long term debt ratio is a good aproximation to the cost of debt which is discussed later.
3. Literature Review
This section reviews the previous research about financial ratios. The studies analysed are grouped in the following categories: financial ratios and performance analysis; financial ratios and accounting effects; financial ratios and size of companies; tax burden; and capital structure.
The statistical properties of financial ratios have been studied by several authors. One of them, Trigueiros (1995), discusses why the distribution of financial ratios is symmetrical or negatively skewed. The data was collected from the accounting reports of the UK industrial firms in the period of 1983-1987. He concludes that ratios are symmetrically and negativity skewed due to the effect of external boundaries such as accounting entities.
Stressing that financial ratios are important tools to analyse the companies, McLeay
6 These probabilities were calculated by using the Standard & Poor’s Credit ranking and the standard probabilities of default set up by Damodaran (2010).
and Stevenson (2006), argue that this importance is growing with the European economic integration. Their research aims to explain the company’s performance by using the financial ratios through the analysis of the main accounts in financial statements, such as, shareholders’ equity, total debt, total assets, sales or total costs. Moreover, McLeay decomposed the ROE, on Debt to Equity ratio, asset turnover, and debt turnover. They conclude that “the components of financial ratios are correlated variables, and our estimates show that any co-integrating effects will decay rapidly”. They show that as firm grows the line items of financial statements also tend to grow and if that company is changing the financial or operating structure, accounting variables might actually grow more than the firm.
Financial ratios have also been tested in their ability to predict future market returns. For instance, Lewellen (2004) studies up to what point can financial ratios, predict stock returns. He showed that the dividend yield ratio was able to predict market returns between 1946 and 2000, and that Book-to-Market and earnings price predicted it during 1963-2000.
Neves (2007) emphasises that ratios are a very good tool to agglomerate a lot of information, in order to analyse it and compare it across time and over companies, however, he concludes that ratios may help to ask the right question but they can not give the correct answer.
Another stream of research based in financial ratios emerged by 2005, and studies the economic effects of accounting changes and choices. Since January of 2005, all the European listed companies have been required to prepare the consolidated financial statements adopting the International Accounting Standards/ International Financial Reporting Standards (IAS/IFRS). In Portugal, Nunes (2008) studies the impact of that
change on accounting recognition and disclosures of Goodwill on financial statements of Portuguese listed companies. Nunes (2008) finds that most of holding companies present much higher amounts of goodwill, however, the signal of the differences in non-holding companies was not certain. Following this change in the financial reporting regulation, Encarnação (2009) measures the changes in financial ratios of the Portuguese Group Jerónimo Martins, from 2005 to 2008, resulting from the adoption of the IAS/IFRS. This research concludes that the use of IAS/IFRS results in significant differences on the financial ratios, when comparing with the use of the previous accounting regulation, the POC (Plano Oficial de Contabilidade, or Official Accounting Plan), meaning that comparisons between periods after 2005 with periods before 2004 may not be realistic.
Several studies used databases of financial information, such as the BACH (Bank for the accounts of Companies Harmonised) database that contains annual accounts of non-financial companies of several companies.
Serrano, Mar and Gallizo, (1999) uses BACH database when studying the evolution of the economies of ten EU Countries for the period 1986-1995 in what concerns financial information of the firms, more specifically, 15 financial ratios. They analyse if the financial information of the firms reflects changes in the economy and conclude that “the economic cycle is important, and is reflected in aggregated accounting numbers”. Additionally Serrano, Mar and Gallizo (1999) concludes that there is a two year gap between the economic cycle and the business cycle and thus recommends that more attention should be paid to the financial variables since they are highly correlated with the economy.
Serrano, Mar and Gallizo (2001) study up to what point financial ratios can reflect the size of the companies and conclude that financial ratios can actually reflect the size of the company. Again, data for the research was also collected from the BACH and 15 financial ratios were computed. Companies were organized in three different groups based on sales turnover and classified as small, medium and large.
Also using BACH Database Rivaud-Danset, Dubocage and Salais (2001) compare the financial structures of small and large enterprises. Their findings are very relevant as they conclude that gross profit/equity ratio is larger in small and medium enterprises (SME), meaning that SME are more efficient concerning the capital employed. The authors conclude that SME adapt their needs to the market more rapidly, resulting in a higher importance of short term debt.
Collier et al. (2004) highlights the importance of financial ratios by using the financial statements to perform a ratio analysis of Motorola Corporation and comparing it with the industry. Using the DuPont method to analyse the ROE, the authors understand the factors that affect the ratio in this single case study.
Rosa (2006) studies the tax burden of Portuguese banks in 2005 and concludes that the effective tax rate was about 13.5%, when the nominal tax rate was about 27.5%. Rosa argues that this huge difference is due to the tax planning and the several tax benefits for the bank industry in Portugal.
As mentioned before, Modigliani and Miller (1958) state that the tax burden of interest stimulates companies to issue debt. Bancel (2002) surveys managers, on 17 european countries to understand what are the most important factors influencing the capital structure policy and concludes that are financial flexibility, credit rating and tax advantages. However, the cost of debt is also an important factor when settinp up the
capital structure and Damodaran (2010) argues that the firms cost of debt depends on the risk free rate, on the default spread and on the tax rate.
From the literature review, I conclude that financial ratios have been a subject of various studies and are very useful to perform financial analysis of the companies and to compare them overtime. The DuPont Method was already used to perform an analysis of individual companies. Besides that, the tax burden, capital structure and interest burden, components of the ROE through the DuPont method have also been a subject of study. It is also important to highlight that researches between Portugal and Brazil ares carce and therefore this project aims to compare them.
4. Research Questions and Data
This research aims to analyse the main sources of differences in the ROE between the two countries. Possible sources of difference can be found in the tax burden variables (tax rate), in the financing decision variables (debt and cost of debt) or in the investing decision variables (return on assets). Thus this section defines the research questions (RQ), and describes the data sources and sample selection. On graph 1 it is presented the main topics of the research questions.
Graph 1: Summary of Research Questions 1
RQ 1 – What are the values of the ROE of Portuguese and Brazilian companies? Afecting Factors /
Explanatory variables:
Explained Variable ROE
Tax Burden
Legal taxes:
Portugal vs Brazil Portugal vs Brazil Effective taxes:
Tax planning specific regimes Financing Decisions Compounding Factor
Capital structure Interest Burden Investing Decisions
Explained Variable 1: Return on Equity ratio
Does the ROE differ between Portuguese and Brazilian companies? Research question 1 is an explanatory question, which allows additional questions related with the determinants of ROE. Thus, the additional research questions aim to know more about: How much does ROE differ? What are the sources of these differences? Which factors affect ROE? Why does ROE of Portuguese and Brazilian companies differ?
H2: ROE depends on taxation
RQ 2 – How does taxation affect the ROE?
Explanatory variable 1: Tax burden? H.2.1- External to company: (Tax system)
• Do different tax regimes imply different impacts of taxation on ROE? Is tax burden in Brazilian companies different from tax burden in
Portuguese companies? • Evolution over time;
H2.2. Internal to company: (Tax planning)
• Is there any significant gat between effective and legal tax rate? If yes, why?
• Do financial companies pay lower effective taxes? H 3: ROE depends on financing decisions:
RQ 3 – How does the effect of financial leverage/debt financing decision affect ROE?
Explanatory variable 2.1: Is the compound effect greater or lower than one?
Explanatory variable 2.2 : Capital structure;
• Does capital structure differ between Portuguese and Brazilian Companies?
• Do current liabilities differ from non-current liabilities? Does capital structure vary among industries?
• Does capital structure vary over time?
• Do Portuguese companies pay a lower interest rate than Brazilian companies over time?
• Does average interest rate vary over time?;
RQ 4 – ROA differs from Portuguese to Brazilian Companies
Explanatory variable 3: ROA;
This research is based on data collected from the annual reports of companies listed in the main indexes of Portugal and Brazil, Euronext Lisbon (PSI20) and Ibovespa, respectively. The data collected covers the periods of 2005-20107
The sample includes: 20 Portuguese companies, in which four belong to the financial industry and 16 are holding companies; 60 Brazilian companies, in which eight belong to the financial industry. The full list of companies in the sample and its respective industries is shown in Appendix 1. Appendix 2 and 3 present the industries segmentation, and it can be seen that in both countries banks are definitely the most relevant industry, with more than half of the total assets between 2005 and 2010. Besides that, industries related with energy, telephone and paper and related products are very representative in both indexes. Size and currency are not concerns for this research as all the analysis is based on ratios, however, when the presenting the annual averages these values are weighted by the assets.
. Since 2005 all the companies listed in European Stock Market, with consolidated accounts, should adopt the IFRS/ IAS when preparing the consolidated accounts. Therefore the period in analysis starts in 2005, to exclude reporting with different accounting rules among Portuguese companies in the sample. The period of analysis ends in 2010, which is the most recent complete year for which data fundamentals are available. Moreover, in 2010 the adoption of the IFRS was required for listed companies in Brazil.
7An excel database was created for this research, with all the relevant data collected from the annual reports. This database which has approximately 500 rows and 50 columns is a contribution of this research, as it provides ratios for Brazilian and Portuguese companies over time and across industries.
5. Results
This sections contains the answer and an interpretation to the research questions set up on the previous section. First, it is discussed the differences on ROE on both countries and afterwards the main sources of those differences are presented.
5.1 ROE: Overall Analysis
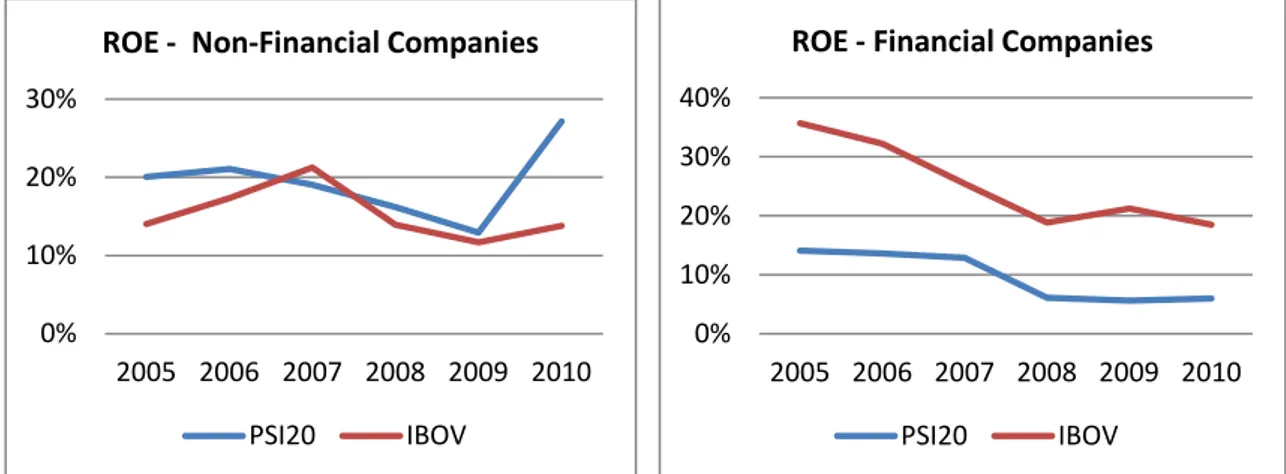
Before analysing the factors that may influence the ROE, this research looks at the rates of return achieved by each index. Figures 1 and 2 present the weighted average of the ROE and as mentioned before, the financial companies represent a significant part of each index, and therefore this analysis is divided in two parts: One in which it is considered the non-financial companies, and one in which only the financial companies are analysed.
Non-financial companies in Portugal show significant larger ROE ratios, than Brazilian companies, with a weighted average over the period analysed of 19.41% and 15.34%, respectively (see Figure 1). It is also important to mention that since the subprime crisis both countries show downward trends, however, in 2010 profits recover.
The ROE ratios of financial companies are highly correlated (83%) and show a very similar downward trend despite the larger rates of return in Brazil (see Figure 2).
0% 10% 20% 30%
2005 2006 2007 2008 2009 2010 ROE - Non-Financial Companies
PSI20 IBOV
Figure 1: Return on Equity of Non-Financial Companies
0% 10% 20% 30% 40% 2005 2006 2007 2008 2009 2010 ROE - Financial Companies
PSI20 IBOV
show a larger ROE than financial companies, while in Brazil the opposite occurs.
To better understand the overall performance of the indexes, on Figure 3 it is presented the overall ROE, i.e., financial and non financial companies are considered. It can be seen that Brazilian companies show a significantly larger rate of return than the Portuguese, which is due to the very significant weight of financial companies and its respective large rate of return.
Figure 3: Return on Equity - Overall
It is also important to look at the industries that show high performances, and to those that most contribute to the overall ROE. On Appendix 4, this information is summarized and it can be concluded that in Brazil, other financial companies (investment and credit card banks), Cosmetics & Toiletries, and Tobacco, present the highest ROE. In the case of Portugal (see Appendix 5) the most profitable industries are Telephone/Telecom/cable services and Oil Company-Integrated. Nevertheless, the industries with a larger contribution to the overall ROE, were not the ones with higher rates of return. The industries that most contributed to the ROE are roughly the same on both indexes, namely banks, telephone and energy.
5.2 Taxation systems
Portugal Brazil
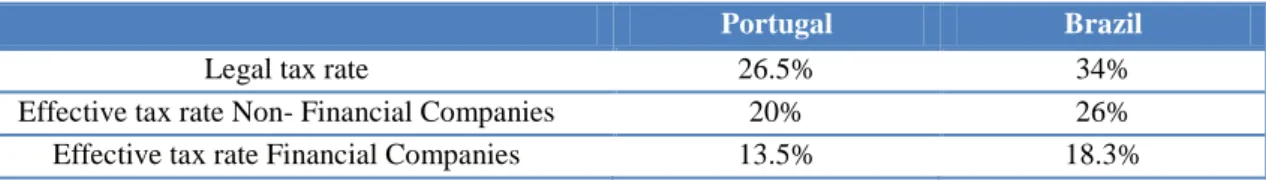
Legal tax rate 26.5% 34%
Effective tax rate Non- Financial Companies 20% 26% Effective tax rate Financial Companies 13.5% 18.3%
Table 1 - Legal and Effective Tax Rates
0,00% 10,00% 20,00% 30,00% 2005 2006 2007 2008 2009 2010 ROE - Overall PSI20 IBOV
Having explained the corporate tax systems on section 2, it is important to the see if from 2005 to 2010 the nominal tax rates are in fact equal to the effective taxes (Table 1). To do that, it was performed an average of the income taxes paid for all non-financial companies and it is observed that Portuguese companies are facing on average, effective tax rates of 20% while for Brazilian companies is 26%. In the case of Portugal the effective rate is 6.5% lower and in Brazil is 8% below the nominal tax rate. The financial companies also show very distinctive values between effective and non effective tax rate. In Brazil, financial companies present a effective tax rate of 18.3% which is slightly below of the nominal tax rate and also of what non-financial companies load. In Portugal financial companies also show a lower of effective tax rate, 17.5%. Comparing these results with the ones attained by (Rosa, 2006), who found out that over 2006 there was an effective tax rate of 13.5%, it may conclude that, despite the lower interest burden, during 2005-2010, financial companies are also facing low effective tax rates.
5.2.1 Specific Characteristics
There are many reasons that may justify the lower effective taxes rates. When comparing Portugal with Brazil, one possibility is that there is a particular taxation system (RETGS – Regime Especial de Tributação dos Grupos de Sociedades), for consolidated returns which can be applied by the group of companies where the dominant company owns at least 90 per cent of the shares of other companies and more than 50 per cent of the voting rights (Direcção Geral dos Impostos 2010). Under this system, a group of companies can be taxed on the consolidated returns instead of single company taxation. In other words, the taxable income equals the sum of profits and losses of the whole group. The main advantage of this regime is that, the companies that
report negative profits can deduct those losses on the same year they are incurred. Companies out of this system cannot deduct losses of share entities which have a maximum of three years to be reported. To measure this impact, it is performed the effective tax rate only for holding companies in Portugal, and it is achieved a tax rate of 18%, which is slightly lower than the 20% mentioned before. This difference is actually not larger as most of the companies in PSI20 are considered SGPS and therefore apply the RETGS. In the case of Brazil, there are no consolidation systems and so, every company is taxed separately from the related entities.
Other reasons may justify the differences on the earnings before tax and in the taxable income in both countries. On the one hand, on EBT, it is accounted some income that is not taxable, and so, it needs to be taken out to obtain the taxable income (released gains on assets, valuation of financial instruments, reversal of impairment losses, social benefits etc). On the other hand, there are non-deductible tax costs that must be added to the taxable income (Increase in provisions, Increase in impairment losses, etc).
To better understand the two tax systems it is also important to look at other relevant taxes. As mentioned before, in Brazil there is a social security tax on net profits. However, employers also contribute with 37.8% of the employees wage to social insurance, in which 8% is consigned for the Length of Service Guarantee Fund, 20% for the National Social Security Institute, INSS(Instituto Nacional do Seguro Social), and a maximum of 8.8% for other social taxes. Employees also contribute with 8%-11% of their salaries. In Portugal employers and employees are required to contribute with 23.75% and 11% of the salary, respectively. Comparing the social security taxes, it may be concluded that the employees’ contribution is similar; however companies in Brazil
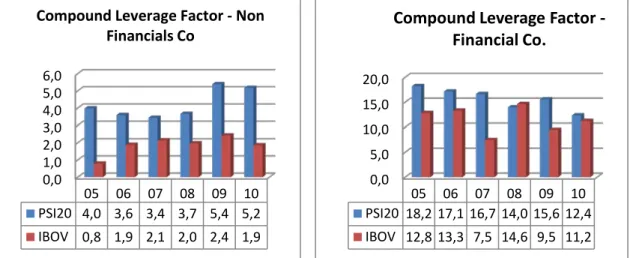
0,0 5,0 10,0 15,0 20,0 05 06 07 08 09 10 PSI20 18,2 17,1 16,7 14,0 15,6 12,4 IBOV 12,8 13,3 7,5 14,6 9,5 11,2
Compound Leverage Factor - Financial Co.
contribute 14.05% of the salaries more than in Portugal.
Summing up, this research provides evidences that both legal and effective tax rates are higher in Brazil. However, there is evidence that companies are using tax planning which is reflected in a lower effective tax rate. This is even more evident when analysing the financial companies, which may be due to the large amounts of dividends received which are deductible to the taxable income.
5.3 Financing Decisions
The effect of the financing decisions on ROE can be broken in two factors: the effect of financial leverage and the effect of financial costs. Before analysing each one individually, the compound effect is commented.
• Compound leverage factor
The compound leverage for non-financial companies in Portugal is much larger than in Brazil, meaning that financing decisions have a stronger contribution to the ROE (See Figure 4). As mentioned on the theoretical background, the compound factor only helps to boost the ROE when it is greater than one. It is important to notice that in 2005, Brazilian companies show a compound factor below one, meaning that ROE falls with an increase in the use of debt. From the appendix 6, it can be concluded that the
0,0 1,0 2,0 3,0 4,0 5,0 6,0 05 06 07 08 09 10 PSI20 4,0 3,6 3,4 3,7 5,4 5,2 IBOV 0,8 1,9 2,1 2,0 2,4 1,9 Compound Leverage Factor - Non
Financials Co
industries with a larger compound factor are not coincident in both countries, except the retail industries, that is the fifth industry with a larger compound factor. However, when analysing the companies that most contribute to the compound factor presented on Figure 4, it can be concluded that are the industries related with electric/energy, telephone and oil.
When comparing Figure 4 with Figure 5, it is noticeable that financial companies present a much larger compound leverage factor, which means that this factor has a higher contribution to the ROE. However, it is also relevant to notice that financial companies in Portugal are more dependent on this factor, to increase profits, than in Brazil.
• Leverage effect
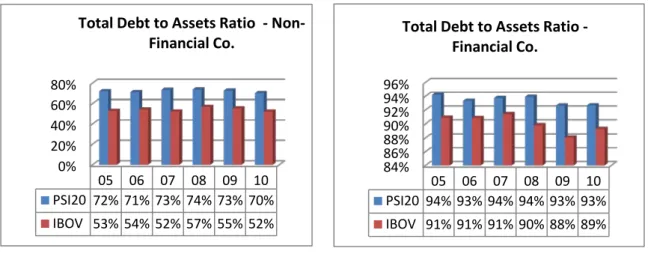
The analysis of the leverage effect can be made by the assets to equity ratio, however it is more intuitive to look at other capital structure ratios, such as the debt to assets ratio. This particular ratio indicates the proportion of debt a company is using to finance its assets.
Regarding the weighted averages of the debt to equity ratio of non-financial companies, the results show that there is a trend to increase leverage until 2008, while
0% 20% 40% 60% 80% 05 06 07 08 09 10 PSI20 72% 71% 73% 74% 73% 70% IBOV 53% 54% 52% 57% 55% 52%
Total Debt to Assets Ratio - Non-Financial Co. 84% 86% 88% 90% 92% 94% 96% 05 06 07 08 09 10 PSI20 94% 93% 94% 94% 93% 93% IBOV 91% 91% 91% 90% 88% 89%
Total Debt to Assets Ratio - Financial Co.
afterwards leverage tends to decrease (See Figure 6). Over the period analysed, Portuguese companies in the PSI20 are more leveraged than Brazilian ones. The former show an average of 72.1% debt to equity ratio, while Brazilian companies present 54.3% of leverage. This fact is also evident when considering only financial companies (See Figure 7), which also shows a slightly downward trend. As expected, the banking industry is very leveraged, which under this period was being regulated by the Basel II.
As mentioned on Section 2.1, the more leveraged the company is, the higher the ROE, making evident that Portuguese companies show higher contributions to the ROE, since they are more leveraged.
It is also important to look at the most leveraged industries and therefore in Appendix 7 that information is summarized. The only industry present in both countries is the retail, with an average debt to assets ratio of 74% in Portugal and 70% in Brazil.
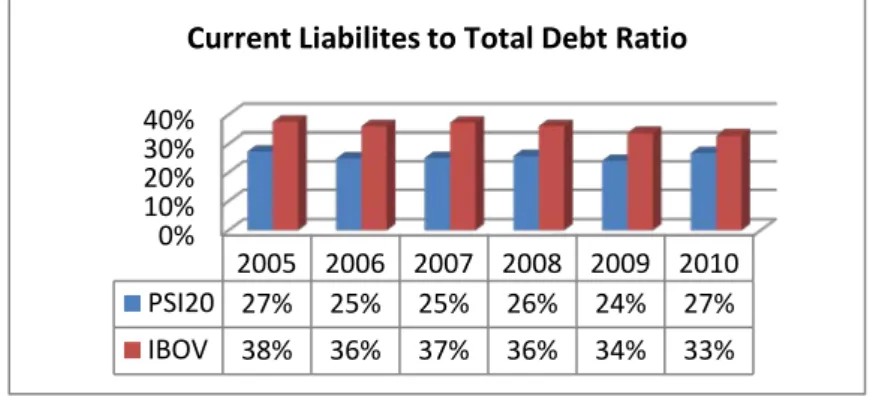
Figure 8: Capital Structure: Current Liabilities to Total Debt Ratio
To better understand the capital structure of the two indexes, it is presented on Figure 8 another ratio, the 𝐶𝑢𝑟𝑟𝑒𝑛𝑡 𝐿𝑖𝑎𝑏𝑖𝑙𝑖𝑡𝑖𝑒𝑠
𝑇𝑜𝑡𝑎𝑙 𝐿𝑖𝑎𝑏𝑖𝑙𝑖𝑡𝑖𝑒𝑠 . This ratio allows to find out if the companies’ debt are due within one year, i.e., current liabilities, or if are due to longer than one year, non-current liabilities. Since, financial companies prepare their financial statements in a different format it is not possible to perform this analysis to that industry. From Figure 8, it can be observed that in both countries, companies prefer long-term liabilities, and
0% 10% 20% 30% 40% 2005 2006 2007 2008 2009 2010 PSI20 27% 25% 25% 26% 24% 27% IBOV 38% 36% 37% 36% 34% 33%
this is more relevant in Portugal, since the average of this ratio between 2005 and 2010 is 38% on PSI20 35% on Bovespa.
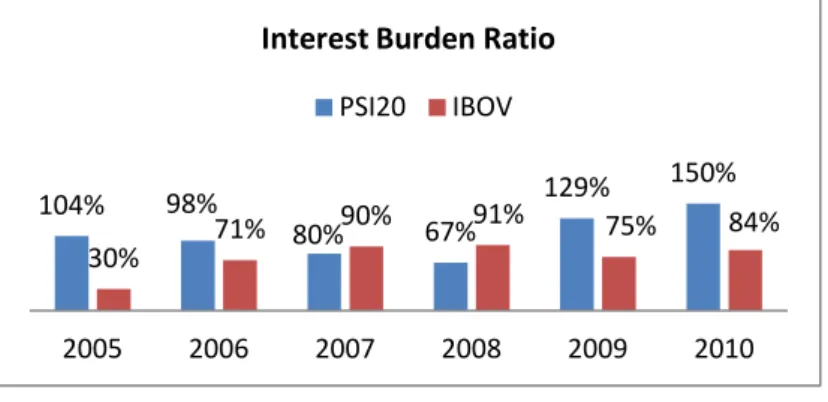
• Interest Burden Ratio8
The second factor that influences the ROE is the interest burden ratio (See Figure 9). Over the period analysed, Portugal shows a higher ratio meaning that it has a lower amount of financial expenses or a higher amount of financial/investment income, when comparing with Brazil. In some periods Portugal presents a ratio higher than one, meaning the financial income is larger than the financial expenses.
Figure 9: Interest Burden Ratio
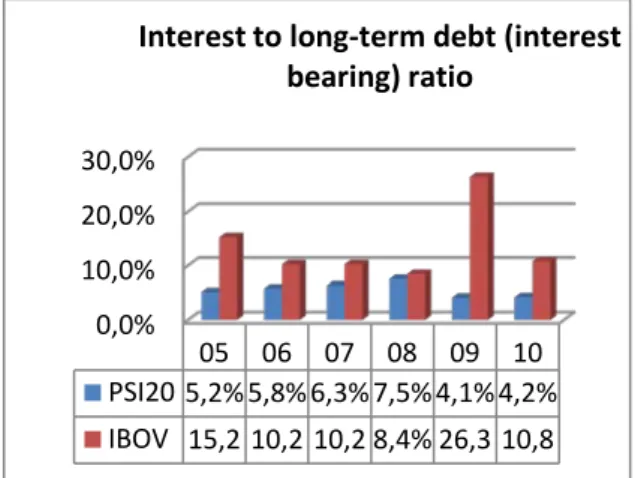
In order to understand the effect the financial expenses alone, it is better to analyse the interest expense to long term debt (interest bearing) ratio after tax, i.e., an approximation of the cost of debt (See Figure 10). Over the period analysed, this ratio is about 5.5% in Portugal and 13.5% in Brazil. This indicates that companies in Brazil are paying more interest on its debt than in Portugal. It is also important to mention that Brazilian companies show a higher standard deviation (6.66%), than in Portugal (1.31%), which means that in Brazil this ratio has a larger variation. Moreover, in Brazil no trend or correlation is relevant with the amount of debt. However, in Portugal it is found a significant correlation (65%) between this ratio and the debt to assets, meaning
8 Due to the specific characteristics of the financial companies they are not analysed in this section. 104% 98% 80% 67% 129% 150% 30% 71% 90% 91% 75% 84% 2005 2006 2007 2008 2009 2010 Interest Burden Ratio
0,0% 1,0% 2,0% 3,0% 4,0% 2005 2006 2007 2008 2009 2010 Return On assets - Financial Co. that as companies in Portugal become more leveraged, the interest paid on that debt increases.
Figure 10: Interest to Total Debt Ratio
5.4 Return on Assets
Concerning Return on assets ratio, Brazilian companies appear to be much more efficient using its assets to generate earnings, than Portuguese ones, as the former present higher values on the Return on Assets ratio (See Figure 11). Concerning non-financial companies, it is noticeable a clear downward trend over the period analysed, meaning that the contribution of this effect has been decreasing (See Figure 12). As seen before, the high interest rates in Brazil discourage the use of debt and therefore, the contribution of the financing decisions to the ROE is lower. Moreover the tax burden in Brazil is more severe and in order to attain the ROE values seen in section 5.1 Brazilian companies have to show a larger ROA ratio.
0,0% 10,0% 20,0% 30,0% 05 06 07 08 09 10 PSI20 5,2% 5,8% 6,3% 7,5% 4,1% 4,2% IBOV 15,2 10,2 10,2 8,4% 26,3 10,8
Interest to long-term debt (interest bearing) ratio 0,0% 5,0% 10,0% 15,0% 2005 2006 2007 2008 2009 2010 Return On assets - Non-Financial
6. Conclusion
This project adds to the existent literature on using financial ratios to analyse companies’ performances, a comparison of the ROE ratio in Portuguese and Brazilian companies over the period 2005-2010. In order to understand the factors that affect ROE, the DuPont method was used. This method breaks the main factors in three parts: tax system; financing decisions and investing decisions; this research focused only on the first two. Besides comparisons between countries over the period analysed, this project also introduced a comparison between financial and non-financial companies.
After reviewing ROE in both countries it was observed that when considering non-financial companies, Portuguese companies showed higher rates of returns, while the contrary occurred when considering financial companies. In the financial industry a similar performance between the two countries was observed.
A first source of differences in the ROE is the tax burden. The legal tax rates are definitely higher in Brazil than in Portugal (being 34% and 26.5% respectively) However, the effective rate of non-financial companies is actually much lower than the legal rates (26% in Brazil and 20% in Portugal), meaning that companies are using effective tax planning systems. Financial companies showed even lower effective tax rates (18.3% in Brazil and 17.5% in Portugal). These low effective tax rates are due to tax planning management or to the adoption of specific regimes.
A second source of differences in ROE of the companies analysed is due to differences in the financing decisions which can be divided in two effects: the leverage and the interest burden. Portuguese companies, both financial and non-financial, showed a compounding factor larger than Brazilian companies, meaning the former are profiting more with the use of debt. It was also relevant the fact that financial companies
in both countries presented on average compound factors five times larger than non-financial companies. In order to better understand the financing decisions the leverage of the companies was analysed, through the debt to assets ratio. It was concluded that Portuguese companies were more leveraged over the period analysed, and that companies in the financial industry also showed to be much leveraged. To complete the analysis, it was observed that the interest burden ration was higher for non-financial companies and in half of the periods larger than one. This means that financial income was higher than financial expenses, however, this ratio showed lower values in Brazil. In order to analyse the effect of the interest expenses alone, in non-financial companies, the interest to total debt ratio was computed, and this allowed to conclude that Brazilian companies are paying more interest on its total debt, than Portuguese. A probable explanation may be the higher general interest rates in Brazil and the superior default premium of Brazil companies.
Finally, and in order to complete the ROE analysis through the DuPont method, it was observed that Brazilian companies (financial and non-financial) showed a larger ROA ratio, meaning that they were much more efficient. Summing up, it was observed that Portuguese companies relied more on the financing decisions while the Brazilian companies were more dependent on the investing decisions. The decomposition of the inventing decisions ratio (ROA) might be a subject for a future research.
Bibliography
Bancel, Franck. The Determinats of Capital Strucutre Choice: A survey of European Firms. Canada: University of Manitoba, 2002.
Barbosa, Rubens. "Viewpoint: Brazil - steady growth for America's only Bric." BBC, 2011: 20-30.
Cechella, Cristiano. Os Investimentos das empresas brasileiras em Portugal: Dez casos de estudo em empresas de
grande porte. Lisboa: Instituto Superior de Economia e Gestão, 2009.
Collier, H. W., T. Grai, S. Haslitt, and C. B. McGowan. An example of the use of financial ratio analysis: the case of
Motorola. Paper, Florida: Decisions Sciences Institute Conference, 2004.
Damodaran, Aswath. The dark side of valuation. New Jersey: Pearson Education, Inc, 2010.
Diário Económico. Económico. December 06, 2011. http://economico.sapo.pt/noticias/petrobras-vai-entrar-no-mercado-europeu-atraves-de-portugal_133041.html (accessed December 15, 2011).
Encarnação, Carina. Indicadores Económico-Financeiros: Os impactos da alteração em Portugal. Lisbon: ISCTE Business School, 2009.
Encarnação, Carina. "INDICADORES ECONÓMICO-FINANCEIROS:Os impactos da alteração normativa em Portugal." Lisboa, 2009.
Expresso. Expresso. 12 26, 2011. http://aeiou.expresso.pt/economia-brasileira-torna-se-sexta-maior-do-mundo=f696476 (accessed 12 26, 2011).
Gallizo, José L., Fernando Jiménez, and Manuel Salvador. “Evaluating the effects of financial ratio adjustment in European financial statements.” European Accounting Review, 2003: 357-377.
Koralun-Bereźnicka, Julia. "Country and industry factors as determinants of corporate financial liquidity in the European Union countries." Bank i Kredyt, 2011 42: 19-48.
Leuz, Christian, and Peter Wysocki. "Economic Consequences of Financial Reporting and Disclosure Regulation: A Review and Suggestions for Future Research." Chicago, 2009.
Lewellen, Jonathan. Predicting returns with financial ratios. Cambridge: Journal of Financial Economics, 2004. Mate-Sánchez, Mariluz, and Manuel Ruiz-Marin. "The Dynamic Adjustment of the Financial Ratios under a."
International Research Journal of Finance and Economics, 2010: 3-10.
McLeay, Stuart, and Maxwell Stevenson. Financial ratios are commonly used by financial analysts to compare the
performance. Sydney: University of Sydney, 2006.
Ministério das Finanças - Direcção Geral dos Impostos. Código do Imposto Sobre o Rendimento das Pessoas
Colectivas. Lisboa: Ministério das Finanças - Direcção Geral dos Impostos, 2010.
Modigliani, Franco, and Merton Miller. "The Cost of Capital, Corporation Finance and the Theory of Investment."
The American Economic Review (The American Economic Review), 1958: 48 (3) 261-297.
Neves, João Carvalho das. Análise Financeira - Técnicas Fundamentais. Lisboa: Texto Editores, 2007.
Nunes, Ana. Effects Of IFRS Adoption On The Financial Statements Of The Portuguese Listed Companies: The Impact
Of Goodwill Changes. MSc. Thesis, Lisbon: Faculdade de Economia da Universidade Nova de Lisboa, 2008.
Porto Editora. Fiscal. Porto: Porto Editora, 2010.
Rivaud-Danset, Dorothée, Emmanuelle Dubocage, and Robert Salais. Comparison between the financial structure of
SMES and that of large enterprises (LES) using the BACH database. Economic Paper, Paris: Université de Reims and
CEPN-Paris), 2001.
Rosa, Eugénio. "O que faz a banca para não pagar impostos e para ocultar os lucros reais que obtém?" Economic Paper, Lisboa, 2006.
Serrano, Cinca, Molinero Mar, and Larraz Gallizo. Country and Size Effects in Financial Ratios: A European
Perspective. Southampton: University of Southampton, 2001.
Trigueiros, Duarte. Accounting Identities and the Distribution of Ratios. Lisbon: ISCTE, University of Lisbon, 1995, 109-126.
Trigueiros, Duarte. "Incorporating Complementary Ratios in the Analysis of Financial Statements." Accounting,
Management and Information Technologies 4 (2005): 149-162.
Trigueiros, Duarte. "Non-Proportionality in Ratios: An Alternative Approach." The British Accounting Review 29 (1997): 213-230.
Trigureiros, McLeay &. "Proportionate Growth and the Theretical Foundations of Financial Ratios." EconPapers (University of Wales Bangor) 38 (2002): 297-316.
Whittington, Geoffrey, and Mark Tippett. The components of Accounting Ratios as Co-integrated Variables;. Cambridge: Journal of Business Finance & Accounting, 1999.
This Appendixes refer to the Work project:
Title: Return on Equity: A comparison between companies in Portugal an Brazil: Similarities and Differences.
Student: João Pedro da Costa Andrade Marques, nº354 Advisor: Professor Leonor Ferreira
Appendix 1 – Companies included in the research
Brazilian Companies included in the study: Industry
1 All America Latina Logistica SA Transport-Rail
2 Companhia de Bebidas das Américas Brewery
3 Brookfield Incorporacões SA
Building-Residential/Commerce
4 Bradespar SA Investment Companies
5 BRF - Brasil Foods SA Food-Meat Products
6 Braskem SA Petrochemicals
7 BR Malls Participacões SA Real Estate
Management/Services
8 Brasil Telecom SA Telephone-Integrated
9 B2W Companhia Global do Varejo E-Commerce/Products
10 BM&F Bovespa SA Finance-Other Services
11 Companhia de Concessões Rodoviárias SA Public Thoroughfares
12 Companhia Energética de São Paulo Electric-Generation
13 Cielo SA Commercial Services-Finance
14 Companhia Energética de Minas Gerais Electric-Integrated
15 CPFL Energia SA Electric-Integrated
16 Companhia Paranaense de Energia Electric-Integrated
17 Souza Cruz SA Tobacco
18 Cosan SA Industria e Comércio Sugar
19 Companhia Siderurgica Nacional SA Steel-Producers
20 Duratex SA Building Products-Wood
21 Vanguarda Agro SA Agribusiness
22 Centrais Elétricas Brasileiras SA Electric-Integrated
23 Eletropaulo Metropolitana Eletricidade de São Paulo SA Electric-Distribution
24 Embraer SA Aerospace/Defence
26 Gafisa SA Real Estate
Operations/Development
27 Gerdau SA Steel-Producers
28 Metalurgica Gerdau SA Steel-Producers
29 Gol Linhas Aéreas Inteligentes SA Airlines
30 Cia Hering Textile-Products
31 Hypermarcas SA Medical-Drugs
32 JBS SA Food-Meat Products
33 Klabin SA Paper & Related Products
34 Lojas Americanas SA Retail-Discount
35 Light SA Electric-Integrated
36 LLX Logística SA Transport-Truck
37 Lojas Renner SA Retail-Apparel/Shoe
38 MMX Mineracão e Metálicos SA Metal-Iron
39 Marfrig Alimentos SA Food-Meat Products
40 MRV Engenharia e Participacoes SA
Building-Residential/Commerce
41 Natura Cosméticos SA Cosmetics & Toiletries
42 OGX Petróleo e Gás Participacões SA Oil Company-Exploration &
Production
43 Companhia Brasileira de Distribuicão Grupo Pão de
Açúcar
Food-Retail
44 Petróleo Brasileiro SA Oil Company-Integrated
45 Redecard SA Finance-Credit Card
46 Rossi Residencial SA
Building-Residential/Commerce
47 Companhia de Saneamento Básico do Estado de São Paulo Water
48 TAM SA Airlines
49 Tim Participacões SA Cellular Telecom
50 Telemar Norte Leste SA Telephone-Integrated
52 Tele Norte Leste Telephone-Integrated
53 Companhia de Transmissão de Energia Eléctrica Paulista Electric-Transmission
54 Ultrapar Participações SA Petrochemicals
55 Usinas Siderurgicas de Minas Gerais SA Steel-Producers
56 Vale SA Steel-Producers
57 Banco do Brasil SA Commerce Banks Non-US
58 Banco Bradesco SA Commerce Banks Non-US
59 Itau Unibanco Commerce Banks Non-US
60 Banco Santander Brasil Commerce Banks Non-US
Portuguese Companies included in the study: Industry
1 Altri SGPS SA Paper & Related Products
2 Banco Comercial Português SA Commerce Banks Non-US
3 Banco Espírito Santo SA Commerce Banks Non-US
4 Banco Internacional do Funchal Commerce Banks Non-US
5 Banco BPI SA Commerce Banks Non-US
6 Brisa Auto-Estradas de Portugal SA Public Thoroughfares
7 Cimpor Cimentos de Portugal SGPS SA Building
Products-Cement/Aggregates
8 EDP - Energias de Portugal SA Electric-Integrated
9 EDP Renováveis SA Energy-Alternate Sources
10 Mota-Engil SGPS SA Building-Heavy Construct
11 Galp Energia SGPS SA Oil Company-Integrated
12 Jerónimo Martins SGPS SA Food-Retail
13 Portugal Telecom SGPS SA Telephone-Integrated
14 Portucel Empresa Produtora de Pasta e Papel SA Paper & Related Products
15 REN - Redes Energéticas Nacionais SA Electric-Transmission
16 Semapa-Sociedade de Investimento e Gestão Paper & Related Products
18 Sonae Retail-Miscellaneous/Diversified
19 Sonae Indústria SGPS SA Building Products-Wood
20 Zon Multimedia Servicos de Telecomunicacões e
Multimédia SGPS SA
Cable/Satellite TV
Appendix 2 – Industries Segmentation in Brazil
Appendix 3 Industries Segmentation in Portugal 2% 10% 7% 6% 6% 5% 55% 9%
Industries Segmentation - Brazil Brewery Electric/Energy Paper&Related Products Steel-Producers Sugar Telephone
Commer Banks Non-US Other Industries 68% 1% 2% 6% 2% 14% 1% 1% 3% 2%
Industries Segmentation - Portugal
Banks Bldg Prod-Wood Paper&Related Products Telephone/Telecom/cable services Oil Comp-Integrated • Energy Bldg Prod-Cement/Aggreg Building-Heavy Construct Retail Public Thoroughfares
Appendix 4
Most Profitable industries in Brazil:
Average ROE The most contributable industries
Other Financial Companies
140% Commer Banks Non-US
Cosmetics&Toiletries 64% Steel-Producers
Tobacco 59% Other Financial Companies
Textile-Products 38% Telephone
Steel-Producers 29% Electric/Energy
Public Thoroughfares 25% Oil
Appendix 5
Most Profitable industries in Portugal
Average ROE The most contributable industries
Telephone/Telecom/cable services
25% Banks
Oil Comp-Integrated 23% Telephone/Telecom/cable
services
Public Thoroughfares 17,2% Energy
Retail 16,8% Retail
Building-Heavy Construct 16,5% Oil Comp-Integrated
Appendix 6
Appendix 7
The most leverage Industries in Brazil
Total Debt to Assets ratio
The most leverage Industries in Portugal
Total Debt to Assets ratio
E-Commerce/Products 91% Building-Heavy Construct 86%
Aerospace/Defense 71% Bldg Prod-Wood 76%
Transport-Rail 71,3% Retail 74%
Airlines 70% Public Thoroughfares 69%
Retail 70% Paper&Related Products 68%
Food-Meat Products 66% Energy 68%
Largest Compound industries: Brazil Comp ound factor Largest Compound Industries: Portugal Compo und factor Most contributable industries: Brazil Most contributable industries: Portugal
Airlines 14,1 Bldg Prod-Wood 29,2
Steel-Producers
Electric-Integrated
Textile-Products 7,3 Public Thoroughfares 10,2 Electric/Energ
y
Telephone-Integrated
Sugar 6,6 Telephone-Integrated 5,6 Oil Public
Thoroughfares
Aerospace/Defense 3,8 Building-Heavy
Construct
5,1 Airlines Bldg Prod-Wood
Retail 2,7 Retail-Misc/Diversified 3,8 Sugar
Retail-Misc/Diversifi ed
E-Commerce/Products
2,7 Cable/Satellite TV 3,5 Telephone Oil Comp-Integrated