A Work Project, presented as part of the requirements for the Award of a Master’s degree in Economics from the Nova School of Business and Economics.
EMPLOYMENT RESPONSES TO FISCAL CONSOLIDATIONS:
THE ROLE OF GENDER AND LABOUR MARKET DISCRIMINATION1
FRANCISCO VAZ DOS SANTOS2 33076
Work project carried out under the supervision of: José Albuquerque Tavares3
João Tovar Jalles4
03/01/2020
1 The usual disclaimer applies and any remaining errors are authors´ own responsibility. The opinions expressed herein are those of the authors and not necessarily those of their employers or any other institutions they are affiliated with.
2 Nova School of Business and Economics, Universidade Nova de Lisboa, Rua da Holanda, 1 Carcavelos 2775-405 Cascais. e-mail: 33076@novasbe.pt
3 Nova School of Business and Economics, Universidade Nova de Lisboa, Rua da Holanda, 1 Carcavelos 2775-405 Cascais. Email: jtavares@novasbe.pt
4 Portuguese Public Finance Council, Praca de Alvalade 6, 1700-036 Lisboa Portugal; REM/UECE, R. Miguel Lupi 20, 1249-078 Lisbon, Portugal; Centre for Globalization and Governance, Nova School of Business and Economics, Rua da Holanda, 1, 2775-405 Carcavelos, Portugal; email: joaojalles@gmail.com
1
Abstract
Using panel estimates of the widest possible country sample, for the longest period possible, we document for the first time the impact of consolidations on labour market participation by gender. We find that females’ employment response to expenditure-based adjustments is less expansionary than males’ one and that revenue-based consolidations are more harmful to males than to females, regardless of the discrimination level. When discrimination is low, the effects on females’ employment is qualitatively similar to males’ one, although quantitatively more elastic for males. In economies with high gender inequalities, tax-based consolidations are less recessionary to employment and expenditure-tax-based adjustments are less expansionary than in a more egalitarian world.
Keywords: Fiscal Adjustments, GDP Growth, Discrimination, Labour Market Participation
This work used infrastructure and resources funded by Fundação para a Ciência e a Tecnologia (UID/ECO/00124/2013, UID/ECO/00124/2019 and Social Sciences DataLab, Project 22209), POR Lisboa (LISBOA-01-0145-FEDER-007722 and Social Sciences DataLab, Project 22209) and POR Norte (Social Sciences DataLab, Project 22209).
2
1 Introduction
Government and public authorities often use fiscal adjustments and structural programs to balance the budget deficit in order to address economic and social unbalances. Policymakers must be aware of gender specific constraints that may influence the impacts of fiscal adjustments, delivering undesirable economic implications. The main purpose of this paper is, for the first time, to inform policymakers about these diversified effects, helping them to improve the design of the programs to be implemented.
The short-term effects of fiscal adjustments on output have been on the center of the discussion among authors in the last decades. Guajardo, Leigh and Pescatori (2014), Alesina et al. (2017) and Alesina, Favero and Giavazzi (2012) conclude similarly that tax-based adjustments are more harmful to output than expenditure-based consolidations. This paper moves into a novel approach, aiming to examine how and in which direction pre-existing gender inequality conditions determine the impact of fiscal adjustments by gender. Alesina, Ichino and Karabarbounis (2011) document that, historically, the women’s wage elasticity of labor supply tends to be higher, leading them to present lower participation rates than men. Plus, the authors argue that home chores are unequally distributed across genders, usually favouring men. As a consequence, males perform less home duties, devoting more time to market work (Burda, Hamermesh and Weil, 2007). As so, the aforementioned arguments may guide the impacts of fiscal consolidations across genders. Trough panel estimates we find that revenue-based consolidations are harmful to employment rate, whereas expenditure-based consolidations increase employment, whatever the gender considered. In contrast to Alesina, Ichino and Karabarbounis (2011) our estimates point that males are relatively more squeezed out of the market during tax-based consolidations than females. When discrimination level is low, the effects of adjustments on females’ employment is qualitatively similar to males’ one, although quantitatively more elastic for men. On the opposite, when discrimination is high, the impacts
3 across gender become qualitatively and quantitatively similar. Moreover, high discrimination leads females to abandon more the market when facing expenditure-based consolidations. In general, males’ employment reacts more to expenditure-based consolidation than females’ one, corroborating the role of women as caretakers of the entire family.
The remainder of the paper is organized as follows. Section 2 reports some pertinent literature on this theme. Section 3 describes the data to be used, defines fiscal consolidation episodes as well as revenue and expenditure-based adjustments. Section 4 defines the methodology and the econometric specification. Section 5 discusses the results on fiscal consolidations and gender inequality and its robustness. Section 6 concludes.
2 Literature Review
The literature on the gender gap in the labor market is relatively recent. It suggests that men and women present different elasticities of labour supply. Females’ one tends to be higher, with women performing more home duties and less market work (Alesina, Ichino and Karabarbounis, 2011). An analysis covering OCDE countries detects the same discrepancy between genders, when it comes to market or household duties, adding that women’s market hours resemble more the economic cycle fluctuations than men’s one (Burda, Hamermesh and Weil, 2007). The higher elasticity of labour supply of women means they are more sensible to changes on wages, abandoning the labour market easily when responding to negative shocks.
Different reasons are pointed out to justify the discrepancies in labour supply elasticities across genders. Alesina, Ichino and Karabarbounis (2011) explain it through a bargaining process between spouses which would affect the distribution of market, home goods and time spent in each sector. Labor supply would arise endogenously from the internal organization of the family, with men possessing a higher bargaining power in the couple decision of allocating time, possibly due to the importance that physical characteristics assumed to our ancestors. The
4 authors also argue that the individual who could find more substitutes to market work will have a higher elasticity of labor supply, finding at the same time that women present a comparative advantage in dedicating time to home duties, either because they are more productive in that sector, or due to pure discrimination - men are often offered higher wages. Men also tend to commit to higher wage careers, mainly due to differences in preferences between genders (Zafar, 2013). Burda, Hamermesh and Weil (2007) confirm that men’s higher wages lead them to perform less home chores and to work more in the market (and in total). As women perform more tiring activities in home than men, the females’ work effort in the market is reduced, leading married women to earn less (hourly) than married men, even when there are no differences in human capital between genders (Becker, 1985). Plus, in the past, when there were no substitutes to home duties, such as washing machines and vacuum cleaners, women had to devote more time to these chores. When these types of products were released, their devotion to market hours increased, as home care became “automatized” (Greenwood, Seshadri and Yorukoglu, 2005).
Technological and cultural changes within the family chore changed the historically course of women’s elasticity of labour supply (Alesina, Ichino and Karabarbounis, 2011). Specifically, progresses in the medical sector, such as breast milk substitutes and improvements in the obstetrician field, enabled females to increase their participation in the market (Albanesi and Olivetti, 2007). Females’ labour supply elasticity has been decreasing for the past 30 years, as women started to perceive employment as long term careers rather than a simple job (Goldin, 2006). Empirically, Blau and Kahn, (2007), found that women have a higher ratio of home duties over market work than men, although the gap has been decreasing in the last decades.
In order to balance the budget, fiscal adjustments may be based on revenue increases or on expenditure cuts. Most importantly, the question relies on which specific components are
5 managed when government choose one of the two sides. Using the concept of “fiscal impulse”5 to measure fiscal adjustments (or expansions) one identifies that, the majority of fiscal adjustments are made on the revenues side, through increases in taxes, particularly direct and indirect taxes on households. Direct taxes on businesses and social security contributions rank second in government priorities. Adjustments based on expenditure cuts are less frequent. On the expenditure side the components which are managed more frequently are public investment, transfers and government wages. Government non-wage consumption and subsidies do not emerge as first option to policymakers (Alesina et al., 1995). The composition of the adjustment and particularly the components manipulated becomes crucial to determine its success. Successful adjustments are mostly made on the expenditure side (about 80%), while adjustments made on revenue side fail more frequently (Alesina et al., 1995).
The effect of fiscal adjustments on output is relatively consensual among authors. Guajardo, Leigh and Pescatori, (2014) uses a new disruptive method6 to identify fiscal adjustments, concluding that consolidations have contractionary effects on output in the short-term, persisting up to five years. Moreover, the consolidations based on tax hikes are found to be more harmful for output than the ones based on expenditure cuts. Alesina et al. (2017) entails on a more exhaustive analysis, decomposing expenditure into transfers and government spending, but yielding the same conclusion. The author also documents that tax hikes conducts to deeper and longer recessions than spending cuts. Alesina, Favero and Giavazzi (2012) conclude similarly to the previous authors, but adding that sometimes, expenditure-based consolidations may even not generate a recession. Brinca et al., (2017) unveils that inequality extent the recessive effect of fiscal adjustments. Economies with higher income inequality will
5 The fiscal impulse is computed using the “unemployment adjusted primary deficit”. Any cyclical components or irrelevant discretionary fluctuations are disregarded, focusing only on government actions that influence fiscal policy. During the period 1960-1992 the authors identified 121 small and 66 strong adjustments in 20 OECD countries.
6 In opposition to the CAPB, the authors use historical policy reports to identify only discretionary changes in fiscal policy, similar to what Romer and Romer, (2010) did in its work.
6 face higher recessive impacts on output when facing a fiscal adjustment, due to a more prominent labour supply decrease. An empirically analysis of the German (low wage inequality) and Czech Republic (high wage inequality) economies corroborate the results, with lower output losses in Germany.
Finally, it is relevant for this paper to highlight the impact of fiscal adjustments in the labour market. Consolidations driven by labour tax hikes increase the level of unemployment rate (Nickell, 1997). Agnello et al. (2014) confirms these results, adding that the duration and the size of the tax-based fiscal adjustment expand the impact on the total unemployment rate, while expenditure-based consolidation do not produce significant effect on unemployment. Bova, Kolerus and Tapsoba (2015) use the Okun’s coefficient7 to measure the impact of fiscal consolidations on employment. They empirically find that fiscal adjustments impact positively the coefficient, meaning that employment becomes more reactive to output. Therefore, an output contraction (due to a fiscal adjustment) leads unemployment to increase when compared to normal times. Further investigation deduce that the Okun’s coefficient only reacts to expenditure-based adjustments and are unresponsive to tax increases.
3 Data
Aiming to determine and measure how fiscal consolidations and its type – tax-based or expenditure-based - impacts the contemporary change in output and employment by gender, we propose to run panel estimates of the widest possible country sample, for the longest period possible. To consult the initial countries for which data was collected please check Exhibit 1 in the appendix. At an early stage, the real Gross Domestic Product growth (GDPgrowth) will compose the left-hand side of the panel regressions, while the right side will incorporate the
7 The Okun’s coefficient measures the response of employment to changes in output. The coefficient may depend on institutions, labor market rigidities, costs created by employments protection laws or technological and training costs. The coefficient depends on each country features, varying accordingly.
7 dummy variables that identify fiscal consolidations and its type (Consolidation and Expenditure-based). Additionally, the usual controls as real GDP per capita (GDPpc) in local currency units (LCU), trade as a percentage of GDP (TradeGDP), investment as a percentage of GDP (InvGDP), the gross secondary enrolment (GrossSecEnr), political stability index (PolStab), the Gini index (GINI) and population (Pop) will be amassed as in (Tavares and Wacziarg, 2001). Although the time period for which data was collected covers the range 1982-2018, some variables such as GrossSecEnr, GINI and PolStab are not available for long period of times in some countries. Hence, this limited the number of observations.
Afterwards, we move to the impact of consolidations and its type on labour participation variables by gender. The dependent variables will be female and male employment as a percentage of the respective gender population over 15 years old (femEmp and maleEmp). Apart from the consolidation dummy variables, the covariates will incorporate the dependent variable lagged and the real GDP per capita. Male to female employment ratio (mfEmpRatio) and male to female labour force participation ratio (mfLFPRatio) will further be used as discrimination criteria. Finally, using the same procedure, we analyze the consolidation effects on employment by sector, where the female and male employment as a percentage of the respective gender employment in agriculture (femEmpAgr and maleEmpAgr), industry (femEmpInd and maleEmpInd) and services (femEmpSer and maleEmpSer) will operate as dependent variables. Although its different reliable original sources, all variables were directly gathered from the World Bank DataBank database, reinforcing the adequacy of the data and facilitating its processing. The majority of the variables are expressed in a 0-100 scale. The exceptions are the male to female ratios, measured in a 0-1 scale, the dummy variables identifying consolidation episodes, taking the values 0 or 1, Political Stability ranging from -2.5 to 2.5 and real GDP per capita and population which are expressed in total value.
8
3.1 Definition of Fiscal Consolidation Episodes
As the focus is on discretionary fiscal policies, the cyclical adjusted primary balance (CAPB) as a percentage of GDP will be used to define consolidation episodes once it corrects the budget balance from the impact of changes in some variables, namely inflation or real interest rates (Afonso, 2010). Furthermore, this measure is frequently used in the literature and by international organizations.
The CAPB (current LCU) is accessible in the World Economic Outlook (2019) from the International Monetary Fund (IMF). However, as it is only available for recent years, it limits the time range of our analysis. Further, it was divided by the GDP in current LCU (nomGDP) to obtain the CAPB as a percentage of GDP. Again, both variables were collected from the WorldBank DataBank dataset. To identify fiscal consolidation episodes, thresholds will be set, regarding changes in CAPB as a percentage of GDP over the years. The following table highlights the definitions which were tested to obtain the most reliable measure of fiscal consolidation.
Table 1– Definitions of fiscal consolidations.
Criteria Source
“The change in CAPB is at least 1.5 p.p. of GDP in 1 year.” (Alesina et al., 1995)
“The change in CAPB is at least 2 p.p. of GDP in 1 year or at least 1.5 p.p. of GDP per year in both 2 consecutive years.”
(Alesina and Ardagna, 1998)
“The cumulative change in CAPB is at least 5, 4, 3 p.p. of GDP in respectively 4, 3, or 2 consecutive years, or 3 p.p. in 1 year.”
(Giavazzi and Pagano, 1996)
Despite the use of all definitions to evaluate the impacts on output, we will focus on Alesina and Ardagna (1998) criteria, once it is the most recent one and identifies an empirical reliable number of fiscal consolidations as can been depicted in Table 2.
9
3.2 Definition of Expenditure and Revenue-Based Fiscal Consolidations
Relevant literature on fiscal consolidation episodes, as (Beetsma, Furtuna and Giuliodori, 2018), use a 50% threshold to classify the adjustment composition, setting that if more than 50% of the variation of the variable that identifies fiscal adjustment episodes comes from expenditures it will be classified as an expenditure-based consolidation. If the opposite is true, meaning that more than 50% of the variation comes from the revenues, the consolidation episode will be declared as tax-based. To access this, a dummy variable is constructed similarly to (Afonso and Jalles, 2012). Thus, a expenditure-based consolidation is determined as follows:
Expenditure-based = {
1, 𝑖𝑓 ∆𝑃𝑟𝑖𝑚𝐸𝑥𝑝𝑖,𝑡/Δ𝐶𝐴𝑃𝐵𝑖,𝑡 > 0.5 𝑎𝑛𝑑 𝐶𝑜𝑛𝑠𝑜𝑙𝑖𝑑𝑎𝑡𝑖𝑜𝑛 = 1
, 0, 𝑜𝑡ℎ𝑒𝑟𝑤𝑖𝑠𝑒.
where PrimExp (current LCU) represents the government expenditures excluding interest payments. It was obtained by subtracting the interest payments in current LCU (i) to the government expenditures in current LCU (Exp). So, an expenditure-based consolidation is identified whenever the first differences of primary expenditures over the first difference of CAPB is higher than 50%, given a consolidation episode. Table 2 depicts the number of consolidations identified by each criteria.
Table 2 – Number of consolidation episodes.
Criteria Expenditure-based Tax-based All
(Alesina et al., 1995) 83 200 283
(Alesina and Ardagna, 1998) 47 151 198
(Giavazzi and Pagano, 1996) 43 151 194
The numbers displayed are in accordance with (Alesina et al., 1995), which documents a smaller frequency of expenditure-based fiscal adjustments relatively to tax-based consolidations.
10
3.3 Other Data Considerations
To eliminate possible outliers from the data, each variable descriptive statistics and frequency histograms were carefully analyzed in order to detect unusual values. The econometric analysis may also help to mitigate outsiders due to the high number of countries and years. All in all, the results will not be undermined.
Although the CAPB is widely used in literature, it has been recently criticized due to the overidentification of fiscal contractionary episodes. Two main reasons are pointed out. First, the CAPB rises during “stock market booms” due to increases in capital gains and tax revenues. Second, sometimes authorities may increase taxes or reduce expenses to prevent the overheating of the economy. These attempts may be wrongly classified as fiscal consolidations. For a more exhaustive analysis we recommend for further investigations to exploit the “narrative approach”, where historical reports are used to identify consolidation episodes (Guajardo, Leigh and Pescatori, 2014).
Due to robustness concerns, other variables will be exploited later on this report. Female unemployment as a percentage of female labour force (femUne) and male unemployment as a percentage of male labour force (maleUne) will be tested alternatively to femEmp and maleEmp to capture the sensitiveness of the effects of consolidations on gender labour market participation. The variables mentioned above were also collected from de DataBank database.
4 Methodology and Econometric Specification
As primary task, the impact of fiscal consolidations - as a whole and discriminated by tax or expenditure-based - on output growth will be examined through the following fixed-effects panel model:
11 where 𝑌𝑖,𝑡 stands for real GDP growth for country i = 1,2,3…N in year t = 1,2,3…T. 𝑿𝑖,𝑡−1 is a vector of control variables that includes the natural logarithms of GDPpc and Pop, TradeGDP, InvGDP, GrossSecEnr, PolStab and GINI. All the controls are lagged to capture the delayed effect on output. The variables in logarithm aim to ease its interpretation and to deal with scale concerns. The vector 𝑭𝑖,𝑡 comprises the dummy variables identifying fiscal consolidation episodes as defined in section 3.1 and section 3.2. The term 𝜆𝑡 denotes the year fixed-effects
whereas 𝜇𝑖,𝑡 represents the error term. The panel regression comprises cluster standard errors to account for heteroskedasticity and correlation in individual (countries) errors.
This stage aims to gather conclusions on the effect of consolidations, corroborating the empirical findings specified in the literature review. If so, it will reinforce the adequacy of the data to test further predictions on gender inequalities and fiscal consolidations, which is the purpose of this paper.
Phase two of the report focus on the effects of fiscal adjustments on gender labour market participation. To test this impact, we use a dynamic panel model of the form:
𝐸𝑖,𝑡 = 𝛼 + 𝜃𝐸𝑖,𝑡−1+ 𝛿𝑭𝑖,𝑡+ 𝛾𝑙_𝐺𝐷𝑃𝑝𝑐𝑖,𝑡−1+ 𝜇𝑖,𝑡
where 𝐸𝑖,𝑡 will be either female and male employments rates (femEmp and maleEmp, respectively) and further female and male employment rates regarding the activity sector (femEmpAgr, maleEmpAgr, femEmpInd, maleEmpInd, femEmpSer and maleEmpSer, respectively) for country i = 1,2,3…N in year t = 1,2,3…T. 𝐸𝑖,𝑡−1 accounts for the lagged dependent variable, 𝑭𝑖,𝑡 is the vector identifying fiscal adjustment episodes, and 𝑙_𝐺𝐷𝑃𝑝𝑐𝑖,𝑡−1 is the lagged natural logarithm of real GDP per capita. 𝜇𝑖,𝑡 is the error term.
The dynamic model is estimated using a one-step system GMM estimator as in (Blundell and Bond, 1998) to account for the persistence of employment over time, the correlation of covariates (as Consolidation and Expenditure-based) with past and (2)
12 contemporaneous realisations of the error term, unobserved heterogeneity, heteroskedasticity and autocorrelation within individual errors. The option “small” was added to get the variance correction for finite samples (Windmeijer, 2005). Two types of instruments were used. The “GMM-style”, built on the Arellano-Bond logic of using lags of dependent variable, was restricted up to lag number 4, to deal with possible loss of efficiency due to the huge number of instruments (Roodman, 2009). In the “IV-style” were included the time effects. The “system” GMM estimator provide substantial advantages when compared to the “difference” GMM estimator, which is known to be a possible biased estimator, mainly when in presence of high persistence of the series (Blundell and Bond, 1998). Even so, due to robustness concerns both estimators were tested. Both performed good regarding consistency and delivered quite similar coefficient’s signs and values.
The effects of consolidation episodes on employment will be tested with no restrictions first, and then using the median values of the male to female ratios specified in section 3, aiming to split the sample between high and low values of gender inequality conditions.
5 Results
5.1 Baseline
The results regarding the impact of fiscal consolidations on output growth are presented in Table 3. Columns 2, 3 and 4 depict the impact of consolidations as a whole, whereas columns 5, 6 and 7 illustrate the impact of tax-based and expenditure-based consolidations. All the definitions listed on Table 1 perform qualitatively similarly. As previously explained, only coefficients regarding Alesina and Ardagna (1998) criteria to identify fiscal consolidation episodes will be interpreted. Regarding consolidation episodes as a whole (column 3), the signs
13
Table 3 – Effects of fiscal consolidations on output.
Notes: The criterion are the ones from Table 1. All models are estimated with a constant and year fixed-effects. Robust t-statistics are presented in parentheses. ***p < 0.01, **p < 0.05, *p < 0.1.
of the usual controls corroborate previous literature on this subject. The exceptions are the Gini coefficient, investment as a percentage of GDP and gross secondary enrolment rate. Nevertheless, they are not statistically significant. In fact, the only statistically significant controls are trade as a percentage of GDP and the natural logarithms of real GDP per capita and population. The variable of interest, Consolidation, delivers a significant negative short-term impact on output, decreasing GDP growth by 1.96 p.p., as in accordance with previous literature. The output fall is caused by a labor supply decrease. When the adjustment is made through cuts in government spending, as debt decreases, wages increase, leading economic agents to expect higher future income. Agents decrease their labor supply as they anticipate higher earnings, leading output to drop in the short run. When the adjustment is made through tax hikes, the latter effect is combined with a substitution effect, as wages are more taxed. Similarly, labor supply drives output to fall (Brinca et al., 2017).
Dependent
variable GDP growth
Criteria Alesina (1995) Alesina (1998) Giavazzi (1996) Alesina (1995) Alesina (1998) Giavazzi (1996) Consolidation -1.575*** (-3.71) -1.960*** (-4.37) -0.784* (-1.87) -1.911*** (-3.76) -2.546*** (-4.68) -1.605*** (-2.78) Expenditure-based 0.537 (0.85) 1.592** (2.38) 1.727 (1.60) L.ln(GDPpc) -2.075*** (-2.96) -2.534*** (-3.26) -2.488*** (-2.90) -2.622*** (-3.02) -2.966*** (-2.75) -2.875** (-2.41) L.InvGDP -0.035 (-0.75) -0.021 (-0.43) 0.019 (0.40) -0.064 (-1.10) -0.055 (-0.92) -0.015 (-0.26) L.TradeGDP 0.052*** (3.49) 0.049*** (3.22) 0.051*** (3.26) 0.048*** (3.17) 0.044*** (2.83) 0.045*** (2.81) L.GrossEnrSec 0.002 (0.12) -0.000 (-0.01) 0.002 (0.13) 0.001 (0.04) -0.005 (-0.25) 0.001 (0.06) L.PolStab 0.926 (1.24) 0.662 (0.88) 0.542 (0.66) 1.549* (1.82) 1.238 (1.46) 1.261 (1.38) L.GINI 0.034 (0.51) 0.033 (0.47) 0.012 (0.16) -0.066 (-0.83) -0.079 (-0.92) -0.068 (-0.74) L.ln(Pop) 15.904*** (3.24) 13.924*** (3.47) 12.031*** (2.69) 14.513*** (2.99) 12.343*** (2.73) 10.352** (2.45) Constant -238.040*** (-2.98) -200.786*** (-2.69) -170.267** (-2.31) -203.654** (-2.58) -163.467** (-2.19) -131.402* (-1.87) Observations 705 690 681 607 597 590 No. Countries 74 73 73 65 65 65 R2 (within) 0.497 0.500 0.479 0.528 0.527 0.504
14 More interesting is the decomposed effect of consolidations. Now, compared with the previous case, the GINI coefficient sign is in line with the economic theory (column 6). One depicts that the negative impact on output comes from tax-based adjustments. Once Expenditure-based is a dummy variable which assumes value 1 if the fiscal adjustment is done through the expenditures side, its coefficient will capture the difference between expenditure-based consolidations and the remaining episodes. Thus, the tax-expenditure-based effect is now measured by the coefficient of Consolidation. As argued by Alesina et al., (2017) and Guajardo, Leigh and Pescatori, (2014), we also state that tax-based consolidations damage more output than expenditure-based ones. Tax-based consolidation episodes induce a decrease in the real GDP growth of 2.546 p.p.. The difference from an expenditure-based consolidation to any other episode is 1.592 p.p., given by the coefficient of Expenditure-based. As so, expenditure-based consolidations are prone to boost short-term output growth, as in accordance with Alesina, Favero and Giavazzi (2012).
As the main goal of the work project is to capture for the first time the relationships between fiscal adjustments and gender inequalities, several specifications were carried out. First, the impacts of consolidations on labour market participation by gender were tested. Table
4 displays the results. The employment process is quite similar across genders, as it is illustrated
by the resemblance of the significant coefficients of the lagged value of employment rate. The effects on female and male employment corroborate the GDP movements during consolidation episodes, either they are made on the revenue or expenditure side.
Tax-based consolidations shrink employment in both cases, suggesting that the substitution effect more than compensates the income effect. The impact on males is more pronounced than in females, with employment rate decreasing 0.906 p.p. and 2.585 p.p., respectively. Both coefficients are statistically significant. Despite the literature pointing higher elasticity of labour supply for women as in (Alesina, Ichino and Karabarbounis, 2011), we find
15
Table 4 - Effects of consolidations on female and male employment.
Notes: All models are estimated using the one-step system GMM estimator as in (Blundell and Bond, 1998). The p-values for the tests of first and second-order autocorrelation are given by AR (1) and AR (2), respectively. The Sargan test presents the p-values for the over-identifying restrictions. Robust t-statistics are presented in parentheses. ***p < 0.01, **p < 0.05, *p < 0.1.
that men present more elastic responses to tax-based consolidations. Some factors may justify these findings. First, under the data constraints (regarding the time range) that we face in our estimates, the females’ labour elasticity is not as big as it would be in a different scenario, once it has been decreasing for the past few years. Also, males commit more to higher wage careers than females (Zafar, 2013) and this commitment is less elastic to changes in taxes (Alesina, Ichino and Karabarbounis, 2011). Under discretionary taxes, men wages will be more affected as their earnings are in general higher, enlarging the substitution effect. Besides, men’s higher wages induces a higher demand for leisure due to income effects in preferences (Ohanian, 2013). Thus, the higher demand for leisure may also reinforce the labour market exit.
Expenditure-based consolidations increase males’ employment rate more than females’ one. The difference from the impact of a expenditure-based consolidation to any other episode in the female employment rate is 1.414 p.p. whereas in the male’s case is 3.461 p.p.. The impact for males is almost twice as large as the impact for females. The lower significant impact on female employment corroborates the role of expenditure substitutes that women undertake. As
Dependent variable Female employment
(% of female population)
Male employment (% of male population) Lagged Dependent variable 1.001***
(57.62) 1.015*** (50.74) 0.958*** (53.54) 0.939*** (36.72) Consolidation -0.322 (-0.89) -0.906* (-1.81) -1.428*** (-2.91) -2.585*** (-4.00) Expenditure-Based 1.414** (2.14) 3.461*** (3.43) L.ln(GDPpc) 0.015 (0.27) -0.041 (-0.57) 0.034 (0.61) 0.162** (2.11) Constant -0.301 (-0.35) 0.086 (0.09) 2.522* (1.91) 2.297 (1.29) Observations 1604 1229 1604 1229 No. Countries 81 73 81 73 AR (1) 0.000 0.000 0.000 0.000 AR (2) 0.972 0.616 0.011 0.144 Sargan test 0.938 0.990 0.980 0.992
16 in the past 30 years transfers became the more relevant component of government expenses (Alesina et al., 1995), a cut in government spending will affect more the substitutes of this type of expenditure. As females assume the leading role in home chores, childcare or health care, they will be more harmed than men, hence moving less into the labour market.
The pre-existing gender inequality conditions may change the previous results. We test in what direction high or low values of discrimination affect the impacts of consolidations on female and male employment rates. To access it, our sample was restricted, using thresholds on variables denoting market participation discrimination such as the male to female employment ratio and the male to female labour force participation ratio. As some female indicators assume significant low values, particularly in developing countries, the ratios will exhibit high averages, causing the sample above the average to present few observations. In order to get a decent number of observations below and above the threshold we use the median instead. Table
5 portrays this scenario. If above the median, we are in presence of high female discrimination.
When the opposite happens, females are not (or at least less) discriminated.
Table 5 – Descriptive statistics of male to female discrimination ratios.
The impacts on female and male employment rates given the discrimination level are presented in Table 6. As before, the employment processes remain stable across genders, whatever the level of discrimination considered. As one can observe, even using the median as threshold, the sub-samples regarding high discrimination level do not present significant coefficients for consolidation episodes in the females’ case. The first important conclusion regarding female results is that when discrimination is low (columns 3, 5) the impact of tax-
Male to female ratio
Discrimination criteria Employment Labour Force Participation
Observations 4628 4785
Average 1.727 1.638
17
Table 6 - Effects of tax-based and expenditure-based consolidations given the discrimination level.
Notes: All models are estimated using the one-step system GMM estimator as in (Blundell and Bond, 1998). The p-values for the tests of first and second-order autocorrelation are given by AR (1) and AR (2), respectively. The Sargan test presents the p-values for the over-identifying restrictions. Robust t-statistics are presented in parentheses. ***p < 0.01, **p < 0.05, *p < 0.1
Dependent variable Female employment (% of female population) Male employment (% of male population) Discrimination criteria Employment ratio
(male/female) LFP ratio (male/female) Employment ratio (male/female) LFP ratio (male/female)
Discrimination level High Low High Low High Low High Low
Lagged Dependent Variable 0.997*** (42.01) 0.996*** (37.94) 0.979*** (33.93) 1.002*** (48.04) 0.993*** (55.70) 0.925*** (23.48) 0.973*** (70.36) 0.937*** (25.29) Consolidation -0.203 (-0.39) -1.588*** (-4.88) 0.101 (0.12) -1.738*** (-5.15) -1.480** (-2.61) -2.026*** (-2.85) -2.011*** (-3.01) -2.209*** (-3.19) Expenditure-based consolidation 0.220 (0.46) 3.061*** (4.24) 0.025 (0.03) 2.672*** (3.70) 1.101 (1.38) 4.822*** (3.11) 1.771* (1.74) 3.894*** (2.88) L.ln(GDPpc) -0.006 (-0.10) 0.020 (0.15) 0.019 (0.28) 0.019 (0.14) -0.054 (1.02) 0.244 (1.53) 0.070 (1.32) 0.190 (1.22) Constant 0.460 (0.51) 0.322 (0.27) 0.797 (0.79) 0.027 (0.02) -0.171 (-0.14) 2.175 (1.41) 1.055 (0.86) 2.049 (1.09) Observations 529 700 472 757 529 700 472 757 No. Countries 45 46 39 48 45 46 39 48 AR (1) 0.020 0.000 0.023 0.000 0.002 0.000 0.001 0.000 AR (2) 0.350 0.880 0.406 0.932 0.324 0.279 0.375 0.218 Sargan test 1.000 1.000 1.000 1.000 1.000 1.000 1.000 1.000
18 based consolidations becomes higher. Given low employment discrimination, a tax-based episode decreases female employment rate by 1.588 p.p., on average. When male to female employment ratio is below the median, males and females have a relatively similar presence in the market. As females engage more in market, they react more. When male to female labour force participation ratio is used to set the discrimination level the results are qualitatively similar to the one’s commented above, although slightly quantitatively different in some cases. As data for labour force participation by gender is more demanding than data for the employment rate, it becomes relatively harder to measure it in developing countries. That is why we use employment rate as dependent variable in this work project.
Regarding males' employment rate (columns 6, 7, 8 and 9), the higher the female discrimination, the lower are the impacts either of tax or expenditure-based consolidations. As men are more in the market, with a strengthened position relatively to women, the combination between the substitution and the income effect delivers lower impacts of tax-based adjustments, as women are not an alternative source of income. During expenditure-based episodes men enter less in the market when male to female ratios are higher. This outcome is particularly expected, as the already high presence of males in the market blocks the entrance.
As a general point, one can observe that when discrimination is high, the response of employment is less contractionary to the effects of tax-based consolidations and less expansionary when facing expenditure-based consolidation. Moreover, when discrimination is low, the impact of consolidations on female employment rate is qualitatively similar to the impact on male employment rate, although quantitatively less elastic, either the consolidation is tax or expenditure-based.
Finally, we study the impact of consolidations on female and male employment rates by sector of activity. By now, we found that typically, the response of males’ employment rates to consolidations, either revenue or expenditure-based, are more elastic than the response of
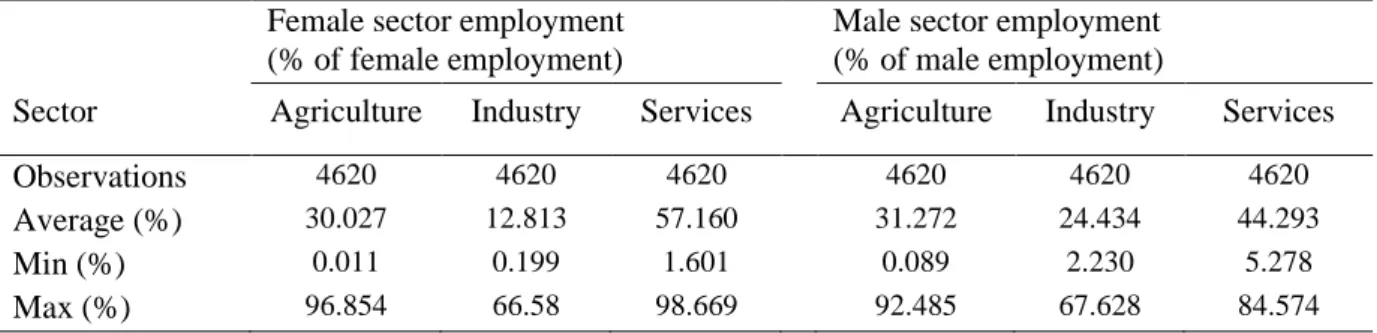
19 females’ employment rates. As expenditure-based adjustments mostly affect the public sector, it must be in the private sector that male employment increases the most. Descriptive statistics on employment by sector and gender are presented in Table 7. The content is in accordance with Zafar, (2013), who states that men major often in technical programs, such as engineering, whereas women pursue areas such as education. This leads females to be mostly employed in the services sector and males in the industrial sector.
Table 7 – Descriptive statistics of male and female employment by sector.
Table 8 displays the impacts of consolidations on employment by sector. An
expenditure-based consolidation is particularly onerous to the services sector, either to women or men. Both genders move out from this sector when spending cuts are carried out. Some of the individuals will move to a different sector, as expenditure-based consolidations increase employment in the agricultural and in the industrial sector. The ones who can not find a job in any of the other sectors will be forced to exit the labour market. As the overall employment rate, whatever the gender considered, increases during expenditure-based adjustments (see
Table 4) one can state that most of the employees move to a different sector.
Note that most of the public institutions belong to the services sector. As females have a considerable high presence in this sector relatively to men, a higher number of women is moving out from this sector. Regarding the industrial sector, not only men’s employment rates increase more when facing spending cuts (1.419 p.p. for males against 1.062 p.p. for females) as their presence in this sector almost doubles the presence of female employees. Due to the high specialization of males in the industrial field it is easier for them to move from the services
Female sector employment (% of female employment)
Male sector employment (% of male employment)
Sector Agriculture Industry Services Agriculture Industry Services
Observations 4620 4620 4620 4620 4620 4620
Average (%) 30.027 12.813 57.160 31.272 24.434 44.293
Min (%) 0.011 0.199 1.601 0.089 2.230 5.278
20
Table 8 - Effects of tax-based and expenditure-based consolidation on male and female employment
by sector.
Notes: All models are estimated using the one-step system GMM estimator as in (Blundell and Bond, 1998). The p-values for the tests of first and second-order autocorrelation are given by AR (1) and AR (2), respectively. The Sargan test presents the p-values for the over-identifying restrictions. Robust t-statistics are presented in parentheses. ***p < 0.01, **p < 0.05, *p < 0.1.
to the industrial sector when their jobs are affected by government spending cuts. Regarding tax-based consolidation it is also on the industrial sector than we perceive a significant difference between the impact on males and females’ employment rates (-407 p.p. for males and -1.240 p.p. for females). The males’ response is clearly more elastic in this sector, suggesting than men abandon significantly more the industrial sector during revenue-based adjustment than females. During tax-hikes, men move primarily to the agriculture sector whereas women opt by the services sector, due to the higher expertise of the latter in this area. Nevertheless, as the overall impact of tax-based adjustment leads employment rate to fall for both genders, we state that during these episodes most individuals are actually exiting the labour market instead of moving among sectors. Thus, it becomes clear that the differences in inflows and outflows to the market, when facing expenditure-based or tax-based consolidations, respectively, is more pronounced in males’ case and is mainly driven by the industrial sector. As a final note one should not neglect the second order correlation of the errors when
Dependent variable Female sector employment (% of female employment)
Male sector employment (% of male employment)
Sector Agriculture Industry Services Agriculture Industry Services Lagged Dependent variable 0.968*** (125.08) 0.932*** (41.77) 0.972*** (95.97) 0.970*** (139.43) 0.955*** (54.29) 0.994*** (70.06) Consolidation -0.270 (-0.78) -0.407 (-1.52) 0.920** (2.17) 0.553** (2.36) -1.240*** (-3.54) 0.600 (1.57) Expenditure-based 0.780 (1.26) 1.062* (1.85) -1.864** (-2.65) 0.956 (1.48) 1.419** (2.09) -1.903*** (-3.19) L.ln(GDPpc) -0.066 (-1.13) -0.005 (-0.07) -0.046 (-0.71) 0.055 (0.94) -0.109 (-1.66) -0.010 (-0.16) Constant 0.839 (1.20) 0.777 (0.83) 3.040*** (3.47) -0.554 (-0.82) 2.591** (2.21) 0.818 (1.04) Observations 1229 1229 1229 1229 1229 1229 No. Countries 73 73 73 73 73 73 AR (1) 0.002 0.000 0.000 0.001 0.000 0.000 AR (2) 0.393 0.062 0.347 0.023 0.005 0.024 Sargan test 0.996 0.990 0.989 0.990 0.984 0.988
21 male employment rate by sector is used as dependent variable. Although it is not the case along the paper, one may alert for some consistency concerns.
5.2 Robustness and Sensitivity
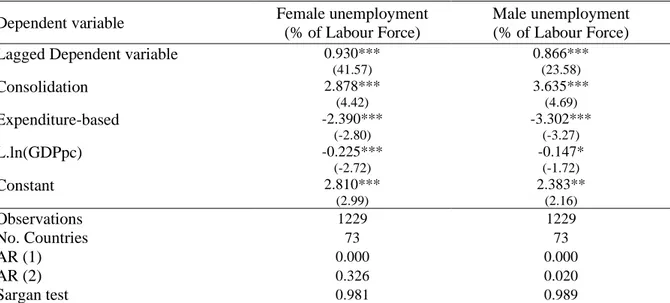
In this section we investigate the robustness of the results, testing if consolidation episodes deliver similar impacts on an alternative dependent variable - unemployment rate as a percentage of labour force. As labour force includes only people who are actually working or actively looking for a job, we expect more significant and active responses to consolidations episodes, as the economically inactive population, such as students or pensioners are not taken into account. The results regarding the overall impact of tax-based and expenditure-based consolidations on unemployment rates are depicted in Table 9.
Table 9 - Effects of tax-based and expenditure-based consolidations on unemployment across genders.
Notes: All models are estimated using the one-step system GMM estimator as in (Blundell and Bond, 1998). The p-values for the tests of first and second-order autocorrelation are given by AR (1) and AR (2), respectively. The Sargan test presents the p-values for the over-identifying restrictions. Robust t-statistics are presented in parentheses. ***p < 0.01, **p < 0.05, *p < 0.1.
As predicted, the impacts of tax-based and expenditure-based consolidations are now more significant and in general more pronounced. More important, the results are in line with when employment to population rates are used. Tax-based consolidations increase relatively
Dependent variable Female unemployment
(% of Labour Force)
Male unemployment (% of Labour Force)
Lagged Dependent variable 0.930***
(41.57) 0.866*** (23.58) Consolidation 2.878*** (4.42) 3.635*** (4.69) Expenditure-based -2.390*** (-2.80) -3.302*** (-3.27) L.ln(GDPpc) -0.225*** (-2.72) -0.147* (-1.72) Constant 2.810*** (2.99) 2.383** (2.16) Observations 1229 1229 No. Countries 73 73 AR (1) 0.000 0.000 AR (2) 0.326 0.020 Sargan test 0.981 0.989
22 more male unemployment, whereas spending cuts present lower impacts on female unemployment rate.
The impacts of consolidation episodes on unemployment rates using male to female ratios to access the discrimination level are presented in Table 10. Now, females’ unemployment response to consolidations episodes is qualitatively and qualitatively similar to men’s one, whatever the discrimination context. Still, despite the minimal differences, men abandon more the market during tax-based episodes than females and enter more in the market during expenditure-based ones.
Now it is possible to access the response of females’ unemployment when the discrimination level is high. Note that in Table 4 female employment rate did not budge. Now, high inequality promotes less elastic responses of female unemployment rate to expenditure-based consolidations, meaning that women are retreating more from the labour market when discrimination is high. As argued by Alesina, Ichino and Karabarbounis (2011), in high discrimination countries, the unequal distribution of chores at home becomes even more unbalanced across genders, forcing women to abandon relatively more the market to offset the loss of benefits that the couple faces when government reduces expenditures.
6 Conclusion
Public authorities may use fiscal consolidations to balance the budget. Depending whether they choose to increase taxes or cut expenses, they must be aware that this decision will trigger different economic implications, namely on labour market participation by gender, as males and females respond differently to revenue-based or expenditure-based consolidations. Through panel estimates we confirm that tax-based consolidations are more harmful to output than expenditure-based ones. Thereafter, we move to a novel approach, documenting the impacts on labour market participation by gender. We find that tax-based consolidations
23
Table 10 - Effects of tax-based and spend-based consolidations given discrimination thresholds on female and male unemployment.
Notes: All models are estimated using the one-step system GMM estimator as in (Blundell and Bond, 1998). The p-values for the tests of first and second-order autocorrelation are given by AR (1) and AR (2), respectively. The Sargan test presents the p-values for the over-identifying restrictions. Robust t-statistics are presented in parentheses. ***p < 0.01, **p < 0.05, *p < 0.1.
Dependent variable Female unemployment (% of Labour Force) Male unemployment (% of Labour Force) Discrimination criteria Employment ratio
(male/female) LFP ratio (male/female) Employment ratio (male/female) LFP ratio (male/female)
Driscimination level High Low High Low High Low High Low
Lagged Dependent Variable 0.956*** (47.53) 0.900*** (27.59) 0.897*** (24.06) 0.924*** (36.63) 0.957*** (37.19) 0.830*** (21.01) 0.962*** (28.29) 0.818*** (15.58) Consolidation 2.280*** (2.77) 2.528*** (4.41) 1.923*** (2.84) 2.973*** (4.44) 2.480*** (3.31) 2.814*** (3.53) 1.962*** (2.75) 3.301*** (3.68) Expenditure-based -2.048* (-1.86) -3.669*** (-3.12) -2.492** (-2.45) -3.159** (-2.45) -2.742** (-2.34) -3.799*** (-3.07) -3.123** (-2.30) -2.610** (-2.04) L.ln(GDPpc) -0.095 (-1.64) -0.266** (-2.13) -0.128* (-1.98) -0.288** (-2.46) -0.090 (-1.58) -0.412*** (-3.40) -0.119 (-1.97) -0.456** (-2.31) Constant 1.334** (2.15) 3.451** (2.29) 2.358** (2.65) 3.484** (2.54) 1.209* (1.86) 5.638*** (3.82) 1.527* (1.97) 6.189** (2.50) Observations 529 700 472 757 529 700 472 757 No. Countries 45 46 39 48 45 46 39 48 AR (1) 0.001 0.000 0.001 0.000 0.000 0.000 0.001 0.000 AR (2) 0.098 0.874 0.020 0.387 0.233 0.046 0.223 0.016 Sargan test 1.000 1.000 1.000 1.000 1.000 1.000 1.000 1.000
24 shrink employment and that expenditure-based consolidations increase it, whatever the gender considered. In contrast with previous literature, our estimates point higher impacts of revenue-based consolidations for males than for females. In presence of low female discrimination, the impact of consolidations on females’ employment rate is qualitatively similar to the impact on males’ one. Still, men’s response is quantitatively more elastic, either the consolidation is tax or expenditure-based. Plus, when discrimination is low, the impact of tax-based consolidations is more pronounced for both genders. By using unemployment rate alternatively to employment rate, we are able to access the impacts of expenditure-based consolidations when discrimination is high. We find that females abandon more the market when submitted to high discrimination, as gender inequality boosts their burden of home chores.
Finally, whatever the discrimination level considered, the response of male’s employment to expenditure-based adjustments is always more expansionary than females’ one, mainly due to the role women undertake as expenditure substitutes. The different impacts across gender are mainly driven by movements in the industrial sector. In economies with high gender inequalities, tax-based consolidations are less recessionary to employment and expenditure-based adjustments are less expansionary than in a more egalitarian world.
References
Afonso, A. (2010) ‘Expansionary fiscal consolidations in Europe: New evidence’, Applied Economics Letters, 17(2), pp. 105–109.
Afonso, A. and Jalles, J. T. (2012) ‘Measuring the success of fiscal consolidations’, Applied Financial Economics, 22(13), pp. 1053–1061.
Agnello, L. et al. (2014) ‘Fiscal adjustments, labour market flexibility and unemployment’, Economics Letters, 124(2), pp. 231–235.
Albanesi, S. and Olivetti, C. (2007) ‘Gender Roles and Technological Progress’, NBER Working Paper Series.
Alesina, A. et al. (1995) ‘Fiscal Expansions and Adjustments in OECD Countries’, Economic Policy, 10(21), pp. 205–248.
Alesina, A. et al. (2017) The Effects of Fiscal Consolidations: Theory and Evidence. Alesina, A. and Ardagna, S. (1998) ‘Tales of fiscal adjustment’, Economic Policy, 13(27), pp.
25 Alesina, A. F., Favero, C. A. and Giavazzi, F. (2015) ‘The Output Effect of Fiscal
Consolidations’, Journal of International Economics, 96(S1), pp. S19–S42.
Alesina, A., Ichino, A. and Karabarbounis, L. (2011) ‘Gender-based taxation and the division of family chores’, American Economic Journal: Economic Policy, 3(2), pp. 1–40. Becker, G. S. (1985) ‘Human Capital, Effort, and the Sexual Division of Labor’, Journal of
Labor Economics, 3(1), pp. S33–S58.
Beetsma, R., Furtuna, O. and Giuliodori, M. (2018) Revenue- versus spending-based consolidation plans: the role of follow-up, ECB Working Paper Series No 2178. 2178. Blau, F. D. and Kahn, L. M. (2007) ‘Changes in the labor supply behavior of married women:
1980-2000’, Journal of Labor Economics, 25(3), pp. 393–438.
Blundell, R. and Bond, S. (1998) ‘Initial conditions and moment restrictions in dynamic panel data models’, Journal of Econometrics, 87(1), pp. 115–143.
Bova, E., Kolerus, C. and Tapsoba, S. J. A. (2015) ‘A fiscal job? An analysis of fiscal policy and the labor market’, IZA Journal of Labor Policy, 4, pp. 1–17.
Brinca, P. et al. (2017) ‘Fiscal Consolidation Programs and Income Inequality’, SSRN Electronic Journal.
Burda, M., Hamermesh, D. and Weil, P. (2007) ‘Total Work, Gender and Social Norms’ Journal of Population Economics, 26(2), pp. 507–530.
Giavazzi, F. and Pagano, M. (1996) ‘Non-Keynesian Effects of Fiscal Policy Changes: International Evidence and the Swedish Experience’, Swedish Economic Policy Review, 3(1), pp. 67–103.
Goldin, C. (2006) ‘The quiet revolution that transformed women’s employment, education, and family’, American Economic Review, 96(2), pp. 1–21.
Greenwood, J., Seshadri, A. and Yorukoglu, M. (2005) ‘Engines of liberation’, Review of Economic Studies, 72(1), pp. 109–133.
Guajardo, J., Leigh, D. and Pescatori, A. (2014) ‘Expansionary austerity? International evidence’, Journal of the European Economic Association, 12(4), pp. 949–968. Nickell, S. (1997) ‘Unemployment and Labor Market Rigidities: Europe versus North
America’, Journal of Economic Perspectives, 11(3), pp. 55–74.
Ohanian, L. E. (2013) ‘Back to the Future with Keynes’, in Revisiting Keynes.
Romer, C. D. and Romer, D. H. (2010) ‘The macroeconomic effects of tax changes: Estimates based on a new measure of fiscal shocks’, American Economic Review, 100(3), pp. 763–801.
Roodman, D. (2009) ‘How to do xtabond2: An introduction to difference and system GMM in Stata’, Stata Journal, 9(1), pp. 86–136.
Tavares, J. and Wacziarg, R. (2001) ‘How democracy affects growth’, European Economic Review, 45(8), pp. 1341–1378.
Windmeijer, F. (2005) ‘A finite sample correction for the variance of linear efficient two-step GMM estimators’, Journal of Econometrics, 126(1), pp. 25–51.
Zafar, B. (2013) ‘College major choice and the gender gap’, Journal of Human Resources, 48(3), pp. 545–595.
Appendix
Exhibit 1 – List of countries included in the initial sample.
Afghanistan, Albania, Algeria, Angola, Anguilla, Antigua and Barbuda, Argentina, Armenia, Aruba, Australia, Austria, Azerbaijan, The Bahamas, Bahrain, Bangladesh, Barbados, Belarus, Belgium, Belize, Benin, Bhutan Bolivia, Bosnia and Herzegovina, Botswana, Brazil, Brunei Darussalam, Bulgaria, Burkina Faso, Burundi, Cabo Verde, Cambodia, Cameroon, Canada, Central African Republic, Chad, Chile, China, Colombia, Comoros, Democratic Republic of the Congo, Republic of Congo, Costa Rica, Croatia, Cyprus, Czech Republic, Côte d'Ivoire, Denmark, Djibouti, Dominica, Dominican Republic, Ecuador, Egypt, El Salvador, Equatorial Guinea, Eritrea, Estonia, Eswatini, Ethiopia, Fiji, Finland, France, Gabon, The Gambia, Georgia, Germany, Ghana, Greece, Grenada, Guatemala, Guinea, Guinea-Bissau, Guyana, Haiti, Honduras, Hong Kong SAR, Hungary, Iceland, India, Indonesia, Iran, Iraq, Ireland, Israel, Italy, Jamaica, Japan, Jordan, Kazakhstan, Kenya, Kiribati, Korea, Kosovo, Kuwait, Kyrgyz Republic, Lao P.D.R., Latvia, Lebanon, Lesotho, Liberia, Libya, Lithuania, Luxembourg, Macao SAR, Madagascar, Malawi, Malaysia, Maldives, Mali, Malta, Marshall Islands, Mauritania, Mauritius, Mexico, Micronesia, Moldova, Mongolia, Rep. of Montenegro, Morocco, Mozambique, Myanmar, Namibia, Nepal, Netherlands, New Zealand, Nicaragua, Niger, Nigeria, North Macedonia, Norway, Oman, Pakistan, Panama, Papua New Guinea, Paraguay, Peru, Philippines, Poland, Portugal, Puerto Rico, Qatar, Romania, Russia, Rwanda, San Marino, Saudi Arabia, Senegal, Serbia, Seychelles, Sierra Leone, Slovak Republic, Slovenia, Solomon Islands, South Africa, South Sudan, Spain, Sri Lanka, St. Kitts and Nevis, St. Lucia, St. Vincent and the Grenadines, Sudan, Suriname, Sweden, Switzerland, Syria, São Tomé and Príncipe, Tajikistan, Tanzania, Thailand, Timor-Leste, Togo, Tonga, Trinidad and Tobago, Tunisia, Turkey, Tuvalu, Uganda, Ukraine, United Arab Emirates, United Kingdom, United States, Uruguay, Uzbekistan, Vanuatu, Vietnam, Yemen, Zambia, Zimbabwe.