Expression of myogenes in
longissimus dorsi
muscle during prenatal
development in commercial and local Piau pigs
Evelyze Pinheiro dos Reis
1, Débora Martins Paixão
1, Otávio José Bernardes Brustolini
2, Fabyano Fonseca e
Silva
1, Walmir Silva
1, Flávio Marcos Gomes de Araújo
3, Anna Christina de Matos Salim
3, Guilherme
Oliveira
4and Simone Eliza Facioni Guimarães
11
Departamento de Zootecnia, Universidade Federal de Viçosa (UFV), Viçosa, MG, Brazil.
2
Departamento de Bioquímica Agrícola, Universidade Federal de Viçosa (UFV), Viçosa, MG, Brazil.
3
Fiocruz, Centro de Pesquisas René Rachou, Belo Horizonte, MG, Brazil.
4
Vale Technology Institute, Belém, PA, Brazil.
Abstract
This study used qRT-PCR to examine variation in the expression of 13 myogenes during muscle development in four prenatal periods (21, 40, 70 and 90 days post-insemination) in commercial (the three-way Duroc, Landrace and Large-White cross) and local Piau pig breeds that differ in muscle mass. There was no variation in the expression of
theCHD8, EID2B, HIF1AN, IKBKB, RSPO3, SOX7 and SUFU genes at the various prenatal ages or between
breeds. TheMAP2K1 and RBM24 genes showed similar expression between commercial and Piau pigs but greater
expression (p < 0.05) in at least one prenatal period. Pair-wise comparisons of prenatal periods in each breed showed that only theCSRP3, LEF1, MRAS and MYOG genes had higher expression (p < 0.05) in at least one prena-tal period in commercial and Piau pigs. Overall, these results identified theLEF1 gene as a primary candidate to ac-count for differences in muscle mass between the pig breeds since activation of this gene may lead to greater myoblast fusion in the commercial breed compared to Piau pigs. Such fusion could explain the different muscularity between breeds in the postnatal periods.
Keywords: commercial line, gene expression, myogenesis, pig, Piau breed.
Received: November 13, 2015; Accepted: February 20, 2016.
Introduction
Myogenesis is a prenatal process that involves the formation of muscle fibers through changes in gene expres-sion and cell phenotype, and is influenced by genetic and environmental factors (Te Paset al., 2005). The size and number of muscle fibers determine muscle mass since skel-etal muscle growth depends on the number of fibers formed during myogenesis and on postnatal muscle hypertrophy, which is limited by physiological and genetic factors (Rehfeldtet al., 2000).
During prenatal development, two waves of myoblast proliferation and fusion give rise to primary and secondary muscle fibers (Wigmore and Evans, 2002). Primary muscle fibers are formedde novoin the early stages of myoblast fu-sion (first wave of differentiation) and secondary fibers use the primary fibers as a template in a second wave of differ-entiation (Rehfeldtet al., 2000; Te Paset al., 2005); the
lat-ter fibers account for the majority of fibers in skeletal muscle (Beermannet al., 1978). The number and size of primary myotubes are intrinsic factors that affect the num-ber of secondary finum-bers. The numnum-ber of secondary myotubes is sensitive to external factors such as nutrition, while the number of primary myotubes is genetically pro-grammed and is unaffected by exogenous influences (Mal-tin et al., 2001). In pigs, the waves of muscle fiber formation involve relatively long periods of time, i.e., ~30-60 days and 54-90 days of gestation for the first and second waves, respectively (Wigmore and Stickland, 1983).
The changes in gene expression associated with mus-cle development and growth have been examined in differ-ent breeds of pigs at various prenatal ages (Te Paset al., 2005; Cagnazzoet al., 2006; Muraniet al., 2007; Solleroet al., 2011; Zhao et al., 2011). The analysis of changes in myogenic gene expression during the prenatal period, when the two waves of myoblast fusion occur, can be very impor-tant for understanding the biochemical differences that con-tribute to distinct interbreed variations in the degree of muscularity and meat quality.
DOI: http://dx.doi.org/10.1590/1678-4685-GMB-2015-0295
Send correspondence to Evelyze Pinheiro dos Reis. Departamento de Zootecnia, Universidade Federal de Viçosa (UFV), Avenida Pe-ter Henry Rolfs, Viçosa, 36570-000, MG, Brazil. E-mail: [email protected]
In this study, we analysed the expression of myo-genes in a commercial pig line (the three-way Duroc, Land-race and Large-White cross) and Piau pigs, which differ in muscularity from the commercial breed, in order to assess possible differences in gene expression during myogenesis.
Material and Methods
Biological material
Embryos and fetuses were obtained by cesarean sec-tion from three unrelated pregnant gilts for each genetic group of pigs (local Piau and commercial breeds) at 21, 40, 70 and 90 days post-insemination (dpi) maintained at the Pig Breeding Farm of the Departamento de Zootecnia at the Universidade Federal de Viçosa (UFV). Embryos and fe-tuses collected from the commercial breed were obtained from gilts of the three-way Duroc, Landrace and Large-White cross. Samples from three unrelated fetuses and em-bryos were used as biological replicates in gene expression analysis for each breed at 21, 40, 70 and 90 dpi. The proce-dures for obtaining the embryos and fetuses were approved by the Ethics Committee for Animal Use at UFV (protocol no. CEUA-UFV 85/2013), in accordance with current Bra-zilian federal legislation.
Longissimus dorsi(LD) muscle was collected at all periods, except from 21 dpi embryos, for which the whole individual was collected and used in RNA extraction. Sam-ples were immediately placed in Falconer tubes containing 10 ml of RNA holder solution (BioAgency Laboratórios, Brazil) and sent to the Animal Biotechnology Laboratory at the Departamento de Zootecnia (UFV) where they were stored overnight at 4 °C and then transferred to a freezer at -80 °C until RNA extraction.
RNA extraction
Total RNA was extracted using TRIzol®reagent (Life Technologies, USA). The RNA was quantified in a NanoVue Plus spectrophotometer (GE Healthcare, Ger-many) and RNA A260/A280ratios of 1.8-2.0 were used as an
indicator of purity. The quality and intactness of extracted RNA were verified by electrophoresis in a 1% agarose gel. Total RNA was stored at -70 °C until cDNA synthesis.
cDNA synthesis
Prior to the reverse transcription step, RNA was treated with DNase I amplification grade (Invitrogen, USA) to remove contaminant DNA, according to the manu-facturer’s instructions. The first strand of complementary DNA (cDNA) was synthesized using a GoScriptTMreverse transcription system (Promega, USA), according to the manufacturer’s recommendations. cDNA concentrations were estimated spectrophotometrically in NanoVueTMplus (GE Healthcare) and single stranded cDNA was stored at -20 °C until used in qPCR assays.
Gene selection and primer design for qRT-PCR
The genetic data for differentially expressed genes (DEG) from an RNAseq experiment were used to compare gene expression between breeds in embryos and fetuses of a commercial pig breed (a two-way Landrace and Large-White cross) and Piau pigs (unpublished data). HUGO Gene Nomenclature Committee (HGNC) symbols for genes were obtained with the BIOMART/ENSEMBL pro-gram using ENSEMBL transcript identifications for DEG in conjunction with the pig (Sus scrofa) database. When HGNC symbols were not available for pigs, they were ob-tained by orthology using theHomo sapiensdatabase. The HGNC symbols for genes were subsequently subjected to gene ontology analysis.
Information on gene ontology for the genes was ob-tained using the ToppCluster program (Kaimal et al., 2010). The terms related to muscle development (myogenesis) were identified and their genes was used in metabolic pathway analysis. Metabolic pathway maps from KEGG (Kyoto Encyclopedia of Genes and Genomes) were obtained using DAVID software (Dennis et al., 2003; Huanget al., 2009). Cytoscape software (Shannonet al., 2003) was used to view and edit the biological processes, molecular functions and metabolic pathways identified with ToppCluster (Kaimalet al., 2010) and DAVID (Den-nis Jr.et al., 2003; Huanget al., 2009) software. In addi-tion, gene functions were evaluated using a Gene Cards database (Safranet al., 2010) that provided concise infor-mation on all known and predicted human genes, in addi-tion to informaaddi-tion on gene ontologies that was not obtained by Toppcluster (Kaimalet al., 2010).
Based on these findings, 13 genes were selected for analysis of their expression profiles using RT-qPCR. This work focused on genes that were differentially expressed between breeds because they represented primary candi-dates for information on the source of variation in muscu-larity and meat quality. The selected genes were related to myogenesis and were chosen based on gene ontology, the identification of metabolic pathways and their function.
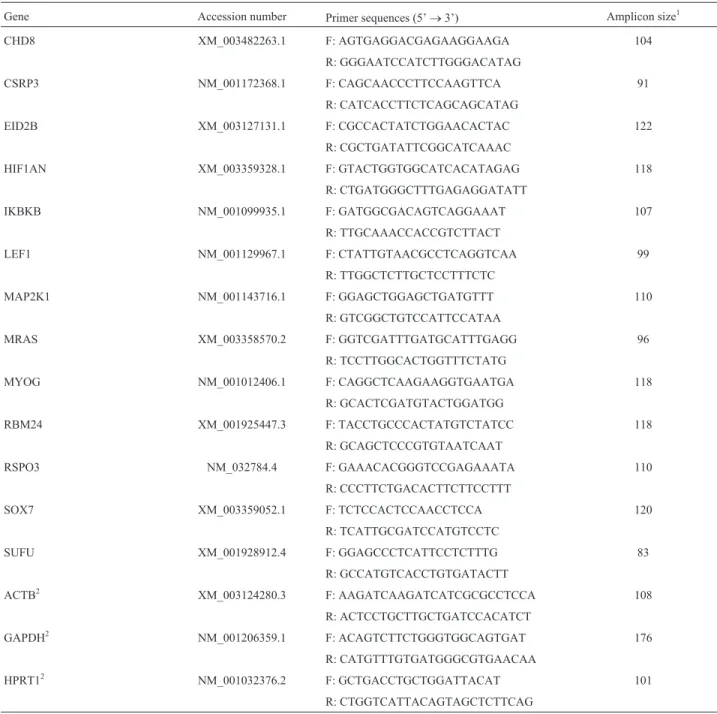
qPCR primers were designed using PrimerQuest® software (Owczarzyet al., 2008) and nucleotide sequences obtained from the S. scrofa transcriptome database at GenBank (Benson et al., 2013). The only nucleotide se-quence not available for pigs was that of RSPO3, for which a homologous sequence from humans (Homo sapiens) was used. Table 1 summarizes relevant information for the genes that were studied, including the accession numbers of the transcript sequences used in primer design, the nucleo-tide sequences of the primers and amplicon size.
Testing of the designed primers
tem-perature of 60 °C in a Veriti®96-well thermal cycler (Ap-plied Biosystems, USA). PCR was done with a GoTaq® Green master mix kit (Promega) according to the manufac-turer’s protocol. The amplification products were screened for reaction specificity and the presence of primer dimers by electrophoresis on 8% polyacrylamide gels at 100 V for 2 h.
Real time qPCR
Real time qPCR reactions were run in an ABI Prism 7300 Sequence Detection Systems thermocycler (Applied Biosystems) using a Gotaq® qPCR master mix kit (Promega) according to the manufacturer’s protocol. cDNA (25, 75 or 225 ng) or nucleic acid-free water (nega-Table 1- GenBank accession numbers, primer sequences and amplicon sizes of the genes analyzed in this study.
Gene Accession number Primer sequences (5’®3’) Amplicon size1
CHD8 XM_003482263.1 F: AGTGAGGACGAGAAGGAAGA 104
R: GGGAATCCATCTTGGGACATAG
CSRP3 NM_001172368.1 F: CAGCAACCCTTCCAAGTTCA 91
R: CATCACCTTCTCAGCAGCATAG
EID2B XM_003127131.1 F: CGCCACTATCTGGAACACTAC 122
R: CGCTGATATTCGGCATCAAAC
HIF1AN XM_003359328.1 F: GTACTGGTGGCATCACATAGAG 118
R: CTGATGGGCTTTGAGAGGATATT
IKBKB NM_001099935.1 F: GATGGCGACAGTCAGGAAAT 107
R: TTGCAAACCACCGTCTTACT
LEF1 NM_001129967.1 F: CTATTGTAACGCCTCAGGTCAA 99
R: TTGGCTCTTGCTCCTTTCTC
MAP2K1 NM_001143716.1 F: GGAGCTGGAGCTGATGTTT 110
R: GTCGGCTGTCCATTCCATAA
MRAS XM_003358570.2 F: GGTCGATTTGATGCATTTGAGG 96
R: TCCTTGGCACTGGTTTCTATG
MYOG NM_001012406.1 F: CAGGCTCAAGAAGGTGAATGA 118
R: GCACTCGATGTACTGGATGG
RBM24 XM_001925447.3 F: TACCTGCCCACTATGTCTATCC 118
R: GCAGCTCCCGTGTAATCAAT
RSPO3 NM_032784.4 F: GAAACACGGGTCCGAGAAATA 110
R: CCCTTCTGACACTTCTTCCTTT
SOX7 XM_003359052.1 F: TCTCCACTCCAACCTCCA 120
R: TCATTGCGATCCATGTCCTC
SUFU XM_001928912.4 F: GGAGCCCTCATTCCTCTTTG 83
R: GCCATGTCACCTGTGATACTT
ACTB2 XM_003124280.3 F: AAGATCAAGATCATCGCGCCTCCA 108
R: ACTCCTGCTTGCTGATCCACATCT
GAPDH2 NM_001206359.1 F: ACAGTCTTCTGGGTGGCAGTGAT 176
R: CATGTTTGTGATGGGCGTGAACAA
HPRT12 NM_001032376.2 F: GCTGACCTGCTGGATTACAT 101
R: CTGGTCATTACAGTAGCTCTTCAG
1
tive control) was added to each well of the plate along with upstream and downstream primers at 100, 200 or 400 nM. The amplification conditions were: 95 °C for 2 min, 40 denaturation cycles at 95 °C for 15 s, and annealing and extension at 60 °C or 61 °C for 60 s. The efficiency of am-plification was assessed after 40 amam-plification cycles by in-cluding an additional step in which the temperature was gradually raised from 60 °C to 94 °C to obtain the primer dissociation curve.
Target and reference gene amplifications were done in different wells of the same plate. The assays were run with three biological and two technical replicates for each treatment in a single 96-well plate. The coefficient of varia-tion, used as an indicator of precision and reproducibility, was less than 5%, which was adequate for the Ct (threshold cycle) values of the technical replicates within each sample.
Amplification efficiency
To calculate the amplification efficiency of target and reference genes, all reactions were done in 96-well plates using pooled cDNAs containing biological replicates of treatments and two technical replicates for each treatment. From the real time qPCR raw data, the Ct values and log10
amount of cDNA (25, 75 and 225 ng) were plotted in graphs for primers at 100, 200 and 400 nM. The slope of the resulting relationship was determined by linear regression and was used to calculate the amplification efficiency with the following equation, modified from Rasmussen (2001), in which efficiencies equal to 1 represent 100%:
E= slope -æ è çç öø÷÷
10 1
1
Based on the results obtained in the preceding step, the highest amplification efficiency of target and reference genes was chosen, along with the appropriate primer con-centration and quantity of cDNA for each gene to be used in the final qPCR reactions. Amplification efficiencies of 0.80 to 1.0 were considered appropriate (Table S1). The suitabil-ity of three reference genes (ACTB, GAPDH and HPRT1) for qRT-PCR was investigated using NormFinder software (Andersenet al., 2004), and GAPDH was selected for data normalization since the gene used for this procedure should show no change in expression along the treatments. Ct val-ues for a specific gene were normalized to the Ct value of highest expression (Ct minimum value) for that gene. The normalized Ct values were then used in the following equa-tion (McCullochet al., 2012):
Q= E(min Ct – Ct sample),
where: Q = normalized Ct value for a gene in the current sample, E = calculated amplification efficiency (ranging from 1 to 2, in which 100% = 2), min Ct = minimum Ct value for a gene among all samples, and Ct sample = Ct value for current sample and gene.
Statistical analysis
The experimental design was a completely random-ized 2 (breeds) x 4 (prenatal ages) factorial design with six repetitions (three biological and two technical replicates) per treatment. ANOVA was done using the following sta-tistical model:
Yijkl=m+ A(ij)l+ Dijk+ (RIG)ijk+eijkl, where
Yijkl is the expression level of gene k, in animal l,
breed i and prenatal age j, in which i = 1 or 2 (commercial or Piau breed, respectively) and j = 1, 2, 3 or 4 (21, 40, 70 or 90 dpi, respectively),
mis the general constant,
A(ij)lis the random effect of animal l in breed i and age
j,
A(ij)l~ N(0,s2A),
Dijkis the sample-specific random effect (common to
both genes), Dijk~ N(0,s2D),
(RIG)ijkis the interaction effect between breed i and
age j in gene k, and
eijklis the random error, i.e.,eijkl~ N(0,s2e).
This model was fitted to the data using the %QPCR_MIXED macro in SAS (Statistical Analysis Sys-tem Institute Inc., USA), which is based on linear mixed models (Steibelet al., 2009). The significance of contrast estimate values was assessed using Student’st-test. Con-trast estimate values correspond toDDCt and were used to assess relative expression (fold-change) by using the for-mula 2–DDCt(Livak and Schmittgen, 2001). In all cases, the level of significance was set at p < 0.05.
Results
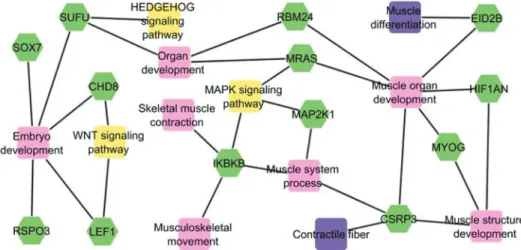
To understand the role of the 13 selected genes, infor-mation on gene ontology was obtained using Toppcluster software and metabolic pathways were investigated using DAVID software. These 13 genes are part of relevant func-tional metabolic networks for muscle development (Figure 1). These networks are for skeletal muscle contraction, muscle structure development, embryo development, organ development, muscle organ development, muscle differen-tiation, contractile fiber, musculoskeletal movement, mus-cle system process, and HEDGEHOG, MAPK and WNT signaling pathways. In addition, Table 2 describes the func-tion of these 13 genes as defined in gene ontology terms.
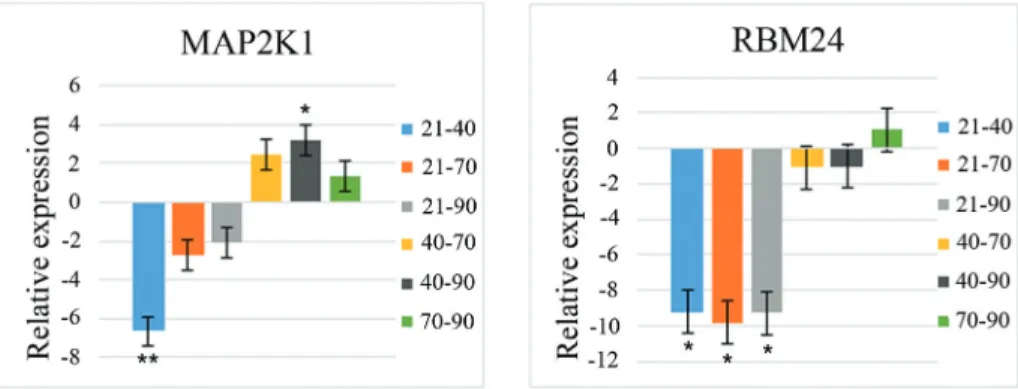
pair-wise comparisons among the prenatal periods for these genes. The relative gene expression (fold-change) for pair-wise comparisons of prenatal periods is shown in Fig-ure 2. Of the genes analyzed,MAP2K1showed greater ex-pression at 40 dpi (period of primary fiber formation) and 70 dpi (period of secondary fiber formation), whereas RBM24showed greater expression at 40 dpi (period of pri-mary fiber formation) and at 70 and 90 dpi (periods of sec-ondary fiber formation).
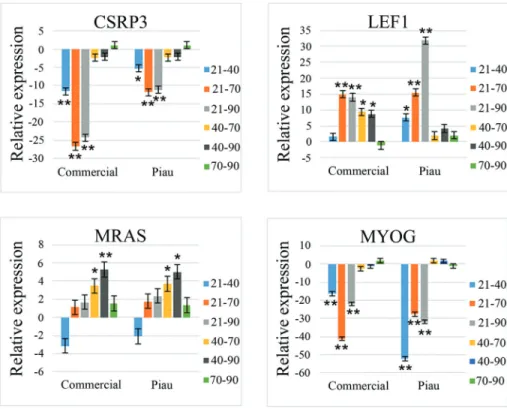
Four genes (CSRP3, MRAS, LEF1 and MYOG) showed a significant (p < 0.05) Breed x Period interaction and Period factor based on ANOVA. Table 5 shows the Student’s t-test results for comparisons that assessed a Breed x Period interaction for these genes. The relative gene expression (fold-change) for pair-wise comparisons of prenatal periods is shown in Figure 3 and revealed Breed x Period interactions (p < 0.05).
Figure 1- Functional gene networks and their interactions, showing the relationship between 13 genes (green). Twelve important subnets related to mus-cle development were included in biological process (pink), molecular function (violet) and metabolic pathway (yellow).
Table 2- Metabolic pathways and gene ontologies for genes represented in the gene network.
Gene ontologies
Gene Metabolic pathway Cellular component Molecular function Biological process
CHD8 WNT signaling pathway Nuclear lumen Histone and DNA binding Embryo development
CSRP3 - Cytoskeleton Contractile fiber Muscle organ
development/Mus-cle structure development/Musdevelopment/Mus-cle system process
EID2B - Nucleus Muscle differentiation Muscle organ development
HIF1AN - Nucleus/cytosol Protein binding Muscle organ
development/Mus-cle structure development
IKBKB MAPK signaling pathway Nucleus/cytosol Protein binding Muscle system
pro-cess/Musculoskeletal move-ment/Skeletal muscle contraction
LEF1 WNT signaling pathway Nucleus Chromatin and DNA binding Embryo development
MAP2K1 MAPK signaling pathway Cytoskeleton/ cytosol/nucleus Protein kinase activity Muscle system process
MRAS MAPK signaling pathway Intracellular GTPase activity/ nucleotide
bind-ing
Muscle organ development/Organ development
MYOG - Nucleus Chromatin and DNA binding Muscle organ
development/Mus-cle structure development
RBM24 - Nucleus/ cytoplasm Nucleotide binding Muscle organ development/Organ
development
RSPO3 - Extracellular region Receptor binding Embryo development
SOX7 - Nucleus/ cytoplasm Nucleic acid binding Embryo development
SUFU Hedgehog signaling pathway Nucleus/ cytoplasm Transcription corepressor activity Embryo development/Organ
Figure 3 and Table 5 show that commercial and Piau pigs had similar expression patterns forCSRP3,MRASand MYOG.CSRP3showed greater expression during the two waves of myoblast fusion that gave rise to primary fibers at 40 dpi and secondary fibers at 70 and 90 dpi.MRASshowed greater expression during somite formation and
prolifera-tion at 21 dpi and during primary fiber formaprolifera-tion at 40 dpi. MYOGhad a greater expression at 40 dpi (period of pri-mary fiber formation) and at 70 and 90 dpi (period of sec-ondary fiber formation). LEF1 showed a divergent expression pattern for commercial and Piau pigs: expres-sion was greater at 21 dpi (period of somite formation and proliferation) and 40 dpi (period of primary fiber forma-tion) in commercial pigs, whereas in Piau pigs this gene showed greater expression only at 21 dpi.
Discussion
Thirteen genes related to important gene networks for muscle development and structure were analyzed by qRT-PCR to determine their expression profiles at 21 dpi (em-bryos) and at 40, 70 and 90 dpi (fetuses) in commercial (three-way Duroc, Landrace and Large-White cross) and local Piau pigs. In 21 dpi embryos we examined the region that would give rise to muscle, and which should contain only undifferentiated mesenchymal stem cells (also known as somite cells), since a histochemical study of pig embryos at 20 dpi found only somites in this region (Swatland and Cassens, 1973). In the other periods analyzed, primary myotubes were formed at 40 dpi and secondary myotubes developed at 70 and 90 dpi after myoblast differentiation. The analysis of myogene expression in these periods shed light on possible differences in myogenesis and subsequent muscularity in commercial and Piau pigs. Local Piau pigs Table 3- P-values for ANOVA in relation to Breed, Period and interaction
Breed x Period for the genes studied.
Genes Factors
Breed Period Breed x Period
CHD8 0.9764 0.3615 0.6094
CSRP3 0.8615 < 0.0001 < 0.0001
EID2B 0.9072 0.1615 0.4284
HIF1AN 0.5757 0.2535 0.5533
IKBKB 0.7473 0.6656 0.6948
LEF1 0.9772 < 0.0001 0.0004
MAP2K1 0.4445 0.0125 0.0712
MRAS 0.6557 0.0019 0.0205
MYOG 0.7314 < 0.0001 < 0.0001
RBM24 0.9866 0.0284 0.1756
RSPO3 0.7198 0.0885 0.2230
SOX7 0.3451 0.4870 0.6915
SUFU 0.6504 0.2974 0.4175
Values in bold were statistically significant (p < 0.05) by F-Test;
Table 4- P-values for two-period comparisons for the genes MAP2K1 and RBM24. The ANOVA results (F-test) for these genes were significant for the factor Period.
Comparisons
Genes 21d x 40da 21d x 70d 21d x 90d 40d x 70d 40d x 90d 70d x 90d
MAP2K1 0.0027 0.0772 0.1882 0.1177 0.0456 0.6143
RBM24 0.0192 0.0165 0.0188 0.9412 0.9917 0.9495
a21d, 40d, 70d and 90d indicate the prenatal ages. Values in bold were statistically significant (p < 0.05).
are expected to have a higher level of fat than commercial pigs (Seraoet al., 2011), which have a greater muscle mass.
Muscle mass is influenced by the number and size of its muscle fibers (Rehfeldtet al., 2000). We therefore fo-cused on the expression of genes involved in the formation of myogenic cells in four periods since differential gene ex-pression between genetically distinct lineages and periods could explain differences in muscle mass between breeds. Muscle development is a complex biological process regu-lated by various genes that interact with each other and a
se-ries of signal transduction pathways (Zhaoet al., 2011). Myogenic regulatory factors are controlled by regulatory pathways that activate or repress their activity, although ad-ditional factors are also probably involved in various tran-scription circuits that control myogenesis (Kong et al., 1997).
MAP2K1showed similar expression in both breeds, with greater expression during primary and secondary fiber formation (40 and 70 dpi, respectively). This gene is in-volved in the MAPK signaling pathway that is important Table 5- P-values for two-period comparisons in commercial and Piau pigs. The ANOVA results (F-test) for these genes showed a significant Breed x Period interaction.
Comparisons
Genes Breed 21d x 40da 21d x 70d 21d x 90d 40d x 70d 40d x 90d 70d x 90d
CSRP3 Commercial 0.0032 0.0003 0.0003 0.2524 0.3070 0.8964
Piau 0.0309 0.0029 0.0035 0.2719 0.3062 0.9365
LEF1 Commercial 0.5880 0.0049 0.0058 0.0155 0.0183 0.9356
Piau 0.0257 0.0045 0.0007 0.4091 0.1052 0.3973
MRAS Commercial 0.0575 0.8639 0.3663 0.0412 0.0089 0.4609
Piau 0.1992 0.3261 0.1414 0.0318 0.0107 0.6007
MYOG Commercial 0.0026 0.0002 0.0012 0.2565 0.7099 0.4366
Piau 0.0001 0.0006 0.0004 0.4341 0.5396 0.8629
a21d, 40d, 70d and 90d indicate the prenatal ages. Values in bold were statistically significant (p < 0.05) by Student’st-test.
for muscle development since it can activate transcription factors involved in differentiation (Kerenet al., 2006), such as MEF2A, MEF2C and MYOD (Wuet al., 2000) that can accelerate myoblast differentiation (Ulloa et al., 2007). MAP2K1 can inhibit and activate myogenesis, depending on the developmental stage (Joet al., 2009), and can nega-tively control the switch from myoblast proliferation to dif-ferentiation by suppressing MYOD activity in the early stages of myogenesis (Perryet al., 2001). In contrast, the presence of MAP2K1 protein in the nucleus of proliferating myoblasts can have a stimulatory role on muscle differenti-ation (Joet al., 2009). Thus, the differential expression at 40 dpi and 70 dpi suggests that MAP2K1 may have a stimulatory role in myoblast differentiation in myotubes of both breeds.
RBM24showed a similar expression pattern in com-mercial and Piau pigs, with greater expression during pri-mary and secondary fiber formation (at 40 dpi and 70-90 dpi, respectively). RBM24is involved in biological cesses related to muscle organ development. RBM24 pro-tein interacts withMYOGmRNA to regulate the stability and expression of the latter through a post-transcriptional regulatory pathway (Jinet al., 2010), but can also promote myogenic differentiation by modulating the cell cycle (Miyamoto et al., 2009). The RBM24expression profile confirmed its role in controlling the stability and expression ofMYOGmRNA and may therefore be involved in promot-ing primary and secondary fiber formation in both breeds. MYOGexpression was also evaluated and showed a similar level of expression toRBM24throughout prenatal periods, as described below.
MYOGshowed greater expression during the periods of primary (40 dpi) and secondary (70 dpi and 90 dpi) fiber formation in commercial and Piau pigs. This gene is related to the biological processes of muscle structure develop-ment and muscle organ developdevelop-ment. MYOG is an impor-tant myogenic regulatory factor that is necessary for the formation of multinucleated myotubes (Kerenet al., 2006). These results confirmed the importance of this transcrip-tion factor for primary and secondary fiber formatranscrip-tion dur-ing myogenic differentiation and showed that MYOG mRNA can be stabilized by RBM24 proteins since the syn-thesis of this mRNA is also high during primary and sec-ondary fiber formation.
CSRP3showed greater expression during primary fi-ber (40 dpi) and secondary fifi-ber (70 and 90 dpi) formation in commercial and Piau pigs. This gene is included in the molecular function of contractile fiber and in the biological processes of muscle system process, muscle organ develop-ment and muscle structure developdevelop-ment. CSRP3 promotes myoblast differentiation and it is first expressed and accu-mulated in the nucleus when there is myotube formation and growth (Arberet al., 1994). As shown here,CSRP3 ex-pression was enhanced during the two waves of myoblast
differentiation in both breeds, in agreement with its role in primary and secondary fiber formation.
LEF1showed greater expression at 21 dpi and 40 dpi in commercial and at 21 dpi in Piau pigs, with lower expres-sion thereafter. This gene belongs to the WNT signaling pathway and is related to the biological process of embryo development. The WNT pathway is important for muscle development because it can control the expression of myogenic regulatory factors such as MYF5 and MYOD, thereby influencing myogenic differentiation and survival (Cossu and Borello, 1999; von Maltzahn et al., 2012). LEF1 can induce cellular cycle progression, cellular differ-entiation and apoptosis through transcriptional activation ofE2F1(Zhouet al., 2008). Based on the expression pro-file observed here, LEF1 is more important in the early stages of muscle development, mainly at 21 dpi when so-mites are formed and proliferate. The additional peak of ex-pression seen at 40 dpi in commercial pigs indicates that LEF1 is possibly involved in the greater proliferation and fusion of myoblasts in this breed, which could account for the greater number of primary fibers in commercial pigs. Indeed, as mentioned above, LEF1 can induce cell cycle progression and cellular differentiation (Zhouet al., 2008).
MRASshowed greater expression during the period of somite formation and proliferation (21 dpi) and primary fi-ber formation (40 dpi), with lower expression thereafter. This gene is related to the biological processes of muscle organ development and organ development and is involved in the MAPK signaling pathway. MRAS is a negative regu-lator of myoblast differentiation during myogenesis (Yoko-yamaet al., 2007). Thus, we suggest that this gene has a greater role at 21 and 40 dpi, possibly by controlling somite formation and proliferation, as well as myoblast differenti-ation in primary fibers. MRAS can negatively regulate the expression and function of muscle-specific transcription factors such asMYOD and MEF2 family (Lassar et al., 1989; Winter and Arnold, 2000; Tortorellaet al., 2001) that are essential for controlling myoblast development and fu-sion to give rise to primary myotubes in both breeds. Myoblast differentiation into myotubes thus involves a bal-ance between genes that activate and inhibit the process.
CHD8,EID2B,HIF1AN,IKBKB,RSPO3,SOX7and SUFUshowed no changes in expression during the various periods or between breeds. Since there were no changes in gene expression, studies at the protein level are necessary in order to assess the roles of these genes in myogenesis in commercial and Piau pigs; differences in the amount of ac-tivated protein could be an important factor in distinguish-ing between the two breeds.
al., 2009). RSPO3 is a positive regulator of myogenesis in skeletal muscle by activating the WNT/b-catenin signaling pathway and can induce MYF5 expression (Han et al., 2011). SOX7 is a negative regulator of the WNT/b-catenin signaling pathway (Chanet al., 2012) and can also be a tu-mor suppressor (Takashet al., 2001).SUFUis related to the biological process of organ development and is included in the Hedgehog signaling pathway, of which it is a negative regulator by suppressing the activity and function of GLI transcription factors (Dinget al., 1999). This suppression can increase the expression of specific muscle genes such asMYOD(Voronovaet al., 2013). The pathway is impor-tant for myogenesis because it is involved in cell prolifera-tion and differentiaprolifera-tion, tissue remodeling (Heretschet al., 2010), and specifies cellular growth and differentiation pat-terns (Rossiet al., 2007).
EID2Band HIF1ANare involved in the biological process muscle organ development.EID2Bis also related to muscle differentiation and can prevent myoblast differ-entiation into myotubes (Sasajimaet al., 2005).HIF1ANis also involved in the biological process of muscle structure development. This gene negatively regulates apoptosis (Yanet al., 2011) and is important for myoblast differentia-tion, in which it acts as a crucial transcription factor that regulates myogenesis (Liet al., 2007). UnalteredHIF1AN mRNA expression has already been observed during myogenesis (Wagatsumaet al., 2011).
IKBKBis included in the MAPK signaling pathway and is related to the biological processes of skeletal muscle contraction, muscle system process and musculoskeletal movement. This gene can negatively regulate myoblast dif-ferentiation during myogenesis (Bakkaret al., 2008).
Overall, the results of this study indicate that the LEF1gene is a primary candidate to explain the difference in muscularity between commercial and Piau pigs. Al-though this gene is expressed in both breeds, in commercial pigs this expression probably leads to greater fusion of myoblasts than in Piau pigs. In commercial pigs, LEF1 showed an additional peak of greater expression at 40 dpi that corresponds to a critical period of myoblast prolifera-tion and fusion during the first wave of myofiber formaprolifera-tion. Thus, the greater number of fibers formed in commercial pigs compared to Piau pigs accounts for the greater muscu-larity seen in the former breed during postnatal develop-ment. The potential growth of skeletal muscle depends on the number of muscle fibers formed during the prenatal pe-riod and their postnatal hypertrophy (Rehfeldtet al., 2000).
The findings reported here contribute to our under-standing of the molecular mechanisms involved in muscle tissue formation in a commercial pig breed (the three-way Duroc, Landrace and Large-White cross) and Piau pigs. The new information on gene expression analyzed by qRT-PCR for the first time in pigs should be useful in un-derstanding myogenesis and the possible mechanisms
involved in the differences in muscularity between geneti-cally distinct breeds.
Acknowledgments
The authors thank the trainees and employees of the Swine Breeding Farm at Universidade Federal de Viçosa for help in sample collection. EPR was supported by a scholarship from Coordenação de Aperfeiçoamento de Pes-soal de Nível Superior(CAPES) and Conselho Nacional de Desenvolvimento Científico e Tecnológico (CNPq). This work was supported by grants from CNPq (472858/2010-6 and 478181/2012-4).
References
Andersen CL, Jensen JL and Orntoft TF (2004) Normalization of real-time quantitative reverse transcription-PCR data: A model-based variance estimation approach to identify genes suited for normalization, applied to bladder and colon cancer data sets. Cancer Res 64:5245-5250.
Arber S, Halder G and Caroni P (1994) Muscle LIM protein, a novel essential regulator of myogenesis, promotes myo-genic differentiation. Cell 79:221-231.
Bakkar N, Wang J, Ladner KJ, Wang H, Dahlman JM, Carathers M, Acharyya S, Rudnicki MA, Hollenbach AD and Gut-tridge DC (2008) IKK/NF-kBregulates skeletal myogenesis via a signaling switch to inhibit differentiation and promote mitochondrial biogenesis. J Cell Biol 180:787-802. Beermann DH, Cassens RG and Hausman GJ (1978) A second
look at fiber type differentiation in porcine skeletal muscle. J Anim Sci 46:125-132.
Benson DA, Cavanaugh M, Clark K, Karsch-Mizrachi I, Lipman DJ, Ostell J and Sayers EW (2013) GenBank. Nucleic Acids Res 41:D36-D42.
Cagnazzo M, te Pas MF, Priem J, de Wit AA, Pool MH, Davoli R and Russo V (2006) Comparison of prenatal muscle tissue expression profiles of two pig breeds differing in muscle characteristics. J Anim Sci 84:1-10.
Chan DW, Mak CS, Leung TH, Chan KK and Ngan HY (2012) Down-regulation of Sox7 is associated with aberrant activa-tion of Wnt/b-catenin signaling in endometrial cancer. Oncotarget 3:1546-1556.
Cossu G and Borello U (1999) Wnt signaling and the activation of myogenesis in mammals. EMBO J 18:6867-6872.
Dennis Jr G, Sherman BT, Hosack DA, Yang J, Gao W, Lane HC and Lempicki RA (2003) DAVID: Database for annotation, visualization, and integrated discovery. Genome Biol 4:P3. Ding Q, Fukami S, Meng X, Nishizaki Y, Zhang X, Sasaki H,
Dlugosz A, Nakafuku M and Hui C (1999) Mouse suppres-sor of fused is a negative regulator of sonic hedgehog signal-ing and alters the subcellular distribution of Gli1. Curr Biol 9:1119-1122.
Han XH, Jin YR, Seto M and Yoon JK (2011) A WNT/b-catenin signaling activator, R-spondin, plays positive regulatory roles during skeletal myogenesis. J Biol Chem 286:10649-10659.
Huang W, Sherman BT and Lempicki RA (2009) Systematic and integrative analysis of large gene lists using DAVID bio-informatics resources. Nat Protoc 4:44-57.
Jin D, Hidaka K, Shirai M and Morisaki T (2010) RNA-binding motif protein 24 regulates myogenin expression and pro-motes myogenic differentiation. Genes Cells 15:1158-1167. Jo C, Jang BG and Jo SA (2009) MEK1 plays contrary
stage-specific roles in skeletal myogenic differentiation. Cell Sig-nal 21:1910-1917.
Kaimal V, Bardes EE, Tabar SC, Jegga AG and Aronow BJ (2010) ToppCluster: A multiple gene list feature analyzer for comparative enrichment clustering and network-based dissection of biological systems. Nucleic Acids Res 38:W96-W102.
Keren A, Tamir Y and Bengal E (2006) The p38 MAPK signaling pathway: A major regulator of skeletal muscle development. Mol Cell Endocrinol 252:224-230.
Kong Y, Flick MJ, Kudla AJ and Konieczny SF (1997) Muscle LIM protein promotes myogenesis by enhancing the activity of MyoD. Mol Cell Biol 17:4750-4760.
Lassar AB, Thayer MJ, Overell RW and Weintraub H (1989) Transformation by activated ras or fos prevents myogenesis by inhibiting expression of MyoD1. Cell 58:659-667. Li X, Zhu L, Chen X and Fan M (2007) Effects of hypoxia on
pro-liferation and differentiation of myoblasts. Med Hypotheses 69:629-636.
Livak KJ and Schmittgen TD (2001) Analysis of relative gene ex-pression data using real-time quantitative PCR and the 2-DDCTmethod. Methods 25:402-408.
Maltin CA, Delday MI, Sinclair KD, Steven J and Sneddon AA (2001) Impact of manipulations of myogenesisin uteroon the performance of adult skeletal muscle. Reproduction 122:359-374.
McCulloch RS, Ashwell MS, O’Nan AT and Mente PL (2012) Identification of stable normalization genes for quantitative real-time PCR in porcine articular cartilage. J Anim Sci Biotechnol 3:36.
Miyamoto S, Hidaka K, Jin D and Morisaki T (2009) RNA-binding proteins Rbm38 and Rbm24 regulate myogenic dif-ferentiation via p21-dependent and -independent regulatory pathways. Genes Cells 14:1241-1252.
Murani E, Muraniova M, Ponsuksili S, Schellander K and Wim-mers K (2007) Identification of genes differentially ex-pressed during prenatal development of skeletal muscle in two pig breeds differing in muscularity. BMC Dev Biol 7:e109.
Nishiyama M, Oshikawa K, Tsukada Y, Nakagawa T, Iemura S, Natsume T, Fan Y, Kikuchi A, Skoultchi AI and Nakayama KI (2009) CHD8 suppresses p53-mediated apoptosis through histone H1 recruitment during early embryogenesis. Nat Cell Biol 11:172-182.
Nishiyama M, Skoultchi AI and Nakayama KI (2012) Histone H1 recruitment by CHD8 is essential for suppression of the Wnt-b-catenin signaling pathway. Mol Cell Biol 32:501-512.
Owczarzy R, Tataurov AV, Wu Y, Manthey JA, McQuisten KA, Almabrazi HG, Pedersen KF, Lin Y, Garretson J, McEntag-gart NO,et al.(2008) IDT SciTools: A suite for analysis and design of nucleic acid oligomers. Nucleic Acids Res 36:W163-W169.
Perry RL, Parker MH and Rudnicki MA (2001) Activated MEK1 binds the nuclear MyoD transcriptional complex to repress transactivation. Mol Cell 8:291-301.
Rasmussen R (2001) Quantification on the lightcycler. In: Meuer S, Wittwer C and Nakagawara K (eds) Rapid Cycle Real-Time PCR: Methods and Applications. Springer, Heidel-berg, pp 21-34.
Rehfeldt C, Fiedler I, Dietl G and Ender K (2000) Myogenesis and postnatal skeletal muscle cell growth as influenced by selec-tion. Livest Prod Sci 66:177-188.
Rossi D, Murayama T, Manini I, Franci D, Ogawa Y and Sorren-tino V (2007) Expression and functional activity of ryano-dine receptors (RyRs) during skeletal muscle development. Cell Calcium 41:573-580.
Safran M, Dalah I, Alexander J, Rosen N, Iny Stein T, Shmoish M, Nativ N, Bahir I, Doniger T, Krug H, et al. (2010) GeneCards Version 3: The human gene integrator. Database 2010:baq020.
Sasajima Y, Tanaka H, Miyake S and Yuasa Y (2005) A novel EID family member, EID-3, inhibits differentiation and forms a homodimer or heterodimer with EID-2. Biochem Biophys Res Commun 333:969-975.
Serão NV, Veroneze R, Ribeiro AM, Verardo LL, Braccini Neto J, Gasparino E, Campos CF, Lopes PS and Guimarães SE (2011) Candidate gene expression and intramuscular fat content in pigs. J Anim Breed Genet 128:28-34.
Shannon P, Markiel A, Ozier O, Baliga NS, Wang JT, Ramage D, Amin N, Schwikowski B and Ideker T (2003) Cytoscape: A software environment for integrated models of biomolecular interaction networks. Genome Res 13:2498-2504.
Sollero BP, Guimarães SE, Rilington VD, Tempelman RJ, Raney NE, Steibel JP, Guimarães JD, Lopes PS, Lopes MS and Ernst CW (2011) Transcriptional profiling during foetal skeletal muscle development of Piau and Yorkshire-Lan-drace cross-bred pigs. Anim Genet 42:600-612.
Steibel JP, Poletto R, Coussens PM and Rosa GJ (2009) A power-ful and flexible linear mixed model framework for the analy-sis of relative quantification RT-PCR data. Genomics 94:146-152.
Swatland HJ and Cassens RG (1973) Prenatal development, histo-chemistry and innervation of porcine muscle. J Anim Sci 36:343-354.
Takash W, Cañizares J, Bonneaud N, Poulat F, Mattéi M-G, Jay P and Berta P (2001) SOX7 transcription factor: Sequence, chromosomal localisation, expression, transactivation and interference with Wnt signalling. Nucleic Acids Res 29:4274-4283.
Te Pas MF, De Wit AA, Priem J, Cagnazzo M, Davoli R, Russo V and Pool MH (2005) Transcriptome expression profiles in prenatal pigs in relation to myogenesis. J Muscle Res Cell Motil 26:157-165.
Tortorella LL, Milasincic DJ and Pilch PF (2001) Critical prolif-eration-independent window for basic fibroblast growth fac-tor repression of myogenesis via the p42/p44 MAPK signal-ing pathway. J Biol Chem 276:13709-13717.
Ulloa F, Itasaki N and Briscoe J (2007) Inhibitory Gli3 activity negatively regulates Wnt/ b-catenin signaling. Curr Biol 17:545-550.
Voronova A, Coyne E, Al Madhoun A, Fair JV, Bosiljcic N, St-Louis C, Li G, Thurig S, Wallace VA, Wiper-Bergeron N,et al.(2013) Hedgehog signaling regulates MyoD expres-sion and activity. J Biol Chem 288:4389-4404.
Wagatsuma A, Kotake N and Yamada S (2011) Spatial and tem-poral expression of hypoxia-inducible factor-1a during myogenesis in vivo and in vitro. Mol Cell Biochem 347:145-155.
Wigmore PM and Evans DJ (2002) Molecular and cellular mecha-nisms involved in the generation of fiber diversity during myogenesis. Int Rev Cytol 216:175-232.
Wigmore PM and Stickland NC (1983) Muscle development in large and small pig fetuses. J Anat 137:235-245.
Winter B and Arnold HH (2000) Activated raf kinase inhibits muscle cell differentiation through a MEF2-dependent me-chanism. J Cell Sci 113:4211-4220.
Wu Z, Woodring PJ, Bhakta KS, Tamura K, Wen F, Feramisco JR, Karin M, Wang JYJ and Puri PL (2000) p38 and extra-cellular signal-regulated kinases regulate the myogenic pro-gram at multiple steps. Mol Cell Biol 20:3951-3964. Yan B, Kong M and Chen YH (2011) Prevention of apoptosis by
the interaction between FIH1 and Bax. Mol Cell Biochem 348:1-9.
Yokoyama T, Takano K, Yoshida A, Katada F, Sun P, Takenawa T, Andoh T and Endo T (2007) DA-Raf1, a competent in-trinsic dominant-negative antagonist of the Ras-ERK path-way, is required for myogenic differentiation. J Cell Biol 177:781-793.
Zhao X, Mo D, Li A, Gong W, Xiao S, Zhang Y, Qin L, Niu Y, Guo Y, Liu X,et al.(2011) Comparative analyses by se-quencing of transcriptomes during skeletal muscle develop-ment between pig breeds differing in muscle growth rate and fatness. PLoS One 6:e19774.
Zhou F, Zhang L, Gong K, Lu G, Sheng B, Wang A, Zhao N, Zhang X and Gong Y (2008) LEF-1 activates the transcrip-tion of E2F1. Biochem Biophys Res Commun 365:149-153.
Internet resources
DAVID, http://david.abcc.ncifcrf.gov/tools.jsp (February 2, 2015).
BIOMART/ ENSEMBL,
http://www.ensembl.org/biomart/martview/ (February 2, 2015).
GenBank, https://www.ncbi.nlm.nih.gov/genbank/ (February 2, 2015).
Gene Cards Database, http://www.genecards.org/ (February 2, 2015).
PrimerQuest, http://www.idtdna.com/Primerquest/Home/Index (February 2, 2015).
Normfinder, http://moma.dk/normfinder-software (February 2, 2015).
%QPCR_MIXED,
https://www.msu.edu/~steibelj/JP_files/QPCR.html (Feb-ruary 2, 2015).
Toppcluster, https://toppcluster.cchmc.org (February 2, 2015).
Supplementary material
The following online material is available for this article: Table S1 - Amplification efficiency for target and reference genes.
Associate Editor: Alexandre Rodrigues Caetano