Evaluation of tongue/mandible volume ratio in children
with obstructive sleep apnea
Kavita Hotwani1, Krishna Sharma2, Arpan Jaiswal3
Objective: The present study was an attempt to investigate tongue/mandible volume ratio in children, using volumetric magnetic resonance imaging (MRI) for early screening and to aid in treatment planning. Methods: Volumetric evaluation of tongue volume/mandible volume ratio (TV/MV ratio) in children with obstructive sleep apnea (OSA) using MRI was carried out retrospectively on available DICOM MR images of children in the age group of 10-14 years. MRI image records of patients diagnosed with OSA were obtained from interventional radiology department records, at Sharad Pawar Dental College and Hospital (Datta Meghe Institute of Medical Sciences, Nagpur/India). The age, gender, height and weight of the subjects were retrieved from patient database and registered. For the control group, available MRI images of healthy subjects without OSA were retrieved. Body mass index (BMI) was also calculated using the height and the weight pres-ent in the records. Measurempres-ents from MR images were made using DICOM image processing software. Soft tissue and bony structure segmentation was performed by manual tracing. The tongue volume and mandible volume were directly computed using the software. The tongue volume/mandible volume ratio (TV/MV) was generated using the above values and expressed as a percentage for both groups. Re-sults: The difference between OSA group and control group with respect to TV/MV ratio was found to be highly significant at 0.05 level of significance. There was no significant correlation between BMI and TV/MV ratio in OSA group (p = 0.451) as well as in control group (p = 0.094). Conclusion: TV/MV ratio may be an appropriate variable to evaluate the risk of OSA, representing the balance between skeletal morphology and soft tissue morphology in craniofacial complex.
Keywords: Tongue/mandible ratio. MRI. Volumetric. Children.
1 VSPM Dental College and Research Center, Department of Pediatric and Preventive Dentistry (Nagpur/MH, India).
2 Toothart Comprehensive Dental Care (Nagpur/MH, India). 3 Sharad Pawar Dental College (Wardha/MH, India).
» The authors report no commercial, proprietary or financial interest in the products or companies described in this article.
Submitted: May 26, 2017 - Revised and accepted: July 20, 2017
DOI: https://doi.org/10.1590/2177-6709.23.4.072-078.oar
How to cite: Hotwani K, Sharma K, Jaiswal A. Evaluation of tongue/mandible volume ratio in children with obstructive sleep apnea. Dental Press J Orthod. 2018 July-Aug;23(4):72-8.
DOI: https://doi.org/10.1590/2177-6709.23.4.072-078.oar
Contact address: Kavita Hotwani
Pediatric and Preventive Dentistry, VSPM Dental College and Research Center Nagpur, India – E-mail: [email protected]
Objetivo: o presente estudo foi uma tentativa de investigar a relação volumétrica língua/mandíbula em crianças, usando imagens de ressonância mag-nética (IRM), para triagem inicial e como meio auxiliar no plano de tratamento. Métodos: a avaliação da relação volume da língua/volume da mandíbula (relação VL/VM) em crianças com apneia obstrutiva do sono (AOS) utilizando IRM foi realizada retrospectivamente em imagens de RM em formato DICOM disponíveis de crianças na faixa etária de 10 a 14 anos. As documentações com IRM de pacientes com diagnóstico de AOS foram obtidas nos arquivos do departamento de radiologia da Sharad Pawar Dental College and Hospital (Datta Meghe Institute of Medical Sciences, Nagpur/Índia). A idade, o sexo, altura e peso dos indivíduos foram obtidos a partir dos registros dos pacientes. Para o grupo controle, foram sele-cionadas imagens de RM disponíveis de indivíduos saudáveis sem AOS. O índice de massa corporal (IMC) também foi calculado a partir da al-tura e do peso constantes nos registros. As medições nas imagens de RM foram feitas usando um software de processamento de imagens DICOM. A segmentação entre tecidos moles e estrutura óssea foi realizada por delineamento manual. O volume da língua e o volume da mandíbula foram calculados diretamente com o software. A relação volume da língua/volume da mandíbula (VL/VM) foi calculada usando os valores acima e ex-pressa em porcentagens, para ambos os grupos. Resultados: a diferença entre o grupo com AOS e o grupo controle, quanto à relação VL/VM, foi altamente significativa ao nível de significância de 0,05. Não houve, porém, correlação significativa entre o IMC e a relação VL/VM, nem no grupo AOS (p = 0,451), nem no grupo controle (p = 0,094). Conclusão: a relação VL/VM pode ser uma variável apropriada para se avaliar o risco de AOS, representando o equilíbrio entre a morfologia esquelética e a morfologia dos tecidos moles no complexo craniofacial.
INTRODUCTION
Obstructive sleep apnea syndrome (OSAS) is a congregation of conditions in which breathing stops intermittently and repeatedly for ten or more seconds
during sleep.1 OSAS is anticipated to be associated
with increased risk of hypertension, cardiovascular disease, stroke, daytime sleepiness, motor vehicle ac-cidents, and diminished quality of life. It is consid-ered that the causal site of the disorders is in the upper airway, which is theoretically divided into the nasal cavity; the area including the adenoids, soft palate and palatine tonsils; and the posterior part of the tongue. OSAS with its origin in the posterior part of the tongue occurs when the tongue muscles relax dur-ing sleep and the tongue falls backward to obstruct
the airway.1 The following neuromuscular response
to altered breathing have been reported in literature:2
1. Altered tongue function and posture. 2. Altered mandibular position and dimension.
Solow and Kreiborg3 stated in their “soft
tissue-stretching hypothesis” that the postural relationship of head and tongue is altered after birth to maintain the airway. A link between respiratory mode and de-velopment of malocclusion could be due to this al-tered soft tissue stretching, which includes the oral and pharyngeal soft tissues. The tongue is surrounded by the mandible and the airway. An enlarged tongue inside a small mandible might move posteriorly and
produce a decreased airway.4 Additionally, patients
with micrognathia are likely to experience airway
obstruction by the tongue.1
Mandibular size and position are one of the fac-tors that bring about a reduction in tongue space and indirectly will influence the pharyngeal space. Lateral cephalometric studies have been used in an attempt to analyze and identify mandibular morphologic pa-rameters that might be characteristic in adult patients
with breathing disorders.2 The inter-relationship of
mandible, tongue and airway has been studied in
Pierre Robin sequence.4 But not many studies are
found in literature pertaining to the mandibular di-mension and tongue in children, which when evalu-ated, would be correlated with the reduction in pha-ryngeal airway space. The size ratio norms for tongue and mandible (T/M ratio) are yet to be reported in children suffering from OSA with respect to body mass index (BMI).
Craniofacial soft tissues can be evaluated by vari-ous methods. Imaging plays a role in anatomic as-sessment of airway and its adjacent structure. It can help in understanding and identifying patients who may be at risk to airway obstructive disorders. But the 2D data may not always totally account for the exact dimensional accuracy. MR imaging offers 3D soft tissue visualization of upper and lower pha-ryngeal structures along with adjacent structure, like jaws and tongue, hence providing an opportunity to
evaluate the functional relationship between them.5
Thus, the present study attempted to investigate tongue/mandible ratio in children, using volumet-ric MRI in an attempt for early diagnosis and to aid in treatment planning. The investigation was car-ried out with the objectives of evaluating tongue volume/mandible volume ratio (TV/MV ratio) in children with OSA and without OSA (control) us-ing magnetic resonance volumetric imagus-ing, and of evaluating whether a direct correlation exists be-tween TV/MV ratio and BMI in children.
MATERIAL AND METHODS
The study protocol was approved by Ethical Com-mittee of the Datta Meghe Institute of Medical Sciences University. The volumetric evaluation was carried out retrospectively on available DICOM MR images (using
a 1.5 Tesla magnetic resonance imaging scanner, BrivoTM
MR355 1.5T; General Electric, Waukesha, WI, USA) for children in the age group of 10-14 years. For the ex-perimental group (OSA), MRI image records for patients diagnosed with OSA (positive polysomnograph) were ob-tained from the records of the Sleep Apnea, Pulmonary Medicine and Interventional Radiology departments. The age, gender, height and weight of the subjects were retrieved from patient database and registered. A total of 12 scans fulfilling the age criteria and with sufficient di-agnostic clarity were included in the study. In the control group, available MRI images of healthy subjects without obstructive sleep apnea were included. The scans were re-trieved from patient database at interventional radiology department records and only those who were admitted to any other departments except pulmonary medicine were included as healthy subjects scan. Body mass index (BMI) for both groups was calculated from the height and the weight as per record according to the formula:
Figure 1 - Tongue volume (TV) computation using DICOM image with Osirix. Figure 2 - Mandibular volume (MV) computation using DICOM image with Osirix
The image processing and anatomic measure-ments from MR images was made using DICOM image processing software (OsiriX v. 5.6, Biomedi-cal Visualizers, Geneva, Switzerland). Soft tissue and bony structure segmentation was performed by manual tracing. All the values were rounded off as per decimals, for easy computations. The tongue and mandibular volumes were directly computed us-ing OsiriX software. The software allows the user to designate the Region of Interest (ROI) in each and individual slice. These individual ROIs were then merged to evaluate and compute the volume of the desired anatomical unit. The OsiriX software allows the user to “sculpt out” the desired volume from the rest of the structure.
The volume of the tongue in cm3 was calculated
from the MRI tracings. The tongue was defined as all of its intrinsic muscles plus the entire genioglossus and hyoglossus muscles (Fig 1).
The mandibular measurements of length, width and depth in centimeters were assessed to determine the dimensions of the lower portion of the mandible. The coordinates for the most anterior-inferior point of
the mandible (gnathion) and the most posterior-inferi-or points of the mandible (left and right gonion) were identified on the corresponding frontal/coronal MRI slices. Mandibular body length (LM) was measured as the average distance from the gnathion to the left and right gonion, and mandibular width (WM) was
mea-sured as the distance between the left and right gonion.5
Mandibular depth was derived using the measurements as per Pythagoras’ theorem. A triangular representation of the mandible is shown in Figure 2.
Mandibular depth (DM) was estimated using
Py-thagoras’ theorem as: DM=√(LM2 – {WM/2}2).
Thus, the mandibular volume (MV), expressed in
cm3, was obtained as: MV = 1/3 WM * DM.
The 3D reconstructions were produced using the viewer, and Curved MPR (Curved Multi-Planar Reformation) rendered image from a 3D dataset was obtained. The technique was implemented in this study using OsiriX software by fusing three-dimen-sional MRI images of the tongue (Fig 1).
RESULTS
Statistical analyses were performed using SPSS version 17.0 for Mac (SPSS Inc; Chicago, Illinois, USA) software. All descriptive statistics are presented as mean ± SD. Descriptive statistics were calculated for age, BMI, tongue volume/mandible volume ra-tio in experimental and control groups. The obtained data was checked by normalcy curve and it was found to be in the normal range.
To know the difference between the mean of two
groups, unpaired t-test was used. Correlation
be-tween BMI and TV/MV ratio was analyzed using the
Pearson correlation coefficient test. A p-value of less
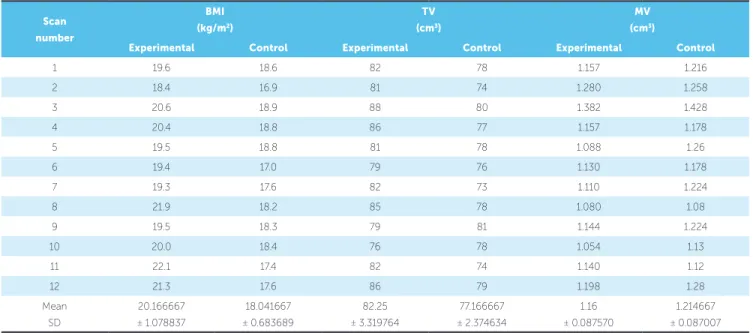
than 0.05 was considered to indicate statistical signif-icance. The mean BMI (20.166667 ± 1.078837) and mean TV (82.25 ± 3.319764) were found to be higher in experimental group, as compared to control group (Table 1). The difference between experimental and control groups with respect to TV/MV ratio was found to be highly significant at 0.05 using unpaired
t-test (p = 0.0005, Table 2). There was no significant
correlation between BMI and TV/MV ratio in
ex-perimental group (p = 0.451) as well as control group
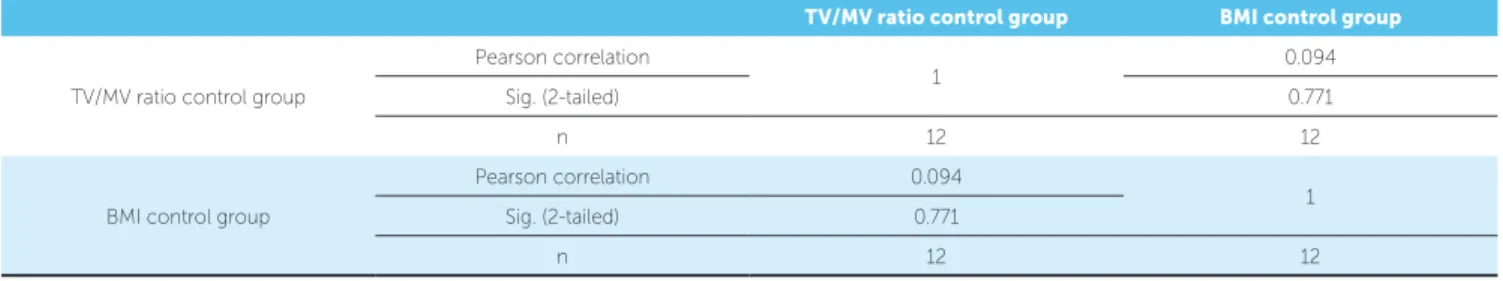
(p = 0.094, Tables 3 and 4).
Scan
number
BMI
(kg/m2)
TV
(cm3)
MV
(cm3)
Experimental Control Experimental Control Experimental Control
1 19.6 18.6 82 78 1.157 1.216
2 18.4 16.9 81 74 1.280 1.258
3 20.6 18.9 88 80 1.382 1.428
4 20.4 18.8 86 77 1.157 1.178
5 19.5 18.8 81 78 1.088 1.26
6 19.4 17.0 79 76 1.130 1.178
7 19.3 17.6 82 73 1.110 1.224
8 21.9 18.2 85 78 1.080 1.08
9 19.5 18.3 79 81 1.144 1.224
10 20.0 18.4 76 78 1.054 1.13
11 22.1 17.4 82 74 1.140 1.12
12 21.3 17.6 86 79 1.198 1.28
Mean
SD
20.166667
± 1.078837
18.041667
± 0.683689
82.25
± 3.319764
77.166667
± 2.374634
1.16
± 0.087570
1.214667
± 0.087007
Table 1 - Descriptive statistics for body mass index (BMI), tongue volume (TV), and mandibular volume (MV) in experimental and control groups.
Table 2 - Descriptive statistics for TV/MV ratio in experimental and control groups.
TV/MV ratio n Mean ± SD Std. error
mean Mean difference
95% Confidence interval
of the difference p-value
Lower Upper
Experimental
group 12 71.1647 ± 4.38150 1.26483 71.16468 68.3808 73.9485 0.0005*
Control group 12 63.8027 ± 4.49868 1.29866 63.80271 60.9444 66.6610
DISCUSSION
According to the Functional Matrix Theory of
Moss,6 there is close interrelationship in the
func-tions of swallowing and breathing. Humans are pre-dominantly nasal breathers. In case of breathing or airway obstruction, the body adopts one or all three neuromuscular responses i.e. an altered mandibular posture, an altered tongue posture and an extended head posture. In children with obstructive breathing diseases, the most common etiologic factors may be related with hypertrophic tonsils, alterations in cra-niofacial growth, retrognathia, macroglossia, obesity
and neurological lesions.7
With respect to craniofacial parameters playing role in OSA: since the mandible and the airway surround the tongue, and the tongue occupies the space between the maxillary and mandibular dental arches when the mandible is in its physiologic rest position; the pres-ence, size and activity of this large muscular organ has a definite moulding and shaping influence on the form and size of the palate and the dental arches. An enlarged tongue inside a small mandible might move posteri-orly and produce a decreased airway. Obesity has al-ways been thought to be a confounding factor in OSA. The relation between BMI (as obesity is a common etiologic factor for OSA) and the ratio of tongue vol-ume and mandible volvol-ume (TV/MV ratio) has not yet
been reported in children. In this study, the correlation of TV/MV ratio and BMI was investigated with a 3D reconstructed model from MRI data.
The subjects in the age range of 10-14 years were selected to observe soft tissue and hard tissue differ-ences. Nearly 90% of the maxillary and mandibular growth is completed by 12 years of age, so most of the formation or deformation occurs by that age. The di-mensions of the pharynx continue to grow rapidly
until 12 years of age and then slow until adulthood.8
In the present study, based on these data, the age group of growing children was selected to evaluate effect of tongue and mandible on breathing in OSA.
Tongue volume is an important parameter ana-lyzed in the present study. This has been of consid-erable interest as it plays a central regulatory role in
the craniofacial complex development. Song and Pae9
suggested that enlarged tonsils increase the upper airway resistance, which might facilitate the activity of oropharyngeal muscles (genioglossus, mylohyoid, etc.) through mechanoreceptors in the upper airway. This action would bring the tongue forward and downward, opening the mouth for better respiration. And it could also result in a downward and backward rotation of the mandible. In the present study, larg-est mean of tongue volume was found to be in OSA group. With these findings we can presume that
in-Table 3 - Pearson correlations between BMI and TV/MV ratio in experimental group.
Table 4 - Pearson correlations between BMI and TV/MV ratio in control group.
TV/MV ratio experimental group BMI experimental group
TV/MV ratio experimental group
Pearson correlation
1 0.451
Sig. (2-tailed) 0.141
n 12 12
BMI experimental group
Pearson correlation 0.451
1
Sig. (2-tailed) 0.141
n 12 12
TV/MV ratio control group BMI control group
TV/MV ratio control group
Pearson correlation
1 0.094
Sig. (2-tailed) 0.771
n 12 12
BMI control group
Pearson correlation 0.094
1
Sig. (2-tailed) 0.771
creased tongue volume can probably be a craniofacial anatomic risk factor for development of breathing disorders and OSA. But this does not rule out that patients with smaller tongue volumes relative to oral cavity size may not have other (e.g. non-anatomic) factors predisposing to breathing disorders and apnea. This possibility demands further investigation.
Our findings also confirmed that due to an in-creased tongue volume, more tongue mass would occupy the upper airway space, and this in turn could make the upper airway more prone to ob-struction. These findings were corroborated by the
findings of Iida-Kondo et al,1 who reported that
patients with sleep-disordered breathing tended to have larger tongues, compared to patients without sleep-disordered breathing.
Our study also evaluated the mandibular
dimen-sion and volume. The observations by Solow et al3,10
supported that the airway adequacy was related to the size and position of the mandibular variable rather than maxillary variables. However, as per our findings, it was not found to be significantly dif-ferent between the two groups. Our findings were contradictory, which could be attributed to the eth-nic differences and unique anthropological features in Indian population.
Adding another dimension to the present investi-gation, we derived the mandibular area measurements according to the Pythagoras’ theorem. In an attempt to find out the correlation between BMI and TV/MV ratio, we carried out a correlation analysis. However, no significant correlation was found. The primary risk factors for OSA are either obesity or having an abnormal upper-airway anatomy. In previous stud-ies, the soft and hard tissue structures were analyzed
with cephalometric images. Yu et al11 reported that
obese OSA patients had a longer tongue than did simple snorers and non-obese OSA patients. How-ever, these early reports were limited to the analyses of data obtained from the sagittal view. Recent stud-ies have demonstrated that 3-dimensional (3D) MRI and Cone-Beam Computed Tomography techniques performed while the patient is awake are suitable for evaluation of upper airway volume in OSA patients.
Schwab et al12 analyzed the upper airway soft tissue
structures 3-dimensionally with an advanced analy-sis technique via MR imaging. They concluded that
the volume of the tongue and lateral pharyngeal walls were shown to independently increase the risk of
sleep apnea. On the other hand, Okubo et al13
car-ried out a similar study and reported that the tongue volume was not significantly different between OSA and controls, and the tongue volume did not corre-late with BMI. The results of the present study are
corroborated by Okubo et al.13 Recent evidence
sug-gests that the mechanisms underlying apnea are high-ly variable, with some patients having primarihigh-ly an anatomic problem. It has been shown that in addition to individual anatomic factors, relationships between soft-tissue and bony enclosure size are altered, a con-cept termed anatomic balance.
In 2006, Iida-Kondo et al1 compared the tongue
volume/oral cavity volume (TV/OCV) ratio be-tween 20 male patients with OSA and 20 normal male adults. They described that BMI was signifi-cantly correlated with tongue volume in the OSA patient group, which is not consistent with our re-sults. In the present study, the BMI was found to be consistently lower, in average 10% less in the con-trol group. An increased tongue volume was found in OSA group; however, the mandible volume was found to be similar in both groups.
We thus presume that in OSA patients, the man-dible is less able to properly accommodate the in-creased tongue volume. As a result, the enlarged tongue moves posteriorly, decreasing the airway volume. As tongue volume increases, the airway volume decreases and thus is likely to be involved in the development of OSA.
LIMITATIONS
Prospective studies, with a larger sample size and including subjects from different ethnic populations would give a better outlook towards the delicate cra-niofacial anatomic balance disruption in OSA.
CONCLUSION
We conclude that TV/MV ratio may be an appro-priate variable to screen risk factors for OSA (with-in the scope of the present paper), represent(with-ing the balance between skeletal morphology and soft tissue morphology in craniofacial complex.
The acquired knowledge on tongue/mandible volu-metric ratio can be utilized clinically as a diagnostic aid in determining the anatomic risk factors in craniofacial region for development of OSA at an early age. The ob-tained values could be a guiding factor for further large-scale studies to correlate severity of OSA with respect to BMI, age and other biological parameters.
ACKNOWLEDGEMENTS
The authors are thankful to Indian council of medical research (ICMR) STS for the financial as-sistance to carry out this study.
1. Iida-Kondo C, Yoshino N, Kurabayashi T, Mataki S, Hasegawa M, Kurosaki N. Comparison of tongue volume/oral cavity volume ratio between obstructive sleep apnea syndrome patients and normal adults using magnetic resonance imaging. J Med Dent Sci. 2006 June;53(2):119-26.
2. Woodside DG, Linder-Aronson S, Lundstrom A, McWilliam J. Mandibular and maxillary growth after changed mode of breathing. Am J Orthod Dentofacial Orthop. 1991 July;100(1):1-18.
3. Solow B, Kreiborg S. Soft-tissue stretching: a possible control factor in craniofacial morphogenesis. Scand J Dent Res. 1977 Sept;85(6):505-7. 4. Shigeta Y, Ogawa T, Ando E, Clark GT, Enciso R, Kurosaki N, et al. Influence
of tongue/mandible volume ratio on oropharyngeal airway in Japanese male patients with obstructive sleep apnea. Oral Surg Oral Med Oral Pathol Oral Radiol Endod. 2011 Feb;111(2):239-43.
5. Sharma K, Shrivastav S, Hotwani K. Volumetric MRI evaluation of airway, tongue and mandible in different skeletal patterns: does a link to Obstructive Sleep Apnea exist (OSA)? Int J Orthod Milwaukee. 2016 Fall;27(3):39-48. 6. Moss ML. The primacy of functional matrices in orofacial growth. Dent Pract
Dent Rec 1968 Oct;19(2):65-73.
REFERENCES
7. Sinha D, Guilleminault C. Sleep disordered breathing in children. Indian J Med Res. 2010 Feb;131:311-20.
8. Schendel SA, Jacobson R, Khalessi S. Airway growth and development: a computerized 3-dimensional analysis. J Oral Maxillofac Surg. 2012 Sept;70(9):2174-83.
9. Song HG, Pae EK. Changes in orofacial muscle activity in response to changes in respiratory resistance. Am J Orthod Dentofacial Orthop. 2001 Apr;119(4):436-42. 10. Solow B, Skov S, Ovesen J, Norup PW, Wildschiødtz G. Airway dimensions and
head posture in obstructive sleep apnoea. Eur J Orthod. 1996 Dec;18(6):571-9. 11. Yu X, Fujimoto K, Urushibata K, Matsuzawa Y, Kubo K. Cephalometric analysis in
obese and nonobese patients with obstructive sleep apnea syndrome. Chest. 2003 July;124(1):212-8.
12. Schwab RJ, Pasirstein M, Pierson R, Mackley A, Hachadoorian R, Arens R, et al. Identification of upper airway anatomic risk factors for obstructive sleep apnea with volumetric magnetic resonance imaging. Am J Respir Crit Care Med. 2003 Sept 1;168(5):522-30.