Bolm Inst. oceanogr., S Paulo, 31 (2) :85-94, 1982
STANDING-STOCK AND POTENTIAL OF PHYTOPLANKTON PRODUCTION IN
THE BAY OF SANTOS, BRAZIL
Sônia Maria Flores GIANESELLA-GALVAO
Instituto de Biociências da Universidade de são Paulo
Synopsis
Phytoplankton primary production and the maximum photosynthetic index (PPmJ from the region of Bay oi Santos were measured every two months during 19?6 by simulated incubations using 14C method and incandescent lamps (?3? ~.m-2 . s-1~40 kluxJ . The results obtained for production rates (maxiw~ of 204.6 mgC.m-3.hr-1 in winter and
488.3 mgC m-S.hr-1 in summerJ are among the highest recorded for tropical marine
environments. A high capabiUty of Ught adaptation under high temperatures was also verified. The photosynthetic indexes obtained were also very high and seems to be due to the high nutrient leveI of the region. The eutrophic state is sup-ported by the high nutrient and chlorophyU-a concentrations and by the phytoplankton cells number.
Introduction
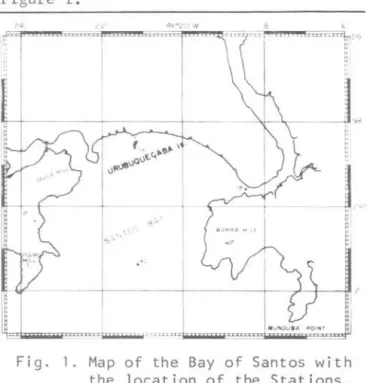
The region of the Estuary and Bay of Santos (24°00'S; 46°26'W), Brazil (Fig. 1) receives a great contribution of do-mestic and industrial wastes, besides those arising from the activities of the Port of Santos. These inputs into the area, an environment with natural eutrophic features, not only increase the speed of the eutrophication process but also contribute significantly to the pollution of the environment.
The study area has been subjected to an intense research program with the objective of providing a comprehensive ecosystem study and the necessary data for further studies and for the manage-ment of the area. A cooperative program between the Companhia de Tecnologia de Saneamento Ambiental (CETESB) and the Instituto Oceanográfico da Universi-dade de são Paulo was established. By this cooperative program, the
hidrological, chemical and biological surveys of the Estuary and Bay were conducted from 1974 through 1977. The present work is based on data collected during 1976, under the mentioned programo
The study of the phytoplankton prima-ry production was undertaken in the present work because this parameter may be a reasonable indicator of eutrophication of the environment and of its progress with time.
Studies on primary production in bays
Pubi. n. Q 54 5
do
I n.J.d. Oc.e.an.o
gft.da
U.ó tJ •and estuarine reg~ons have been carried
out in Brazil by many authors
(Garcia-Occhipinti e;t al., 1961; Teixeira,
1969, 1980; Teixeira
e.t al.,
1969;Tundisi, 1969; Tundisi
e.t al.,
1973)but no one of them, were concerned to polluted environments.
Material and methods
Samples were taken every two months from February through December, 1976, only at surface and at three stations shown in Figure 1.
86
Hydro1ogica1 and chemica1 ana1yses -sa1inity, disso1ved oxygen, pH,nutrients
(nitrite, nitrate, ammonia, ortho-phosphate) and Hg - were made by CETESB according to A.P .H.A. (1971).
Since the disso1ved inorganic carbon in the samp1es cou1d not be deter~ined,
the standard va1ue of 90 mgC021-1 (Gargas, 1975) was assumed for the present work.
Sub-samp1es for phytop1ankton counts were fixed with formo1 solution to a final concentration of 5%. The counts were determined in sedimentation
chambers using an inverted microscope, according to Utermoh1 (1958).
For the spectrophometricch1orophy11-a
ana1ys is, a volume of 0.25
t
seawaterwas fi1tered through 0.45 ~m Mi11ipore
HA fi1ters. Pigments were extraeted in 90% acetone. Detai1s of the methodo1ogy and equations used are described in
Strick1and
&
Parsons (1968).primary production was measured ac-cording to the 14C method (Steemann-Nie1sen, 1952). Samp1es were inocu1ated
with tracer (16 ~Ci in 750 m1 of seawater).
and transferred to 80 m1 glass bott1es. They were incubated for three hours in an incubator with incandescent 1ight
(737 ~E. cm- 2 • S-l or 40 k1ux ) under
differ-ent 1ight intensities, obtained by means of neutra1 fi1ters: 2.0, 5.6, 25.6, 56.5%. A 150.0% va1ue was obtained using a mirror behind the bott1e. Two
(2) light bott1es and one (1) b1ack
were used for each 1ight 1eve1.
After incubation, 25 m1 sub-samp1es from each bott1e were fi1tered through
0.45 ~m Mi11ipore fi1ters.
The fi1ters were submitted to HC1 fumes to e1iminate the inorganic carbono Fi1ter activities were determined by liquid scintillation method according to
Ward
&
Nakanishi (1971). Ca1ibrationwas performed by means of automatic
externa1 standardization. The f1uor was a Bray solution (Bray, 1960) a1ka1ized at 10% with hyamin hidroxide 10-X
(Packard) •
The total 1ight energy was measured with a LIQUOR quantameter, equipped with an underwater sensor for incident photon f1ux density (LI-192S).
Results
Tab1e 1 shows the resu1ts of hydro1ogica1 and chemica1 data. The D.O. saturation percentages were a1ways high (>70.7%)
Bolm Inst, oceanogr" S Paulo, 31(2), 1982
severa1 times showing oversaturation. Sa1inity was between 28.38 and 33.5% at Stations 40 and 24 but at Station 18 it was between 18.48 and 32.41%.
Tempera-ture was high during a11 the samp1ing period (between 19.86 and 27.51°C). pH varied litt1e but a high pH va1ue (8.7) was observed in December, at Station 24, concomitant1y with a high va1ue of disso1ved oxygen.
Both phosphate and inorganic nitrogen showed a gradient increasing toward the estuary entrance. Mean va1ues for
Stations 40, 24 and 18 were respective1y
1.44, 1.98 and 4.22 ~g P-P04.1-1 and
10.84, 15.97 and 21.53 ~gN-(N03+N02+NH3).
l-I. The N:P ratio never exceeded 10. Hg concentrations were high
oc-casiona11y. During winter they were ten times higher than the maximum 1eve1
found by Fitzgera1d
&
Lions (1973) inseawater (0.003 to 0.364 ~g.1-1). The
Table I
-Parameter TI d_ Su'pll "9 time li ght e.t I nct I 00 coe r . 'ihter tempe rature ('C) Sal1 n I ty ('I .. )
0.0. ,aturat i on (t) ,H
N-NH, (,. at.,-l)
H-NO z (u. a t. ,- I) H-NO, (u. at. ,- I)
"
(u. U,I-I)p - p o~ (,. " ,_I)
N-NO ,: P-PO ..
H. (1l9.I-I)
T i de S"'Ipllng time li ght e .. t i nct i on coe f.
Wate r temperature ('C) Si'llinit'f ('I .. )
D. O. saturat i on (t)
,H
N-NHl (u. at.I -, ) N-N0 2 (u, at. 1- I) N-NO, (u. at.I-I )
" (u. H. 1-I)
P-PO .. (u,
" I -, )
H-N0 1 : p-PO ..
H. (llg. l-I)
Tide Samp 1;"9 t i me ligl'lt e .. t i nct i on coe f.
W.ter temperature ('C) Salinity ('1 .. )
D. O. satur.t i on (t) ,H
N-HH, (u. a t . I -._, I)
N-H0 2 (,. at.l )
H-HO, (,. at. ,-1)
,.
(u. a t. I -I)p-PO .. (u. at.' -I)
H-HO, : P-PO ..
H. (llg. ,_I)
Hydrologi cal and chemical pa ramete rs
Stat lon
"
( local dept h; F., A" Ju.hlgn 1'1 i 91'1 100
''+:45 17:45 17 :]0
1.20 0.90 0.90
26.20 26. )0 21.20 J2.lJ 30.83 29.68
90.8 82. 9 107 7
8. o 8.2 R.I
0.00 0.00 0.00 0.70 1.42 2.'4
6. \3 1] .57 12 .'4
7.1) '4.99 '4.28
0.96 1.54 ).6 I
6.7 8.8 3.\
0.00 0.00 2.05
S tat i on 2\ (loca I depth:
hi gh 100
16.45 14 .25 1.50 1.20 26.70 26.20 29.32 28.38 70.7 128.3
8.2 8 I
).57 0.00 1.42 2. I ~
14.28 19.28 19.27 21.42 1.60 2. 29
8.9 8. \
0.00 0.06
5 tat i on 18 ( local depth:
1'11 gh high 100
13.30 II 50 13 . ~O
1.90 1.00 1.70 26.70 24.70 21.20 18.48 30.79 22.66 100.0 112. 3 90. O
7.9 8.4 7.8
50.00 0.00 2. 14
7.85 0.70 1.42
0.70 7.86 5.71 58.55 8.56 9.27 ).80 0.60 9.16
0.2 13.1 0.1
0.00 0.85 0.55 Um) Au. 100 16: 20 1.06 21.20 30.90 127.) 8.0 0.70 2.85 12.85 16 .lto 2.13 6.0 1.50 6.)
1'11 gh 14.45 1.70 19.86 )1.67 83.\ 8. I 0.70 2.1" 7.86 10.70 2.26 3.5 0.15 12m) high 15.20 0.90 20.34 28.83 76.3 8.0 4.28 3.57 17.85 25.70 ".13 \ .3 3.6" Oc' hl gh 1):"5 0.85 21.33 )]. O] 102.9 8. I 0.00 0.00 0.70 0.70 0.19 3.7 0.07
h '91'1 15.55
2.10 21. J1
)1.21 160.0 8.3 0.70 2.111 10.00 12.48 :L~5 \.1 0.25 hi gh 13 . ~O
1.20 20.37 29.76 92.8 8 .• 2. 14 1.42 12.85 16.'" 3.06 \.2 0.10 Doe hlgh
''' : '+5
1.20
25.05 33.50
'48. o
8.3 0.00 0.00 0.70 0.70 0.19 3.7 0.00 lo. 15.00 1.20
27. 5 1
)0.18 250.0 8.7 1.29 0.00 1'1191'1 1 ~."O
GIANESELLA-GALVÃO: Bay of Santos: phytoplankton production
87
highest values occurred at Station 18
(3.64 ~g.l-I in August), but Station 40,
located in the entrance of the Bay, also
indicated a concentration of 2.05 ~g.l-l
in June.
The results of the phytoplankton counts at each sampling period are summa-rized in Table 11. In general, highest cell concentrations occurred during the warmer months. Four diatom genera,
Skeletonema (45%), Cyciotelta (14%), Le.ptoc.ylinciJwl.> (13%), and ChaetOC.VWI.>
(11%) made up about 83% of the annual total cell number. Diatoms from the
genus Skeletonema and phytoflagellate
organisms occurred all time ·and at
sampling stations. However, phyt~fla
gellates represented only 4% of the annual total cell number.
The maximum concentration of
Skeletonema was 39.22 x 10⁶ ce ll s .C I , and was found in December. Phytoflagellate
highest concentration (3.37 x 10³
cells.l- I ) occurred in February. Chlorophyll-a concentration (T ab . 11) was high during summer and relatively low in winter.
The light/photosynthesis curves are shown in Figures 2-4. An inhibition at the maximum energy level could be noted only in samples from Station 24, April, December. On the other hand, the resul ts of five experiments (Station 40,
February, April; Station 24, February and Station 18 February and June)
indi-Table I I - Maximum primary production rates and related factors for the Bay of Santos
S tat i on 40
Feb Ap' Jun Aug Oet Oee
P m ( mg C • m - ) . h -I ) 89. o 156 .7 29.2 101 . I 34.3 48. o
I k ( uE . m -, . s -I ) 423 . 8 5 15.9 3 I 3 . 6 33 1 . 6 285.6 460.6
P m( mgC .mgc h l-a. h -I ) 6.9 7.9 7.5 6.3 5.7 2.8
cl-a ( mg. m-1 ) 14 . 3 19.6 4. O 13 .4 5.7 17. O
c e 1 , n ' 10' . I -I 24.8 18.9 O .8 4.1 0.7 36 . 3
S ta ti on 24
P~ ( mgC. m- l.h-l) 269.9 150.4 23.2 21 .6 219.6 410.8
I k (u E • m -2 . S - I) 525. 1 239.5 396. I 276.4 239.5 350. 1
P~ ( mgC .mgchl-a.h -\) 7.7 8.2 6.5 5.5 4. O 13 . 2
cl-a(mg.m- 1 ) 35.3 28.9 3.6 4. O 55.3 36.9
ce 1 I n' 10' . 1 - I 36.4 O. I O . 3 30.9 39.5
S tat i on 18
Pm(rngC.m-3.h- l ) 430.4 113 . 8 2 O 4.3 21.7 79.2 110.3
I k (uE.m-2.s-l ) 423.8 322.4 313.2 433. O 285.6 322. 4
P~ (m9 C . m9 c h 1 - a • h - I ) 12 .7 5.7 9.3 3 . I 5.3 5 . 8
cl-~dmg . m-') 34.2 2 O . 4 22. O 7.3 15. O 19.2 ce 11 n' 106 • 1 -I 51 .2 20.9 0.3 2.5 I J. 1
cate that the limiting light level can be over the maximum used.
Maximum production rates were general-ly higher during summer (34.3 to 488.4
mgC.m-3.h-l ) than during winter (21.6 to
204.3 mgC.m-3.h-l ) (Tab. II). Daily
rates varied from 237 to 2.247 mgC.m-3 •
day-I during winter (11 h of light) and
from 446 to 6.347 mgC.m-3.day_l during
summer.
The Ik index was graphycally determined according to Talling (1957). The values determined were usually high, (239.5 to
525.1 ~E.m-2.s-1) but they can be higher
yet in the experiments that did not show light saturation.
The photosynthetic indexes (Pg) (mgC.mg chl-a.h- I ) obtained under the optimum light energy levels are showed in Table 11. About 83% of the samples studied showed Pg values above 5.
From the time of sampling through the
end of the incubation period, sa~les
suffered an increase in the temperatures
°
'
averaging 3 C (Tab. III). In three cases the experimental temperature had a variation of 5°C: Station 40, December Station 18, August and December, and just the two lower values of Pg were obtained in Station 40, December and Station 18, August, showing a possible adverse influence of an excessive increase of temperature during the ex-periments.
.00
,o
- _ _ - - - - '00
'0
40
,o
20
.0
~~~7.>_,~F_.~~,~~~~~ o~,.~o-,.~o~~~~.o~~~~~.o.&.
o . , &:. '
Fig. 2. Light/photosynthesis curves and 'kvaluesdetermined in klux
88
Bolm Inst. oceanogr., S Paulo,31(2), 1892
400 '00
T .l: S"TATION 24
APR '00 STAT +ON-18
, E 400
? '00 FE. .,lo
'<8
, E
200 u '00
200 E
'00
100 100
JUH
,
-
,20 20 ,o
10 10 10
I,
100 ocr ou
t
-"'- 1 - - - . . . : 100300
200 50
100
O
20 30 4 0 50 20 30 4 0 50 60 KLU'X
' " !
500 1000
Fig.
3.
Light/photosynthesis curves andIk values determined in klux
and ~E.m-2.s-1 for Station 24.
Table 111
-
Experimental tempe ratu redata
Statlon 40
Fob Apr Jun Aug Oet Ooe
Temperature at
26. o 26. o 21.0 21 ,o 21 . o 25 . o
IUlpllng time
Temperature at
29 . O 28. O 24 . O 25 ,o 22 . O 32 . O
end of Incubation
"axlmum experimental 2.0 2. O 3. O 4. O 1. O 7. O temperature varlation
Station 24
Tel1lper~t ure at 27 . O 26. O 19 . O 20 . O 21. O 28 . O sampllng time
Tcmperature at 26 , O
29. O 23. O 21.5 24.0 31 , O
end of incubation
Max I mum experimental -1. O 3. O 4 . O 1,5 3,0 3 , O
temperature variatlon
S tat i on 18
Temperature at
27, O 25. O 21 . O 20, O 20, O 24, O
sampllng time
Temperature at
29. o 27. O 24. O 25. O 23. O 30. O
end of Incubatlon
Maximum experimental 2. O 2. O 3. O 5 . O
3 . O 6 . O
temperature var iatlon
'O
~~-L~,O,-~~~~~,-,~~-~~0~~~~'O~~30~-7,40 ,-"~0-.~O , '~~X
1000
Fi9
4.
Light/photosynthesis curves andIk values determined in k 1 ux
and ~E.m-2.s-1 for Station
18.
Discussion and conclusions
The mean annual nutrients gradients recorded agrees with the circulation mode1 suggested by Garcia-Occhipinti
(1972) • According to this author, during high tide the water aff1uence occurs through the bottom with an af-f1uence occurring at the surface 1ayer
(0-1 m) which circulates from the
Estuary out-put, (Station 18) turn round Urubuqueçaba Is1and (near Station 24) and go off the Bay toward SSW (near Station 40); according to
Garcia-Occhipinti (Op. c-U:.. ) , this pattern
remains for about 85% of the time. A comparison between nutrient data from the Bay of Santos and from other nearby regions (Tab. IV) shows that
the region under observation 1S high1y
eutrophicated.
Nutrient concentrations from surface 'coas tal waters facing the studied region
(Brasil , Ministerio da Marinha, 1967) are remarkab1y lower and confirm the
eutrophication of the Bay of Santos.
Caperon
et
ai.
(1971) measuring P-PO,+concentrations at the out-puts of the
~ sewages in Kanehoe Bay, found a mean
GIANESELLA-GAlV~O: Bay of Santos: phytoplankton production
89
slight1y lower than the annua1 mean va1ue for Station 18 in the Bay of Santos.
In non-po11uted waters it is possib1e to find high nutrient va1ues under
upwelling conditions. Wooster & Cronwell
(1958) obtained 2.5 - 3.0 ~gP-PO~.l-I in
Peru coast and Va1entin (1974) observed 1.2 ~gP-PO~.l-1 in the region of Cabo
Frio (RJ). Also nitrogen can be found
in relatively high concenLrations in upwelling situations, 1ike those
de-terrnined by Yoneshigue-Braga
et
ato
(1979) in the region of Cabo Frio:
12.58 ~gat.1-I of total inorganic
nitrogen. In rich waters of the tropical Pacific Ocean, Thomas (1970) recorded
6.33 ~gat.1-I of total inorganic
nitro-gene In polluted estuaries these va1ues
can rise up to 43.0 ~gat.l-I of N-N03,
like those determined by Berland
et
ato
(1973) at the estuary out-fal1 of the Grand Rhone.
Teixeira
&
Gianese11a-Ga1vão (inpreparation), working on bioassays with waters from the Bay of Santos
demon-strate that populations of
Phaeodaetyfum
tnieonnutum
can be mantained at veryhigh densities (about 40.106 ce1l.l- I ).
The low N:P ratios found in the pre-sent work are due to high phosphate concentrations and not to low nitrogen concentrations.
The annual f1uctuations of the
phytop1ankton standing-stock, with higher values in surnrner and lower in winter are
typical for coas tal regions at nearby latitudes (Teixeira, 1969; 1980) due to the maxima of solar radiation and pre-cipitation that occur in 3urnrner. However, at this time of the year there is a
sharp increasing in the organic pollutiQn of domestic origin in the Bay of Santos,
due to the increasing of population ~n
Santos and são vicente towns. This fact, with no doubt, causes a
preponderant fertilizing effect in the
Table
IV -
Nutrient data from the Bay of Santos and other nearbyregi ons
"_glon Nltrate
(pgN. 1 ~ I)
Cananila ( •• tuary) <O. I - 3 . '
Uba t ub. (boy) ' .'6-'."
Santol (co •• ta' wate rs) '.3 -0 . 50
San t os (boy) 0 . 00-19 . 28
Phosphate
(lJgP. I _1)
< 0.1 -'.7
'.'1-' .25 '.1 '.19-9.16
Author
Teixeira . 1980 arasll.l1 l nl 5 tér l o
d. Marinha . '967
Thl s stud y
Bay of Santo s waters.
The standing-stock data found during the surnrner were high even compared with those from other eutrophic regions. In Cananeia, Kutner (1972) found about
19.106 cel1.l- I in surnrner, during the
standing-stock peak. In Santos, the
highest va1ue was 51.2 x 10⁶ cell.l-1 •
Benon
et
ato
(1977) observed in theGolfe de Marseille (polluted),
phrtoplankton populations h~gher than
10 cell.l-1 • In that reg~on,
Sk.uuonema eo.ó;ta;tum
always dominatedin the phytoplankton (up to 99% of the
total phytoplankton). Blanc
et
ato
(1975) studying the Golfe de Fos also
found
S. eo.ó;ta;tum
populationsrepre-senting about 95% of total phytoplankton
that reached up to 73.106 cells.l- I •
Kutner (op. W.) observed S.
e0.6tatum
attaining 88% of the total phytoplankton in the region of Cananeia. ln Santos,
Sk.efuonema
reached up to 99% duringthe summer.
Chlorophyll-a concentrations were
rather high and McCormich
&
Quinn (1975)obtained similar values (3.0-81.0 mgchl-a.m- 3) in a polluted estuary
(Newark Bay, New Jersey). In spite of the climatic differences, both regions present similar pollution problems
(domestic wastes, petrochemical plants,
harbours) • Teixeira (pers. comm.)
*
observed chlorophyll-a concentrations around 100 mg.m- 3 in the Bay of Santos.
The phytoplankton primary production rates were very high, higher than those obtained for other tropical estuaries and bays (Table V). However, mercury concentrations may be affecting the production rates: highest mercury values observed (Station 40, June and Station 18, August) occurred concomitantly with lowest production rates. High mercury concentrations affect some algae
species significantly, and
Sk.efuonema
co.ó;ta;tum
is one of the more sensitive(Overnell, 1976).
The Ik values were also very high. Harris (1978) looking over published data verified that most of the values recorded falI within the range of 50-120 ~E.m-2.s-1 of the photosynthetic active radiation. However the present experiment was done under simulated conditions, and consequently our data are not comparable to those obtained by
*
Teixeira, C. - Inst. oceanogr. da USP,90
Bolm Inst. oceanogr., S Paulo, 31 (2), 1982Harris
(op.
cit.).
Teixeira (1980),working with natural phytop1ankton popu1ations from Ubatuba region, made incubation experiments similar to that
of the present study (~ncandescent 1ight,
maximum of 831.1 ~E.m-2.s-1) and a1so
obtained"very( high Ik va1ues: 460.6 to 813.4 ~Em-2.s-1.
High Ik va1ues indicate that the phytop1ankton from the Bay of Santos presents a "sun pattern" behaviour. This phenomenon is 1ike1y to be due to the high temperature of the water throughout the year and to the thermo-ha1ine stratification of the Bay.
The effect of the temperature over the 1ight adaptation speed has been verified in recent works. Hitchcock
(1980) working with cu1tures of
Sketetonema
co~tatum growing undertemperatures of 2, 10 and 25°C, verified that the maximum adaptation speed was obtained at the 1atter, more similar to the surface temperature from the studied region. This effect is due to the
therma1 dependence of the enzimatic
activities of photosynthesi&. Ma10ne
&
Nea1e (1981) working with Ik index aIs o emphasize the temperature effect over it.
The thermoha1ine iso1atio~ of the
surface 1ayer in region, could a110w the phytop1ankton to remain there and adapt to high 1ight radiations. A rapid adaptation to new 1ight conditions was verified by Marra (1978) who conc1uded that the changes in the photosynthetic capabi1ity depend main1y on the time of exposure at each radiation leveI.
Vincent (1980) a1so verified the fastness of photosynthetic adaptation in natural assemb1ages by changes in the
photosynthetic capabi1ity. In this case, the adaptation process seems to have occurred with time interva1s shorter than a generation. Therefore, the proposed mechanism of adaptation might be sufficient to exp1ain the absence of superficial inhibition phenomena observed at the production profi1es in the present work.
Gianese11a-Ga1vão (1981) studyipg the primary production and temper-ature profi1es in reservoirs of são Paulo State (approximate1y the same latitudes as those of the Bay of Santos) observed a high percentage of production profi1es with surface maxima during therma1 iso1ation of the surface 1ayer
during the diurna1 heating. Due to this adaptation ability and the favourab1e nutritiona1 conditions, it cou1d be expected that a high Pg wou1d occur during summer.
An excessive increase in
temper-ature during incubation probab1y affected the ce11 metabo1ism and accounted for some of the low Pg va1ues obtained in December (Stations 40 and 18). A1so the re1ative1y low plfi va1ue obtained in August (Station 24) may have resu1ted from the same technica1 prob1em.
Recently, the Pg index has been carefu11y studied by severa1 authors
(Gargas
et
al.,1979;
Teixeira, 1980)who have emphasized the inf1uence of diel variations on this parameter, besides those effects due to
temper-ature (Epp1ey
et
al., 1972; Ma10ne
&
Nea1e, 1981), nutritiona1 conditions
(G1ooschenko
&
Cur1 Jr., 1971; Thomas,1980), light regime (Vincent, 1980; Marra, 1978) and species composition
(Par sons
et
al., 1977).
As fie1d work does not a1ways a110w a high accuracy leveI, this index has been used for comparing productivity aspects of severa1 regions of the wor1d in spite of being prob1ematic. The standardization of the 1ight conditions, however, permits more comparab1e resu1ts on the primary production potentia1 of the region than those obtained by "in situ" simu1ated experiments.
Holmes (1958) doing "in situ" experi-ments with natural popu1ations of
phytop1ankton from the tropical Pacific obtained va1ues higher than those from simu1ated experiments at 10 K1ux. In the present work the illumination leveI was higher (60 K1ux) and quantitatively c10ser to natural conditions. But even so, since incandescent 1ight does not reproduce integra11y the solar spectrum, the photosynthetic structure might not have been fu11y uti1ized and the Pg can be subestimated again.
A1though there seems to be a possi-bi1ity of the Pg va1ues having been underestimated, as discussed, previously, the resu1 ts obtained in the Bay of Santos are comparab1e to those of other
eutrophic environments (Tab. V), and are genera11y inc1uded in the range
suggested by Cur1 Jr.
&
Sma11 (1965) asGIANESELLA-GALVAo: Bay of Santos: phytoplankton production 91
Table V - Primary production (mgC.m-3.hr-1 ) and pb indexes (mgC.mgchl a -1.h-1 ) at
m several tropical marine environments
Regian Incubation I 'luminatlon Primary
p!
indexes(mgC.mgchl~' .h-')
Authors
Breton Sound
29°30'N; 89°20'W
BlindBay 29°10'N; 89°00'W
Kaneohe Bay
21°Z7'N; 157°47'W
Idem
Ala Way Canal 21°15'N; 157°50'W
Cananéia Br· (SP) 25°04'S; 47°54'W
Idem
Idem
Ubatuba Br (SP) 23°30'S; 45°06'W
Idem
Bay of Santos Br (SP) 24°00'S: 46°26'w
1ltc method
** Summer ••• Winter
Acknowledgements
"in situ" or
"i n 5 i tu" natural
5 imulated
simulated artificial
"in situ"
natural simulated
.. j n 5 i tu" natural
sitnulated 57 Klux
simulated 16 K lux
"in situ" natural
"in situ" natural
simulated ;; 45 Klux
sir'lulated 60 Klux
This study was conducted as a partial fulfillment for a master dissertation degree and supported by the National Council for Scientific and Technological Development. I would like to thank Dr. C. Teixeira for his guidance in the experimental work and for the valuable discussions. Furthermore, I thank the Instituto Oceanográfico da Universidade de são Paulo and Companhia de Tecnologia de Saneamento Ambiental for providing funds and facilities for this work.
References
A.P.H.A.(American Public Health Associ-ation). 1971. Standard methods for the examination of water and waste-waters, includinã bottom sediments and sludges. l3 r ed. New York, Am. Public Health Ass., AWA-WPCF, 874p.
BENON, P.; BOURGADE, B.
&
KANTIN, R.1977. Impact de la pollution sur
product io n*
(mgC.m-' .h- ' )
0.7-221.0
2.6-189.0
5 . 0- 10 . 0
4.8- 37.9
231 . O
(annua I average)
65.32-206.12** 54.37-117.3]·**
9.86- 70.59
3 . 00- 72.00
I • O I - 28. I 6**
O .24 - 16.24***
34.3-488.4--2 I . 6 - 34.3-488.4--2 O 4 . 3
--*
Thomas • Slmmons (1960)
6.15- 7.94 Doty • Capurro (19.61)
7.15-14.~4 Caperon lá. a.l. (1971)
12 .22 - 16 .3 I- Harrls (1975)
11.80-24 . 00 Telxelr. (1969)
3.28- 6.25 Tundlsl (1969)
0.27-21.18 Tundisl lá. a.l. (1973)
5 . 08- 9.65 Te Ixel ra (1973)
1.36-6 . 80 TeIxeIra (1980)
2.81-13 . 2 Thls study
les ecosystemes mediterraneens côtiers - Aspects planctoniques. These docteur de 3 eme cycle. Marseille, Centre Universitaire
de Marseille-Luminy, 2v.
BERLAND, B. R.; BONIN, D.
J.;
MAESTRINI, S. Y.
&
POINTIER, J. P.1973. Etude de la fertilite des eaux marine àu moyen de tests biolo-giques effectues avec des cultures d'algues. IV-Etude d'eaux côtieres mediterraneennes. Int. Revue ges. Hydrobiol., 58(4):473-500.
BLANC, F.; LEVEAU, M. & BONIN, M. C.
1975. ~cosysteme planctonique.
Structure et fonctionnement en rela-tion avec des phenomenes de dystrophie
(Golfe de Fos). Int. Revue ges.
Hydrobiol., 60(3):359-378.
BRASIL. MINIS~RIO DA MARINHA. 1967.
92
BRAY, G. A. 1960. A simp1e efficient 1iquid scinti11ator for counting aqueous solutions in a 1iquid scinti1-1ation counter. Ana1yt. Biochem., 1:279-285.
CAPERON, J.; CATTELL, S. A.
&
KRASNICK,G. 1971. Phytop1ankton kinetics in
a subtropical estuary: eutrophication. Limno1. Oceanogr., 16(4):599-607.
CURL Jr., H.
&
SMALL, L. F. 1965.Variations in photosynthetic assimi-1ation ratios in natural marine phytop1ankton communities. Limno1.
Oceanogr.,
10
(supp1.):67-73.DOTY, M. S.
&
CAPURRO, L. R. A. 1961.Productivity measurements in the wor1d oceano Part 1. IGY Oceanogr. Rep.,
(4):1-298.
EPPLEY, R. W.; CARLUCCI, A. F.; HOLM-HANSEN, O.; KIEFER, D. A.; McCARTHY,
J. J.
&
WILLIAMS, P. M. 1972.Evi-dence for eutrophication in the sea near Southern Ca1ifornia coasta1 sewage outfa11s. Ju1y, 1970. Ca1COFI Rep .• Calif. Mar. Res. Commn, 16: 74-83.
FITZGERALD, W. F.
&
LIONS, W. B.1973. Organic mercury compounds in coa.sta1 waters. Nature, Lond., 242
(5398):452-453.
GARCIA-OCCHIPINTI, A. 1972. Estudos para o sistema de disposição oceâni-ca de esgotos de Santos e são Vicen-te. Revta DAE, (86):155-176.
; MAGLIOCCA, A. & TEIXEIRA, C. 1961. Diurnal
variation of phytoplankton production and solar radiation in coas tal waters off Cananeia. Bo1m Inst. oceanogr., S Paulo, 11(3):17-40.
GARGAS, E. 1975. A manual for phyto-p1ankton primary production studies in Baltic. Publ. Balt. mar. biologists.
Um. Ag. Environ. Prot., (2) :1-88.
- - - ; HARE, I.; MARTENS, P. &
EDLER, L. 1979. Die1 changes in phytop1ankton photosynthetic
efficiency in brackish waters. Mar. Biol.,52:113-122.
Bolm Inst. oceanogr., S Paulo, 31(2), 1982
GIANESELLA-GALVÃO, S. M. F. 1981. Produção primária e suas relações com alguns fatores físico-químicos em reservatórios do Estado de são Paulo. Tese de Doutorado. Universi-dade de são Paulo, Instituto
Oceano-gráfico, 2 V.
GLOOSCHENKO, W. A.
&
CURL Jr., H. 1971.Inf1uence of nutrient enrichment on photosynthesis and assimi1ation ratios in natural North Pacific phytop1ankton communities. J. Fish. Res. Bd Can., 28(5):790-793.
HARRIS, C. L. 1975. primary production in the Ala Way Canal, a sma11 tropical estuary. Hawaii Inst. of Geophysis. HIG- 75- 7: 1-34.
1978. Photosynthesis, productivity and growth: the
physio1ogica1 eco1ogy of phyto-p1ankton. Arch. Hydrobio1. Beith.
Ergebn. Limno1.,
10(1/4):1-171.
HITCHCOCK, G. L. 1980. Die1 variation in ch1orophy11-a, carbohydrate and protein content of the marine diatom
Sk.e1.e.:ton.e.ma
C.O.6.:ta;tum. Mar. Bio1.,57:271-278.
HOLMES, R.
w.
1958. Size fractionationof photosynthesizing phytop1ankton. Spec. scient. Rep. U.S. Fish. Wi1d. Servo Fisheries, 279:69-71.
KATO, K. 1966. Chemica1 investigations
on the hydrographica1 system of Cana-nela 1agoon. Bo1m Inst. oceanogr., S Paulo, 15(1):1-12.
KUTNER, M. B. B. 1972. Variação esta-cionaI e distribuição do fitoplânc-ton na região de Cananeia. Tese de Doutorado. Universidade de são Paulo, Instituto Oceanográfico, 104p.
MALONE, T. C.
&
NEALE. P. J. 1981.Parameters of 1ight-dependent photo-synthesis for phytop1ankton size fractions in temperate estuarine and coas tal environment. Mar. Biol., 61 : 289-297.
GIANESELLA-GALVAo:
Bay of Santos: phytoplankton production
93
McCORMICK, J.
&
QUINN, P. I. 1975.Phytop1ankton diversity and
ch1orophy11-a in a po11uted estuary. Mar. Po11ut. BulI., 6(7):105-106.
OVERNELL, J. 1976. Inhibition of marine a1ga1 photosynthesis by heavy metaIs. Mar. Bio1., 38(4): 335-342.
PARSONS, T. R.; TAKAHASHI, M.
&
HARGRAVE, B. 1977. Bio1ogica1 oceanographic processes. Oxford, Pergamon Press, 332 p.
STEEMANN-NIELSEN, E. 1952. The use of
radioactive carbon
e
4c)
for measuringorganic production in the sea. J.
Cons. perm. int. Exp1or. Mer, 78:117-140.
STRICKLAND, J. D. H.
&
PARSONS, T. R.1968. A practica1 handbook of sea water ana1ysis. BulI. Fish. Res. Bd Can., (167):1-311.
TALLING, J. F. 1957. Photosynthetic characteristics of some fresh water p1ankton diatoms in re1ation to under-water radiation. New Phyto1., 56:29-50.
TEIXEIRA, C. 1969. Estudo sôbre algu-mas características do fitop1âncton da região de Cananeia e o seu poten-cial fotossintetico. Tese de Douto-rado. Universidade de são Paulo, Fac. Filos. Ciênc. Letr., 82 p.
1973. pre1iminary studies of primary production in the Ubatuba region. Bo1m Inst. oceanogr., S Paulo, 22:49-58.
1980. Estudo quantitativo da produção primária, c1orofi1a-a e
parâmetros abiõticos em relação
ã
va-riação temporal (Lat 23°30'S - Long. 45°06'W). Tese de Livre-Docência. Universidade de são Paulo, Instituto Oceanográfico, 243 p.
; TUNDISI, J. G. &
SANTORO-YCAZA, J. 1969. P1ankton studies in a mangrove environment. VI-Primary production, zoop1ankton standing-stock and some environmenta1 factors. Int. Revue ges. Hydrobio1., 54(2): 289-301.
THOMAS, W. H. 1970. On nitrogen
de-ficiency in tropical Pacific oceanic phytop1ankton: photosynthetic
parameters in poor and rich waters. Limno1. Oceanogr., 75:380-385.
&
SIMMONS, E. G. 1960.Phytop1ankton production in Mississippi
Delta.
In:
Sheppard, F. P.; Ph1eger,F. B.
&
Van Ade1, T. J., eds.-Recent sediments: Northwest Gu1f of
Mexico. Tu1sa, Oklahoma, Am. Ass.
Petro1. Geo1ogists, p. 103-116.
TUNDISI, J. G. 1969. Produção primária,
"standing-stock" e fracionamento do fitop1âncton na região 1agunar de Cananeia. Tese de Doutorado. Univer-sidade de são Paulo, Fac. Fi1os. Ciênc. Letr., 130 p.
---, TUNDISI, T. M.
&
KUTNER,M. B. B. 1973. P1ankton studies in a mangrove environment. VIII-Further investigations on primary production, standing-stock of phyto and zoop1ankton and some environmenta1 factors. Int. Revue ges. Hydrobio1., 58(6):925-940.
UTERM~HL, H. 1958. Zur Vervo1kommnung
der quantitativen phytoplank-tonmethodik. Mitt. Int. Verein. L imno 1. , 9:1-38.
VALENTIN, J. 1974. O plâncton na ressurgência de Cabo Frio (Brasil). II -Primeiras observações sobre a estru-tura física, química e bio1ogica das águas da estação fixa. (Período de 04/02 a 16/04/1973). Pub1ções Inst. Pesq. Mar., (083):1-11.
VINCENT, W. F. 1980. Mechanisms of rapid photosynthetic adaptation in natural phytop1ankton communities. 11 - Changes in photochemica1 capacity as measured by DCMU - induced
chlorophy1l f1uorescence. J. Phycol., 76:568-577.
WARD, F. J.
&
NAKANISHI, M. 1971. Acomparison of Geiger-Mue11er and 1iquid scinti11ation counting methods in estimating primary productivity. Limno1. Oceanogr., 76:560-563.
WOOSTER, W. S.
&
CRONWELL, T. 1958. An94
YONESHIGUE-BRAGA, Y.; MAESTRINI, S. Y.
&
GONZALEZ-RODRIGUEZ, E. 1979.
Fertilite et facteurs nutritionnels limitant la croissance des producteurs primaires des eaux de l'''upwelling''
de Cabo Frio (Bresil). ~tude
prelimi-naire. C. R. Aead. Se. Paris, t 288, serie D-135.
Bolm Inst. oceanogr., S Paulo, 31(2), 1982