ABSTRACT: The objective of this study was to present a classification proposal for coefficients of variation (CV) in Eucalyptus experiments, aiming at providing a useful tool for experiments involving growth, survival and wood quality traits. Ninety-four studies were selected from a search for peer-reviewed journals yielding a total of 508 data. The CVs were classified as low, moderate, high and very high. The mean, standard deviation, maximum and minimum values, skewness and kurtosis were estimated to describe the distribution shape. The Shapiro-Wilk test confirmed that all variables satisfied the
BASIC AREA -
Article
A classification proposal for coefficients of
variation in
Eucalyptus
experiments involving
survival, growth and wood quality variables
Freddy Mora, Osvin Arriagada*
Universidad de Talca - Instituto de Ciencias Biológicas - Talca - Chile.
*Corresponding author: [email protected]
Received: Sept. 25, 2015 – Accepted: Nov. 21, 2015
assumption of normality (p < 0.05). The results indicated that the growth traits had the highest variability, being variables strongly affected by the environment. In contrast, all variables related to wood quality (except extractives) had the lowest range of CVs. In summary, the classification proposed in this report provides a useful tool for researchers interested in estimating the accuracy of their experiments.
Key words: Eucalyptus spp., experimental accuracy, experimental error, rank-ordering.
INTRODUCTION
The accuracy is measured by the magnitude of the experimental error, which is the variation in the results due to the effect of uncontrolled factors (Steel et al. 1996). Therefore, the experimental error is influenced by the accuracy with which the experiments are performed. Accuracy estimation of an experiment is a procedure recommended by various journals in the publication of scientific papers (Oliveira et al. 2009). A low accuracy may lead to incorrect conclusions, increasing the type II error, which is the false conclusion that no significant difference exists when, in fact, there is a difference (Judice et al. 2002). Thus, the existence of a measure to estimate the experimental error is fundamental to compare different studies (Scapim et al. 1995).
In agricultural and forestry research, the precision of an experiment refers to how well the result has been determined, regardless of its proximity to the true value. The coefficient of variation (CV) has been used by researchers to describe the accuracy of their experiments (Dinardo-Miranda and Fracasso 2010; Araújo et al. 2012; Granato
allows guiding researchers on the reliability of their results, where low values of CV are considered accurate.
The knowledge on the distribution of a variable is crucial to perform a classification proposal of CVs, because, when the data are normally distributed, the method that considers the mean and standard deviation to establish the limits of the classification is appropriate (Garcia 1989). In this sense, the Shapiro-Wilk test has been frequently used to verify the normality of CV values (Carvalho et al. 2003; Oliveira et al. 2009; Arnhold and Milani 2011). Moreover, according to Ahad et al. (2011), the Shapiro-Wilk is the most powerful normality test for small to medium sample sizes compared to the other tests, at all levels of skewness and kurtosis. On the other hand, when the data are not normally distributed, Costa et al. (2002) developed a method that does not depend on the normality assumption and, instead of the mean and standard deviation, it considers the median and pseudo-sigma to set the limits in the classification.
In the forest industry, the Eucalyptus genus is one of the most important and studied trees in the world (Schmit et al. 2015). The species are planted primarily for wood and pulp production; therefore, a series of breeding experiments have been conducted to improve growth and wood quality traits (Bundock et al. 2008; Mora and Serra 2014). However, little knowledge exists about the classification of the CV values in Eucalyptus experiments. In fact, Garcia (1989) carried out the only classification reported until now, which was performed for diameter at breast height, total height, cylindrical volume, survival, and failure rate. Therefore, we want to extend the study developed by Garcia (1989), aiming at performing a classification proposal of the CV values in Eucalyptus experiments involving survival, growth, and several wood quality traits.
MATERIAL AND METHODS
In this report, no attempt was made to stratify the data by experimental designs or types of treatments, according to the findings of a survey by Estefanel et al. (1987), who concluded that the variables have a greater effect on the CV classification than the experimental designs. The variables considered were diameter at breast height (DBH), total height (TH) and survival (SURV), and the wood quality traits: syringyl to guaiacyl ratio (S/G), Klason lignin content (KL),
total lignin content (TL), cellulose content (CC), extractives (EXT), Kraft pulp yield (KPY), and wood density (DEN).
Ninety-four studies were selected from a search for peer-reviewed journals published between 1988 and 2015, yielding a total of 508 data. When the CV values were not estimated by the authors, these were calculated as:
where: SD and m are the standard deviation and the mean of the phenotype data, respectively.
In articles where the experiments were performed over various years, the data for each age were considered independently, according to Cornelius (1994). The normality for each variable was evaluated by the Shapiro-Wilk test. The mean, SD, maximum and minimum values, skewness, and kurtosis were estimated to describe the distribution shape. The statistical analysis was performed using the function “basicStats” from the package “fBasics” in R software (R Development Core Team 2010). Additionally, a chi-square goodness-of-fit test at a significance level of 5% was used to confirm whether the observed distribution of each variable differs significantly from the normal distribution. As the variables were normally distributed, the CV classification was performed according to Garcia (1989) in which the values are considered as low when CV < (m − 1SD), moderate (m − 1SD) ≤ CV < (m + 1SD), high (m + 1SD) ≤ CV < (m + 2SD), and very high CV ≥ (m + 2SD).
RESULTS AND DISCUSSION
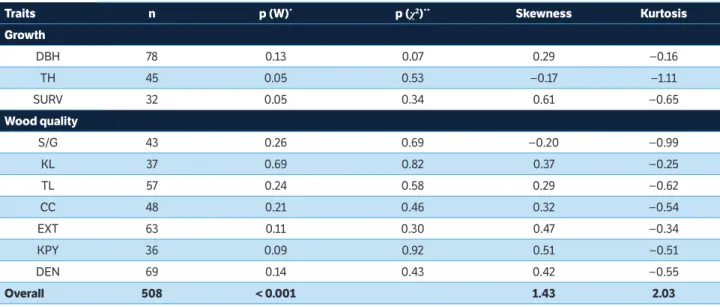
A total of 508 values of CV were obtained from 94 studies involving different species of Eucalyptus. The CV values in each variable were normally distributed according to Shapiro-Wilk test at a significance level of 5% (Table 1). In addition, the chi-square test revealed that the observed distribution for each variable did not differ significantly from the normal distribution (χ2 = 11.07;
5 degrees of freedom; p < 0.05). However, when all the data were analyzed without separating by variable, as performed by Pimentel-Gomes (1985), the normality was not met (p < 0.001). This result emphasizes the importance of analyzing the data per variable and determining its distribution as recommended by Estefanel et al. (1987) and Garcia (1989). Note that, when the data are not normally distributed, the use of the median and pseudo-sigma is more appropriate than the mean
and standard deviation to perform the classification of the CVs (Costa et al. 2002).
As the variables were normally distributed, the shape of the distribution was characterized by the kurtosis and skewness (Table 1). All variables showed positive asymmetry, varying between 0.288 (DBH) and 0.610 (SURV), except for TH (−0.169) and S/G (−0.200) where the asymmetry was negative. The kurtosis values were negative and varied from −0.162 to −1.106 for DBH and TH, respectively. Therefore, the shape of the distri-butions was classified as platykurtic given that it was relatively less peaky than the Gaussian distribution. In order to avoid possible bias due to the shape of the curves, the classification proposed by Costa et al. (2002)was also performed. However, the two methods showed similar classification of the CV values for each response variable (data not shown). This result is in accordance with previous reports by Costa et al. (2002), Carvalho et al. (2003) and Oliveira et al. (2009), who concluded that, when the variable is normally distributed, both methods are equivalent.
In general, the difference between the maximum and minimum values of CV was the highest in the variables related to growth. This result can be explained by the fact that these variables are naturally unstable and, therefore, are subjected to great variability due to the influence of numerous factors that contribute to the error, such as the environmental ones (O’Brien et al. 2007;Fritsche Neto et al. 2012). On the other hand, the variables related to wood quality showed the
narrowest difference between the maximum and minimum values. Therefore, these traits are considered as relatively stable or weakly affected by the environment.
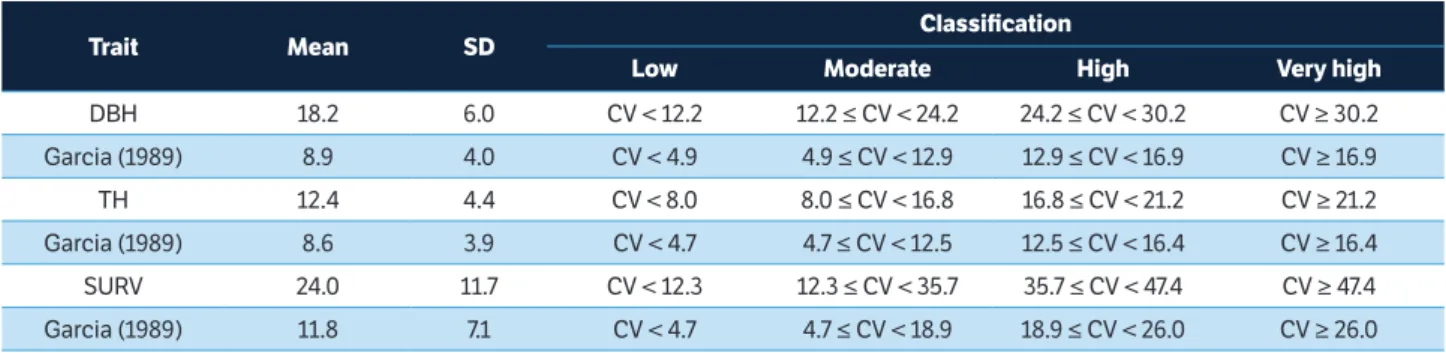
The descriptive statistics and the classification of the CV values are shown in Table 2.Themeans for the DBH, TH and SURV variableswere higher than the general classification previously performed by Garcia (1989)in Eucalyptus (Table 3). This difference in the results may be explained by the fact that Garcia (1989) used studies involving trees between three and seven years old and with three and four replications. According to several studies, these factors should also be considered for a more specific classification (Garcia 1989; Costa et al. 2002; Oliveira et al. 2009).
Generally, when there is not a classification for a particular species and variable, the researchers compare the CV values of their experiments with the ones suggested by Pimentel-Gomes (1985). Thus, as there is not a previous report for the variables of wood quality, the means of the CVs for S/G ratio (2.92%), KL (3.32%), TL (4.19%), CC (2.79%), KPY (3.01%), and DEN (6.61%) were considered low. This indicates that the majority of the variables related to wood quality are stable or weakly affected by the environment, except the EXT variable (17.58%), which was classified as moderate. Therefore, the present classification is recommended to guide researchers on the validity of their results and may lead to correct conclusions in studies involving these variables in Eucalyptus.
Traits n p (W)* p (χ2)** Skewness Kurtosis
Growth
DBH 78 0.13 0.07 0.29 −0.16
TH 45 0.05 0.53 −0.17 −1.11
SURV 32 0.05 0.34 0.61 −0.65
Wood quality
S/G 43 0.26 0.69 −0.20 −0.99
KL 37 0.69 0.82 0.37 −0.25
TL 57 0.24 0.58 0.29 −0.62
CC 48 0.21 0.46 0.32 −0.54
EXT 63 0.11 0.30 0.47 −0.34
KPY 36 0.09 0.92 0.51 −0.51
DEN 69 0.14 0.43 0.42 −0.55
Overall 508 < 0.001 1.43 2.03
Table 1. Normality test and shape of the distribution of the coefficient of variation values for survival, growth and wood quality variables in Eucalyptus.
Trait Min Max Mean SD Classification
Low Moderate High Very high
DBH 5.0 31.2 18.2 6.0 CV < 12.2 12.2 ≤ CV < 24.2 24.2 ≤ CV < 30.2 CV ≥ 30.2
TH 4.2 21.0 12.4 4.4 CV < 8.0 8.0 ≤ CV < 16.8 16.8 ≤ CV < 21.2 CV ≥ 21.2
SURV 6.4 48.3 24.0 11.7 CV < 12.3 12.3 ≤ CV < 35.7 35.7 ≤ CV < 47.4 CV ≥ 47.4
S/G 0.5 5.2 2.9 1.3 CV < 1.6 1.6 ≤ CV < 4.2 4.2 ≤ CV < 5.5 CV ≥ 5.5
KL 0.4 7.3 3.3 1.5 CV < 1.8 1.8 ≤ CV < 4.8 4.8 ≤ CV < 6.3 CV ≥ 6.3
TL 0.7 9.7 4.2 2.1 CV < 2.1 2.1 ≤ CV < 6.3 6.3 ≤ CV < 8.4 CV ≥ 8.4
CC 0.1 6.5 2.8 1.6 CV < 1.2 1.2 ≤ CV < 4.4 4.4 ≤ CV < 6.0 CV ≥ 6.0
EXT 2.3 42.8 17.6 9.2 CV < 8.4 8.4 ≤ CV < 26.8 26.8 ≤ CV < 36.0 CV ≥ 36.0
KPY 1.4 6.3 3.0 1.2 CV < 1.8 1.8 ≤ CV < 4.2 4.2 ≤ CV < 5.4 CV ≥ 5.4
DEN 2.4 12.5 6.6 2.3 CV < 4.3 4.3 ≤ CV < 8.9 8.9 ≤ CV < 11.2 CV ≥ 11.2
Overall 0.1 48.3 9.9 8.9 CV < 1.0 1.0 ≤ CV < 18.8 18.8 ≤ CV < 27.7 CV ≥ 27.7
Table 2. Descriptive statistics and classification of coefficients of variation for survival, growth and wood quality variables in Eucalyptus.
SD = Standard deviation; DBH = Diameter at breast height; CV = Coefficient of variation; TH = Total height; SURV = Survival; S/G = Syringyl to guaiacyl ratio; KL = Klason lignin content; TL = Total lignin content; CC = Cellulose content; EXT = Extractives; KPY = Kraft pulp yield; DEN = Wood density.
CONCLUSION
In this study, several values of CV were calculated using the formula described in the “Material and Methods” section. In addition, many reviewed studies not even showed the parameters for calculating the CV. This somehow proves that researchers are not always aware of the precision with which their experiments are performed; therefore, it may generate incorrect conclusions when comparing their results with other studies. The growth traits are relatively unstable or strongly affected by the environment, making it difficult to control the experimental error. In contrast, according to the results, wood quality traits are stable or weakly affected
Trait Mean SD
Classification
Low Moderate High Very high
DBH 18.2 6.0 CV < 12.2 12.2 ≤ CV < 24.2 24.2 ≤ CV < 30.2 CV ≥ 30.2
Garcia (1989) 8.9 4.0 CV < 4.9 4.9 ≤ CV < 12.9 12.9 ≤ CV < 16.9 CV ≥ 16.9
TH 12.4 4.4 CV < 8.0 8.0 ≤ CV < 16.8 16.8 ≤ CV < 21.2 CV ≥ 21.2
Garcia (1989) 8.6 3.9 CV < 4.7 4.7 ≤ CV < 12.5 12.5 ≤ CV < 16.4 CV ≥ 16.4
SURV 24.0 11.7 CV < 12.3 12.3 ≤ CV < 35.7 35.7 ≤ CV < 47.4 CV ≥ 47.4
Garcia (1989) 11.8 7.1 CV < 4.7 4.7 ≤ CV < 18.9 18.9 ≤ CV < 26.0 CV ≥ 26.0
Table 3. Comparison of the results with those obtained by Garcia (1989) for survival and growth variables in Eucalyptus.
SD = Standard deviation; DBH = Diameter at breast height; CV = Coefficient of variation; TH = Total height; SURV = Survival.
by the environment. In summary, the proposed classification provides a useful tool for researchers interested in estimating the accuracy of their experiments involving growth and wood quality traits.
ACKNOWLEDGMENTS
Ahad, N. A., Yin, T. S., Othman, A. R. and Yaacob, C. R. (2011). Sensitivity
of normality tests to non-normal data. Sains Malaysiana, 40, 637-641.
Araújo, L. F., Almeida, W. S., Bertini, C. H. C. M., Vidal Neto, F. C. and
Bleicher, E. (2012). Correlations and path analysis in components
of fiber yield in cultivars of upland cotton. Bragantia, 71, 328-335.
http://dx.doi.org/10.1590/S0006-87052012005000036.
Arnhold, E. and Milani, K. F. (2011). Rank-ordering coefficients of
variation for popping expansion. Acta Scientiarum. Agronomy,
33, 527-531. http://dx.doi.org/10.4025/actasciagron.v33i3.11911.
Bundock, P. C., Potts, B. M. and Vaillancourt, R. E. (2008). Detection
and stability of quantitative trait loci (QTL) in Eucalyptus globulus.
Tree Genetics & Genomes, 4, 85-95. http://dx.doi.org/10.1007/
s11295-007-0090-4.
Carvalho, C. G. P., Arias, C. A. A., Toledo, J. F. F., Almeida, L., Kiihl, R.
A., Oliveira, M. F., Hiromoto, D. M. and Takeda, C. (2003). Proposal
to categorize coefficients of variation for yield and plant height in
soybean. Pesquisa Agropecuária Brasileira, 38, 187-193. http://
dx.doi.org/10.1590/S0100-204X2003000200004.
Cornelius, J. (1994). Heritabilities and additive genetic coefficients
of variation in forest trees. Canadian Journal of Forest Research,
24, 372-379. http://dx.doi.org/10.1139/x94-050.
Costa, N. H. A. D., Seraphin, J. C. and Zimmermann, F. J. P. (2002).
A new method of variation coefficient classification for upland rice
crop. Pesquisa Agropecuária Brasileira, 37, 243-249. http://dx.doi.
org/10.1590/S0100-204X2002000300003.
Couto, M. F., Peternelli, L. A. and Barbosa, M. H. P. (2013). Classification
of the coefficients of variation for sugarcane crops. Ciencia Rural,
43, 957-961. http://dx.doi.org/10.1590/S0103-84782013000600003.
Dinardo-Miranda, L. L. and Fracasso, J. V. (2010). Spatial and
temporal variability of plant-parasitic nematodes population
in sugarcane. Bragantia, 69, 39-52. http://dx.doi.org/10.1590/
S0006-87052010000500006.
Estefanel, V., Pignataro, I. A. B. and Storck, L. (1987). Avaliação do
coeficiente de variação de experimentos com algumas culturas
agrícolas. Proceedings of the Simpósio de Estatística Aplicada à
Experimentação Agronômica. 2; Londrina, Brazil.
Fritsche Neto, R., Vieira, R. A., Scapim, C. A., Miranda, G. V. and
Rezende, L. M. (2012). Updating the ranking of the coefficients of
variation from maize experiments. Acta Scientiarum. Agronomy,
34, 99-101. http://dx.doi.org/10.4025/actasciagron.v34i1.13115.
Garcia, C. H. (1989). Tabelas para classificação do coeficiente de
variação. Piracicaba: IPEF. Circular técnica, 171.
Granato, I. S. C., Bermudez, F. P., Reis, G. G., Dovale, J. C., Miranda,
G. V. and Fritsche Neto, R. (2014). Index selection of tropical maize
genotypes for nitrogen use efficiency. Bragantia, 73, 153-159. http://
dx.doi.org/10.1590/brag.2014.021.
Judice, M. G., Muniz, J. A., Aquino, L. H. and Bearzoti, E. (2002).
Evaluation of experimental precision in beef cattle experiments.
Ciência e Agrotecnologia, 26, 1035-1040.
Mora, F. and Serra, N. (2014). Bayesian estimation of genetic
parameters for growth, stem straightness, and survival in Eucalyptus
globulus on an Andean Foothill site. Tree Genetics & Genomes, 10,
711-719. http://dx.doi.org/10.1007/s11295-014-0716-2.
O’Brien, E. K., Mazanec, R. A. and Krauss, S. L. (2007). Provenance
variation of ecologically important traits of forest trees: implications
for restoration. Journal of Applied Ecology, 44, 583-593. http://
dx.doi.org/10.1111/j.1365-2664.2007.01313.x.
Oliveira, R. L., Muniz, J. A., Andrade, M. J. B. and Reiz, R. L.
(2009). Experimental precision on bean crop experiments.
Ciência e Agrotecnologia, 33, 113-119. http://dx.doi.org/10.1590/
S1413-70542009000100016.
Pimentel-Gomes, F. (1985). Curso de estatística experimental.
Piracicaba: Nobel.
R Development Core Team (2010). R: a language and environment
for statistical computing. Vienna: R Foundation for Statistical
Computing.
Santos, J. W., Moreira, J. A. N., Farias, F. J. C. and Freire, E. C. (1998).
Evaluation of variation coefficients of some cotton characteristics:
a proposal of classification. Revista Brasileira de Oleaginosas e
Fibrosas, 2, 35-40.
Scapim, C. A., Carvalho, C. G. P. and Cruz, C. D. (1995). A proposal
of variation coefficient classification for corn growing. Pesquisa
Agropecuária Brasileira, 30, 683-686.
Schmit, R., Mora, F., Emhart, V. I. and Rubilar, R. (2015). Longitudinal
analysis in the selection of Eucalyptus globulus clones under
contrasting water availability conditions. Scientia Forestalis,
43, 217-224.
Steel, R. G., Torrie, J. H. and Dickey, D. A. (1996). Principles and procedures
of statistics: a biometrical approach. New York: McGraw-Hill.