FACULDADE DE CIÊNCIAS
DEPARTAMENTO DE BIOLOGIA ANIMAL
C
OMPARATIVE
A
NALYSIS
O
F
T
HE
E
FFICACY
O
F
M
ULTIMETRIC
I
NDICES
B
ASED ON
F
ISH
C
OMMUNITIES
I
N
O
RDER
T
O
A
SSESS
T
HE
E
COLOGICAL
Q
UALITY
O
F
C
OASTAL
W
ATERS
Sofia Nunes Henriques Margarido Pires
FACULDADE DE CIÊNCIAS
DEPARTAMENTO DE BIOLOGIA ANIMAL
C
OMPARATIVE
A
NALYSIS
O
F
T
HE
E
FFICACY
O
F
M
ULTIMETRIC
I
NDICES
B
ASED
O
N
F
ISH
C
OMMUNITIES
I
N
O
RDER
T
O
A
SSESS
T
HE
E
COLOGICAL
Q
UALITY
O
F
C
OASTAL
W
ATERS
Dissertação orientada pelos:
Professor Doutor Henrique Cabral
Professora Doutora Maria José Costa
Sofia Nunes Henriques Margarido Pires
To all people that in some way contributed to this work I express my sincere gratitude, especially to:
Professor Doutor Henrique Cabral, for all his support, supervision and friendship, for believing in me and for all his enthusiasm during this work even at the moments of bigger difficulties.
Professora Doutora Maria José Costa, for having acceptance to guide this thesis and for the opportunity to join the marine zoology team at the Centro de Oceanografia, FCUL.
To all people of the laboratory, for turning the work moments more grateful, especially the pauses, for all support, care and contributions, which helped me to achieve this challenge…
To Inês Cardoso, for all advices, support, and very interesting discussions of the results and above all for her friendship that helped me to always be “on top of the wave”…
To Joana Marques, for her company in coffees and work afternoons in CCB, for the “Tortas de Azeitão”, for all articles that she send me from New Zealand and above all for her friendship…
To Miguel Pais, for his unconditional support in all moments of this thesis development, since the long fulfilling of matrices to the revision of the manuscript passing by all discussions of the problems found, for his friendship and his fantastic humour that helped me to smile in the hard moments… and now… let’s go diving?
thesis…
To my dog Gastas, to whom thanks can not be missed, even being an old fool, every day and nights he made me company while I wrote the thesis.
To Diogo, for his love, care, patience, for having endured my bad-temperate in the worst days and for providing me everyday with a smile in my face which is essential in order to keep one’s head over her shoulders.
My Family, for their unconditional support, love and care, because each one, in its own way, even the little ones, is a little responsible for what I am today and to succeed in achieving this challenge… Especial to my mother, for believing in me every day of my life and for helping me to make the dream of studying the sea animals come true…
Nas últimas décadas o meio marinho tem sofrido uma crescente degradação em consequência do aumento das actividades antropogénicas, sendo um meio complexo que alberga um grande número que ecossistemas particulares com funções ecológicas vitais para além de suportar um grande número de recursos de elevado potencial económico. Torna-se assim evidente a necessidade de o recuperar e conservar por forma a assegurar a sua utilização sustentável. Apesar de existirem políticas a nível regional e europeu que se referem em parte ao meio marinho não tem existido uma boa articulação entre elas e como consequência a sua implementação não tem sido eficiente. Apenas em 2005 é proposta a Directiva “Estratégia para o Meio Marinho” que pretende, através de um quadro de gestão global entre os vários estados membros, promover a utilização sustentável dos mares e conservar os seus ecossistemas marinhos dando prioridade à consecução de um “bom estado ecológico” até 2021 bem como à continuação da sua protecção prevenindo uma subsequente deterioração. No âmbito desta directiva, os peixes deverão ser utilizados como indicadores biológicos na monitorização e avaliação do estado ecológico. Tendo em conta que a avaliação do estado das comunidades de peixes no meio marinho tem incidido primeiramente sobre o impacto da pesca não existindo nenhum índice multimétrico aplicado a estas comunidades específicas, o presente trabalho teve como objectivos: avaliar a eficácia dos índices existentes na avaliação do estado ecológico; criar um índice que promova a avaliação das comunidades de peixes marinhos tendo em consideração as suas particularidades.
Neste contexto, foram adaptados cinco índices aplicados a comunidades de peixes estuarinos ao meio marinho, o “Community Degradation Index” (CDI), o “Biological Health Index” (BHI), o “Estuarine Biotic Integrity Index” (EBI), o “Estuarine Fish Community Index” (EFCI) e o “Transitional Fish Classification Index” (TFCI). A adaptação dos índices CDI e BHI foi realizada através do ajustamento dos conceitos iniciais dos seus segmentos biológicos, enquanto que para os índices EBI, EFCI e TFCI as suas métricas foram ajustadas através da substituição dos grupos funcionais estuarinos pelos equivalentes grupos funcionais marinhos por forma aos
arenosas subtidais, zonas rochosas subtidais e a zonas rochosas intertidais da costa Portuguesa. Para cada um foi calculada uma situação de referência (“comunidade saudável”) com base no conjunto de dados das zonas avaliadas e de acordo com o tipo de substrato, ajustando também o sistema de valores e a escala ecológica de cada um deles de forma a tornar os índices comparáveis. Considerando a discrepância dos estados ecológicos obtidos na avaliação das mesmas zonas com os vários índices e os padrões de estados ecológicos obtidos de acordo com o tipo de substrato, podemos concluir que os índices não foram coerentes entre si e que não são representativos das comunidades típicas de cada um destes substratos. No geral, com os índices CDI e BHI obtiveram-se sempre os estados ecológicos mais baixos demonstrando que uma simples medida de semelhança ou dissemelhança entre o número de espécies observada e o potencial de referência não é suficiente para avaliar o estado ecológico das comunidades de peixes marinhos. Relativamente aos restantes índices, verificou-se que o TFCI foi o mais exigente uma vez que se obtiveram estados ecológicos mais baixos do que com o EBI e o EFCI. Este facto deve-se à maior capacidade discriminatória do seu sistema de valores. Foi verificada a existência de um padrão de estados ecológicos baixos para as zonas arenosas mais profundas (20-100m), um padrão de estados ecológicos para as zonas de areia de menores profundidades (0-30m) e para as zonas rochosas subtidais, e um padrão de estados ecológicos elevados para as zonas rochosas intertidais. A análise das métricas responsáveis por estes padrões sugere que a avaliação das comunidades de peixes do meio marinho deve ser feita de acordo com o tipo de substrato e profundidade devido às diferenças entre as suas comunidades típicas e ainda que os índices estão totalmente desajustados às comunidades do substrato rochoso intertidal. Os resultados a cima mencionados demonstram que os índices estuarinos, mesmo que adaptados, não servem para avaliar as comunidades de peixes marinhos.
Neste sentido, foi desenvolvido o “Marine Fish Community Index” (MFCI) onde as suas métricas foram divididas por tipologias de acordo com a profundidade e o tipo de substrato: substrato rochoso subtidal, substrato móvel pouco profundo, substrato móvel intermédio e
biológico, estudos anteriores, análise de redundância entre elas (correlação de “Pearson”) e uma análise “Drivers-Pressures-State-Impacts-Response” (DPSIR) de forma a garantir que as principais pressões antropogénicas são possíveis de medir com o MFCI. Além disso, as várias métricas foram separadas em quatro atributos considerados como representativos da estrutura e função das comunidades de peixes marinhos: Diversidade e Composição, Abundância, Função de Viveiro e Integridade Trófica. O sistema de valores adoptado foi semelhante ao do índice TFCI pela sua capacidade discriminatória. A situação de referência foi calculada com base no conjunto de dados disponíveis, onde para cada uma das tipologias de substrato móvel o número máximo observado para cada métrica foi dividido em quintis e cada um dos intervalos obtidos passou a corresponder aos limites dos valores possíveis. Para a tipologia substrato rochoso subtidal o estudo “Arrábida 1999” foi considerado como representativo da sua comunidade típica de rocha, com excepção das métricas relativas ao número de espécies que atingem os 90% de abundância e ao rácio número espécies comerciais/número espécies não comerciais que foram calculadas com a metodologia apresentada para as tipologias do substrato móvel.
O índice foi aplicado a diversas zonas da costa Portuguesa de acordo com a sua tipologia. Em algumas zonas das tipologias de substrato móvel intermédio e profundo obtiveram-se valores baixos com as métricas medidas em proporção de indivíduos dos atributos função de viveiro e integridade trófica. A análise destes resultados sugere que a presença de espécies gregárias nestas zonas determina o valore obtido com estas métricas, tendo sido propostas três hipóteses para solucionar o problema encontrado, que deverão ser testadas no futuro: (1) remover estas espécies gregárias do cálculo destas métricas; (2) substituir as métricas simples por métricas compostas que ponderem em número e abundância as espécies destes atributos; (3) incluir arrastos pelágicos no plano de amostragem de forma a ser possível calcular correctamente as proporções entre os vários grupos funcionais destas tipologias.
Realizou-se ainda um teste de robustez ao índice para verificar o efeito individual de cada uma das métricas no estado ecológico final do índice, recalculando o seu valore final através da
alterações se encontravam no limite entre dois estados ecológicos considerou-se que o índice foi robusto face ao efeito individual de cada métrica. Apesar de ser necessário um bom plano de monitorização para resolver as métricas problemáticas, calcular aquelas em que os dados não estavam disponíveis para serem testadas e calcular/validar a situação de referência de cada tipologia, verificou-se que o MFCI foi eficiente na avaliação dos vários estados ecológicos, uma vez que não se obteve nenhum padrão de estados ecológicos dependente da tipologia avaliada, tal como acontecia com os índices estuarinos adaptados, variando apenas consoante a representatividade do plano de amostragem das zonas. Assim, no presente trabalho, foi pela primeira vez proposta uma abordagem à avaliação do estado ecológico das comunidades de peixes do meio marinho que poderá ser útil não só na aplicação de estratégias europeias como é o caso da “Estratégia para o Meio Marinho” mas também noutros contextos que visem a conservação e recuperação do ambiente marinho.
Palavras-chave:
Directiva “Estratégia para o Meio Marinho”; Avaliação da qualidade ecológica; Índices Multimétricos; Comunidades de Peixes Marinhos; PortugalDue to the increase of the anthropogenic pressures on the marine environment, the assessment of ecological status has become an essential tool to recover and protect it (e.g. European Marine Strategy Directive) emphasising the need for an efficient ecological index applied to this environment. Since none of the fish-based multimetric indices was developed to the marine environment, the present study had two main goals: to evaluate the efficacy of the existing indices and the development of an efficient multimetric index to promote the assessment of the ecological quality of the marine fish communities.
Five estuarine indices were adapted to marine waters through the simple replacement of the functional estuarine groups for the marine ones and tested in fifteen zones of the Portuguese coast divided according to their substrate. Analysis of individual metrics suggests lack of representativeness and consideration for the particularities of each substrate’s typical fish communities. These results strengthened the need of a new multimetric index development by type of substrate and depth.
Recurring to a Drivers-Pressures-Impacts-Responses approach and previous studies, a set of metrics was selected and their redundancy was tested through multiple correlation matrices. Based on these results and ecological meaning of each metric, the Marine Fish Community Index (MFCI) was developed and divided in four typologies. Although, in the future, a good monitoring plan is need in order to solve some metric problems and to validate the reference values, the results of the MFCI application and it robustness test showed that this approach by typology is efficient to assess the ecological status. Therefore, a new index to assess the ecological status was successfully developed and can be applied on the evaluation of the quality of the marine environment.
Keywords:
European Marine Strategy Directive (MSD); Ecological Quality Assessment; Multimetric Indices; Marine Fish Communities; PortugalINDEX
Acknowledgments
………... iResumo
……….. iiiSummary
………... viiCHAPTER 1
General Introduction
………... 1 References………... 5CHAPTER 2
Efficacy of adapted estuarine fish-based multimetric indices as tools for
evaluating ecological status of the marine environment
Abstract………. 9Introduction………... 10
Material and Methods……….. 13
Data Sets………... 13
Adaptation of the CDI and BHI……… 15
Adaptation of the EBI, EFCI and TFCI………... 16
Metrics………. 16
Reference limits………... 18
Score System and Ecological Scale………... 22
Evaluation of adapted indices………... 23
Statistical Analysis………... 24
Results………... 24
Discussion……… 31
Final Considerations………... 40
CHAPTER 3
Development of a fish-based multimetric index to assess the ecological
quality of marine habitats: the Marine Fish Community Index
Abstract………. 48
Introduction……….. 49
Material and Methods……….. 52
Typologies of the study area and data sets………... 52
Drivers-Pressures-State-Impacts-Responses (DPSIR) Analysis………. 56
Metric Selection………... 56
Compiling and testing the candidate metrics………... 56
Combining metrics into the MFCI………... 60
Diversity and Composition Attribute……….. 60
Abundance Attribute……… 62
Nursery Function Attribute……….. 64
Trophic Integrity Attribute………... 65
Reference Situation, Score System and Ecological Scale of the MFCI………... 66
Evaluation and Robustness of the MFCI……….. 71
Results………... 71
Discussion……… 78
Final Considerations………... 82
References………... 83
CHAPTER 4
General Discussion and Final Remarks
………... 92References………... 94
General Introduction
The marine environmental is indispensable to life itself and its a great contributor to economic prosperity and quality of life in the planet (COM, 2005a). The seas and oceans represent 71% of the Earth’s surface and contain about 90% of it biosphere (COM, 2005a). The marine ecosystems play an essential role in the climatic regulation, prevention of the erosion, accumulation and distribution of solar energy, absorption of the carbon dioxide and maintenance of the biological control (Costanza et al., 1998; Beaumont et al., 2007) besides supporting innumerable resources with high economic potential (e.g. some estimates indicated that 40% of the European GDP is provided by the maritime exploration) (COM, 2006).
Actually, there is no doubt that anthropogenic activities produce significant perturbations on the marine ecosystems (Costanza et al., 1998; Diaz et al., 2004; COM, 2005a,c; COM, 2006; Beaumont et al., 2007), which include water pollution provided from variable sources (e.g. agriculture and urban wastes), tourism, fishing, organic compounds, dredging activities, aquaculture, maritime transports and biological pollution among others (Islam and Tanaka, 2004). Due to the increasing impacts of these activities in the last decades the need for quality assessment and monitoring of marine systems has become increasingly important (Deegan et
al., 1997; Whitfield and Elliot, 2002, Reiss and Kröncke, 2005).
In Europe, a large number of policies referring in part to marine environment exist (e.g. Habitats and Birds Directives, Water Framework Directive, Common Fisheries Policy), however, none of them are an integrated policy for protection of all European seas (Borja, 2006; COM, 2005a). For example, the Water Framework Directive (WFD), that was the first European policy to require a commitment to assess the ecological status of water bodies (ground, inland surface, estuarine and marine waters) based on biological indicators (EU, 2000), only covers the narrow band of coastal waters extending one mile on the seaward side from the nearest point of the baseline from which the breadth of territorial waters is measured (Article 2.7; EU,2000),
good management of all their marine ecosystems (Borja, 2006; Mee et al., 2007). On the other hand, at a regional level, it has been verified some lack of articulation between the strategies or conventions (e.g. OSPAR in the North Eastern Atlantic, the Helsinki Convention in the Baltic, the Barcelona Convention in the Mediterranean, the Bucharest Convention in the Black Sea) and consequently their implementation has not been very efficient for the whole marine environments (Borja, 2006; Mee et al., 2007).
Only in October 2005, the European Marine Strategy Directive (MSD) was proposed to the Council and European Parliament with the main goal to “promote the sustainable use of the seas and conserve marine ecosystems” (COM, 2005b,c), giving priority to the attainment of a “Good ecological status” such as prevention of a subsequent deterioration (COM 2005b,c; Borja 2006). This strategy also pretend to fill the implementation failures verified in previous strategies, promoting the articulation and coordination between the regional and the EU approaches (COM 2005a,b; Borja, 2006).
In this sense, each Member State must develop by 2016, a measure plan for its waters accordingly to their marine eco-region (North-East Atlantic Ocean in the case of Portugal), that must have in consideration the global principals and objectives of the MSD and where the conducting lines to achieve or maintain a “good ecological status” are define (COM 2005b,c). To prepare this measure plan to entry in operation at least by 2018, each Member State must do, until the fourth to sixth year after the date of entry into force, an initial assessment of the current environmental status of the marine waters concerned and respective environmental impacts of the anthropogenic activities, a determination of “good ecological status”, to establish a set of environmental targets and a monitoring programme in order to achieve a “good ecological status” by 2021 (COM, 2005 b,c). To assess the ecological status, the structure and community parameters of many biological elements have to be analysed, including: plankton, zooplankton, invertebrate fauna, fish, mammals and seabird populations (Annex II of MDS) (COM, 2005b).
As biological indicators, fishes present countless advantages including; their presence in most of the aquatic systems, with exception of highly polluted; easiness in it identification compared with other biological groups (e.g. invertebrates); some of their samples can be processed through non-destructive methods; their extensive life-history and environmental response information available; their communities usually include a range of species representative of a variety of trophic levels and thus reflect effects at all levels within the food web; their communities contain many functional guilds and so will reflect all components of the ecosystem; the fishes are both sedentary and mobile and thus will reflect the stressor within one area and also gives us the “border” of these effects; they can show external anatomical pathologies when subject to chemical pollution; they have high economic value such that is more simple to the general public to understand the problems on the fish communities than other biological groups (societal coasts of environmental degradation) (Karr, 1981; EPA, 2000a; Whitfield and Elliot, 2002; Harrison and Whitfield, 2004).
Despite out-weighed for the advantages, some limitations exist in the use of fishes as indicators, such as the selective and seasonality nature of samples, sometimes a large sample effort is required to be representative of the community, being mobile they can move away from disturbance and finally they have a relative tolerance to chemical pollution (e.g. heavy metals) (EPA, 2000a; Whitfield & Elliott, 2002; Harrison and Whitfield, 2004). However, the use of fish in the assessment of water quality has been successful in a large number of aquatic systems (e.g. Karr, 1981; Ramm, 1988; Cooper et al., 1994; Deegan et al., 1997; Roth et al., 1998; Quinn et al., 1999; Mercado-Silva et al., 2002; Trebitz et al., 2003; Harrison and Whitfield, 2004; Breine et al., 2007; Coates et al., 2007).
Initially, the ecological indicators were only based on species parameters or metrics of the same community (e.g. diversity, species richness), nevertheless, many of these indicators,
McDonald 2004). Nowadays, the multimetric indices are recognized as a robust and flexible tool comparing with univariated evaluation, once that they result of the combination of various categories of metrics and intend to reflect different environmental conditions (impacts), in fact, they have been successfully applied in different ecosystems with various biological elements (Harrison & Whitfield, 2004; Hering et al., 2006).
James Karr (1981) developed the first fish-based multimetric index applied to the rivers; the Index of Biotic Integrity (IBI). Ever since, as the result of its application to different regions, many versions of IBI have been created (e.g. Roth et al., 1998; Mercado-Silva et al., 2002; Trebitz et al., 2003). The general methodology used in the development of this index still maintains: community characterization with the most significant metrics, index application and comparison of the results with a reference situation (non-impacted community) through the score attribution to each metric (score system) and then the final score index with an ecological quality scale comparison. So, a multimetric index gives us a measure of deviation between normal and expected condition of communities. Actually, beyond the indices applied to rivers and streams (IBI) many fish-based indices have been developed to estuaries (e.g. Ramm, 1988; Cooper et al., 1994; Deegan et al., 1997; Quinn et al., 1999; Paul, 2003; Harrison and Whitfield, 2004; Breine et al., 2007; Coates et al., 2007), but no one was created to assess the ecological status of the marine waters (Diaz et al., 2004).
In general, the main difficulties of the ecological indices application, in particular the multimetric ones, is focused on the establishment of reference conditions and in the lack of generalized methodologies that allow a comprehensive and comparative application (EPA, 2000b). It is also intuitive the need to associate anthropogenic pressures with the ecological status obtained in order to delineate adequate management plans, which aim to minimize these impacts and the sustainable use of resources (EPA, 2000b; Niemi et al., 2004).
To successfully establish the relation pressure-impacts, it becomes essential to understand the answer of the different metrics in the presence of natural and anthropogenic variations and in face of the available data, to choose the adequate metrics at the end and to understand and apply coherently the indices. In this sense and in the MSD context, an ideal index must have three main characteristics: sensitiveness (effective response to low environmental variations), discriminatory ability (identification of the problem source) and broad applicability (susceptible for being used in other regions).
For the above-mentioned, it was clear that the ecological indices are an essential tool in conservation and sustainable management of the marine environment contexts, being necessary more studies relative to its development and application. The present study aims to test the existing indices and development an efficient multimetric index, based on demersal fish communities and their ecological response to anthropogenic pressures, to promote the assessment of the ecological quality of coastal waters.
References
Beaumont, M.J., Austen, M.C., Atkins, J.P., Burdon, D., Degraer, S., Dentinho, T.P., Derous, S., Holm, P., Horton, T., Van Ierland, E., Marboe, A.H., Starkey, D.J., Tomnsend, M., Zarzyoki, T., 2007. Identification, definition and quantification of goods and services provide by marine biodiversity: implications for the ecosystem approach. Marine Pollution Bulletin 54, 253-265.
Borja, A., 2006. The new European Marine Strategy Directive: Difficulties, opportunities, and challenges. Marine Pollution Bulletin 52, 239-242.
Breine, J.J., Maes, J., Quataert, P., Van den Bergh, E. Simoens, I., Van Thuyne, G., Belpaire, C., 2007. A fish-based assessment tool for the ecological quality of the Brackish Schelde estuary in Flanders (Belgium). Hydrobiologia 575, 141-159.
Coates, S., Waugh, A., Anwar, A., Robson, M., 2007. Efficacy of a multi-metric fish index as an analysis tool for transitional fish component of the Water Framework Directive. Marine Pollution Bulletin 55, 225-240.
COM, 2005a. Communication from the Commission to the Council and the European Parliament. Thematic Strategy on the Protection and Conservation of the Marine Environment. COM (2005)504 final, SEC(2005)1290. 9pp.
COM, 2005b. Proposal for a Directive of the European Parliament and of the Council, establishing a Framework for Community Action in the field of Marine Environmental Policy. COM(2005)505 final, SEC(2005)1290. 31pp.
COM, 2005c. Commission Staff Working Document. Annex to the Communication from the Commission to the Council and the European Parliament. Thematic Strategy on the Protection and Conservation of the Marine Environment, and Proposal for a Directive of the European Parliament and of the Council, establishing a Framework for Community Action in the field of Marine Environmental Policy. COM(2005)504 and 505 final, SEC(2005)1290. 79pp.
COM, 2006. EU Marine Strategy - The story behind the strategy. European communities <http://europa.eu.int/comm/environment/water/marine.htm>, 31pp.
Costanza, R., Andrade, F., Antunes, P., Van den Belt, M., Boesch, D.F., Boersma, P.D., Catarino, F., Hanna, S.S., Limburg, K., Low, B., Molitor, M., Pereira, J.G., Rayner, S., Santos, R., Wilson, J., Young, M., 1998. A Economia Ecológica e a Governação Sustentável dos Oceanos. In Constanza, P. & Andrade, F. (eds) A Economia Ecológica e a Governação Sustentável dos Oceanos, FLAD-IMAR- LPN. 11-40 pp, Portugal.
Cooper, J. A. G., Ramm, A. E. L., Harrison, T. D., 1994. The Estuarine Health Index: a new approach to scientific information transfer. Ocean and Coastal Management 25, 103-141.
Deegan, L. A., Finn, J.T., Ayvazian, S.G., Ryder-Kieffer, C.A., Buonaccorsi, J., 1997. Development and validation of an Estuarine Biotic Integrity Index. Estuaries 20, 601-617.
Diaz, R.J., Solan, M., Valente, R.M., 2004. A review of approaches for classifying benthic habitats and evaluating habitat quality. Journal of Environmental Management 73,
165-EPA, 2000a. Estuarine and Coastal Marine Waters: Bioassessment and Biocriteria Technical Guidance. United States Environmental Protection Agency, EPA-822-B-00-024, Washington, 300pp.
EPA, 2000b. Evaluation Guidelines for Ecological indicators. United States Environmental Protection Agency, EPA-620-R-99-005. Washington, 45pp.
EU, 2000. Directive 2000/60/EC of the European Parliament and of the Council of 23 October 2000 establishing a framework for community action in the field of water policy. Official Journal L 327, 1–73pp.
Harrison, T.D., Whitfield, A.K., 2004. A multi-metric fish index to assess the environmental condition of estuaries. Journal of Fish Biology 65, 683-710.
Hering, D., Feld, C. K., Moog, O., Ofenböck, T., 2006. Cook book for the development of a multimetric index for biological condition of aquatic ecosystems: experiences from European AQEM and STAR projects and related initiatives. Hydrobiologia 566, 311-324.
Islam., Md. S., Tanaka, M., 2004. Impacts of pollution on coastal and marine ecosystems including coastal and marine fisheries and approach for management: a review and synthesis. Marine Pollution Bulletin 48, 624-649.
Karr, J.R., 1981. Assessment of Biotic Integrity using Fish Communities. Fisheries 6, 21-27.
Mee, L.D., Jefferson, R.L., Laffoley, D.A., Elliott, M. How good is good? Human values and Europe´s proposed Marine Strategy Directive. Marine Pollution Bulletin (2007), doi:10.1016/j.marpolbul.2007.09.038.
Mercado-Silva, N., Lyons, J.D., Maldonado, G.S., Medina, M., 2002. Validation of a fish-based index of biotic integrity for streams and rivers of central México. Fish Biology and Fisheries 12, 179-191.
Niemi, G.J. & McDonald M.E., 2004. Application of Ecological Indicators. Annual Review of Ecology, Evolution, and Systematics 35, 89-111.
Niemi, G., Wardrop, D., Brooks, R., Anderson, S., Brady, V., Paerl, H. Rakocisnki, C., Brouwer, M., Levinson, B., McDonald, M., 2004. Rationale for a new generation of indicators for coastal waters. Environmental Health Perspectives 11, 979-986.
Paul, J. F., 2003. Developing and applying an index of environmental integrity for the US Mid-Atlantic region. Journal of Environmental Management 67, 175-185.
Quinn, N.W., Breen, C.M., Whitfield, A.K., Hearne, J.W., 1999. An Index for the management of South African estuaries for juvenile fish recruitment from the marine environment. Fisheries Management and Ecology 6, 421-436.
Ramm, A. E. L., 1988. The community degradation index: a new method for assessing the deterioration of aquatic habitats. Water Research 22, 293-301.
Reiss, H., Kröncke, I., 2005. Seasonal variability of benthic indices: An approach to test the applicability of different indices for ecosystem quality assessment. Marine Pollution Bulletin 50, 1490-1499.
Roth, N.E., Southerland, M.T., Chaillou, J.C., Klauda, R.J., Kazyak, P.F., Stranko, S.A., Weisberg, S.B., Hall, L.W., Morgan II, R.P., 1988. Maryland biological stream survey: Development of a fish index of biotic integrity. Environmental Management and Assessment 51, 89-106.
Trebitz, A.S., Hill, B.H., Mccormick, F.H., 2003. Sensitivity of indices of biotic integrity to simulated fish assemblage changes. Environmental Management 32, 499-515.
Whitfield, A.K., Elliott, M., 2002. Fishes as indicators of environmental and ecological changes within estuaries: a review of progress and some suggestions for the future. Journal of fish biology 6, 229-250.
evaluating ecological status of the marine environment
Efficacy of adapted estuarine fish-based multimetric indices as tools
for evaluating ecological status of the marine environment
Sofia Henriques 1, Miguel Pais 1, Maria José Costa 1,2, Henrique Cabral 1,2
1 Universidade de Lisboa, Faculdade de Ciências, Centro de Oceanografia, Campo Grande, 1749-016 Lisboa.
Portugal.
2 Departamento de Biologia Animal, Universidade de Lisboa, Faculdade de Ciências, Campo Grande, 1746-016
Lisboa. Portugal.
Abstract
The assessment of ecological status of marine fish communities required by the European Marine Strategy Directive (MSD) emphasises the need for fish-based ecological indices in marine waters. In this study we adapt five estuarine multimetric indices to the marine environment and apply them in three types of substrates, analysing the metrics responsible for the obtained patterns of ecological status. The results show inefficiency of the Community Degradation Index (CDI) and the Biological Health Index (BHI) in ecological status assessment and disagreement between the Estuarine Biotic Integrity Index (EBI), the Estuarine Fish Community Index (EFCI) and the Transitional Fish Classification Index (TFCI). Analysis of individual metrics suggests lack of representativeness and consideration for the particularities of each substrate’s typical fish communities. None of the tested indices were efficient on the marine environment, urging the need for new marine indices that account for differences between types of substrate and depth.
Keywords: European Marine Strategy Directive (MSD); Multimetric Indices; Ecological
evaluating ecological status of the marine environment
1. Introduction
In the last decades the marine environment has been enduring increased degradation. Being a complex system, it includes a great number of specific ecosystems with vital ecological functions, becoming obvious the need to recover and preserve it (Costanza et al., 1998; COM 2006; Beaumont et al., 2007). In this sense, the European Marine Strategy Directive (MSD) was presented in October of 2005. This directive intends to promote, through a global management, the sustained use of the seas, to preserve the marine ecosystems in order to achieve a “good ecological status” until 2021, and to maintain protection and prevent future deterioration (COM 2005a; Borja 2006). To evaluate ecological status and trace monitoring plans and adequate measures for each geographical area, several biological indicators must be used (Annex II of MSD), namely abundance, distribution and structure (age/size) of fish communities (COM 2005b).
Presently, there aren’t any multimetric indices applied to marine waters using exclusively fish as biological indicators (Diaz et al., 2004). Therefore, in the scope of this work, existing estuarine indices will be adapted and tested in the marine environment, because of the higher similarity between fish community structures, comparatively with freshwater.
Although several estuarine indices have been developed through time (Ramm, 1988; Cooper et
al., 1994; Deegan et al., 1997; Quinn et al., 1999; Paul 2003; Harrison and Whitfield, 2004;
Breine et al., 2007; Coates et al., 2007), only a few can be adapted to the marine environment, namely the “Community Degradation Index” (CDI; Ramm, 1998), the “Biological Health Index” (BHI; Cooper et al., 1994), the “Estuarine Biotic Integrity Index” (EBI; Deegan et al., 1997), the“Estuarine Fish Community Index” (EFCI; Harrison and Whitfield, 2004) and the “Transitional Fish Classification Index” (TFCI; Coates et al., 2007).
evaluating ecological status of the marine environment
Both the CDI and the BHI measure the degree of degradation between the potential community (reference) and the real one (observed), the first using a measure of dissimilarity and the latter a measure of similarity.Being based only on presence/absence data and not taking into account the relative proportions of the various species present, these indices do not provide information about the origin of the possible ecological problem affecting the fish community. Although, they have the advantage of combining health and importance of each specific location in a single and easy to use index (Whitfield and Elliott, 2002).
The remaining indices (EBI, EFCI and TFCI) reflect the relation between anthropogenic changes in the ecosystem and the ecological status of estuarine fish communities. These indices use metrics that correspond to various attributes considered as representative of the main anthropogenic changes on fish communities (e.g. diversity, composition, abundance, nursery function and trophic integrity). The most broadly used methodology for the development and application of multimetric indices consists in the characterization of the composition, trophic and functional structure of the fish communities, according to the most significative and non-correlated metrics (test and selection of metrics), application and comparison of results for each metric with the reference situation (non-impacted community), evaluation of the final score and comparison with an ecological quality scale (check the discrepancy from expected results) (Deegan et al., 1997; Quinn et al., 1999; Paul 2003; Harrison and Whitfield 2004; Hering et al., 2006; Breine et al., 2007; Coates et al., 2007).
The main difficulty presented by some authors in the application of several indices is the definition of reference values (Deegan et al., 1997; Coates et al., 2007). Ideally, the reference condition must be assessed based on undisturbed or low-impact sites. In alternative, historical data, models and expert judgement may be used to represent theoretical reference conditions
evaluating ecological status of the marine environment
concerning the application of indices to the marine environment, stands out the difficulty in obtaining a direct answer concerning the source of pressure and the effect it produces in the environment, due to the fact that this environment is liable to be exposed to multiple stressors, natural and anthropogenic, that, allied to the temporal and spatial variation, make the diagnosis of the relative importance of each one in the marine environment very difficult (Niemi et al., 2004). In spite of these difficulties, multimetric evaluation has been recognized not only as being a more reliable and flexible tool than univariated evaluation (Harrison & Whitfield 2004; Reiss and Kröncke, 2005; Hering et al., 2006), but also as one that makes the communication between researchers, managers, stakeholders and policymakers easier (Ramm, 1988; EPA, 2000; Breine et
al., 2007).
In the last years, most of the studies concerning the adaptation, validation and applicability of indices are only referred to transitional and freshwater systems (e.g. Roth et al., 1998; Mercado-silva et al., 2002; Trebitz et al., 2003; Gabriels et al., 2005; Breine et al., 2007). So far, indices applied to coastal waters only used benthic invertebrates and algae as biological indicators (e.g. Borja et. al., 2000; Chenery and Mudge, 2005; Muniz et al. 2005; Reiss and Krönche, 2005; Mangialajo et al., 2007; Pinedo et al., 2007; Romero et al., 2007).
From the above mentioned, the need for specific studies relative to anthropogenic effects and efficiency tests of ecological evaluation tools becomes evident, so that, in a sustainable management point of view, the ecological quality of the water can be correctly evaluated. With this in mind, the present work aims to test ecological evaluation tools for coastal waters using demersal fish communities and to verify their efficacy in the determination of ecological status in different substrates of the marine environment.
evaluating ecological status of the marine environment
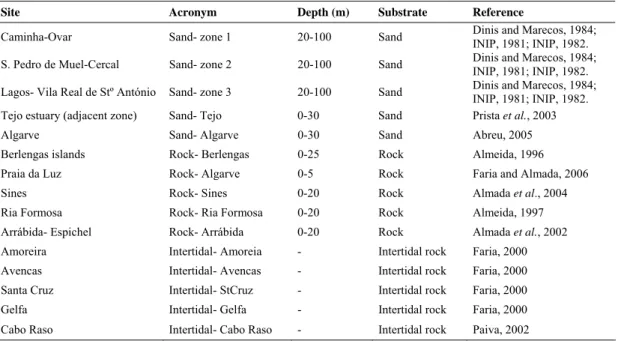
Table 1. Specific characteristics and references of the sites used to test the application of the indices.
2. Material and Methods
2.1 Data Sets
To analyse the performance of the indices in the evaluation of ecological status 15 studies were chosen, 5 from sandy subtidal zones, 5 from rocky subtidal zones and the remaining 5 from rocky intertidal zones (Table 1).
The choice of the studies was based on habitat characteristics (type of substrate), sampling method used, geographical localization and depth of each area, to make the comparison of the ecological status possible, resulting in the application of the adapted indices at each substrate. Each substrate is represented by studies held in the north, centre and south areas of the Portuguese coast, with at least one year of sampling, in order to minimize the effect of seasonality on the ecological evaluation.
Site Acronym Depth (m) Substrate Reference
Caminha-Ovar Sand- zone 1 20-100 Sand Dinis and Marecos, 1984; INIP, 1981; INIP, 1982. S. Pedro de Muel-Cercal Sand- zone 2 20-100 Sand Dinis and Marecos, 1984; INIP, 1981; INIP, 1982. Lagos- Vila Real de Stº António Sand- zone 3 20-100 Sand Dinis and Marecos, 1984; INIP, 1981; INIP, 1982. Tejo estuary (adjacent zone) Sand- Tejo 0-30 Sand Prista et al., 2003 Algarve Sand- Algarve 0-30 Sand Abreu, 2005 Berlengas islands Rock- Berlengas 0-25 Rock Almeida, 1996 Praia da Luz Rock- Algarve 0-5 Rock Faria and Almada, 2006
Sines Rock- Sines 0-20 Rock Almada et al., 2004 Ria Formosa Rock- Ria Formosa 0-20 Rock Almeida, 1997
Arrábida- Espichel Rock- Arrábida 0-20 Rock Almada et al., 2002 Amoreira Intertidal- Amoreia - Intertidal rock Faria, 2000 Avencas Intertidal- Avencas - Intertidal rock Faria, 2000 Santa Cruz Intertidal- StCruz - Intertidal rock Faria, 2000 Gelfa Intertidal- Gelfa - Intertidal rock Faria, 2000 Cabo Raso Intertidal- Cabo Raso - Intertidal rock Paiva, 2002
evaluating ecological status of the marine environment
All the sampling methods of the chosen studies are standard ones for the each substrate type: collection of individuals from pools on the rocky intertidal, visual census on the rocky subtidal areas and bottom trawl on the sandy subtidal areas. This excluded the potential effect that using different sampling methods on the same substrate may have on ecological evaluation.
Each species was characterized according to its feeding guild (invertivore, macrocarnivore, piscivore, omnivore, zooplanktivore, herbivore), functional guild (demersal, pelagic, reef-associated, bathydemersal and benthopelagic), qualitative abundance, main substrate for reproduction (spawning) and development (nursery) and residence or dependence on each of the analysed substrates using information retrieved from the literature and consolidated using expert judgement (Appendix I). Furthermore, the existence of protected, commercially threatened and exotic or introduced species was verified.
The concepts of the several trophic guilds were adapted from Elliot et al. (2007). Species were considered “invertivore” when they feed predominantly on non-planktonic invertebrates while zooplankton feeders (e.g. species that feed on planktonic crustaceans, hydroids and fish eggs/larvae) were considered “zooplanktivore”. “Herbivore” species feed predominantly on macroalgae, macrophytes, phytoplankton and microphytobenthos and “omnivore” species feed on detritus, filamentous algae, macrophytes, epifauna and infauna. Species that feed on macroinvertebrates and vertebrates (mostly fish) were considered “macrocarnivores” and the species that feed almost exclusively on fish were included on the “piscivore” guild. Functional guilds were classified according to FishBase online database (Froese and Pauly, 2007) with concepts adapted from Holthus and Maragos (1995).
evaluating ecological status of the marine environment
Considering that the original data was presented in different measure units, the data from each study was standardised by calculating the proportion of the abundance of each species in order to enable comparison between samples.
2.2 Adaptation of the CDI and BHI
For the calculation of the “Community Degradation Index” (CDI; Ramm, 1998) and “Biological Health Index” (BHI; Cooper et al., 1994), their original metrics were used, adjusting only the initial concepts of the various biological segments.
Originally, the final values of each of these indices corresponded to a measure of dissimilarity (CDI) or similarity (BHI) between the number of observed species (O) and a richness factor (P/Pmax), where P corresponds to the potential number of species of the biological segment in study (specific estuarine area) and Pmax to the potential number of species of all biological segments (whole estuary). Adjusting the concepts of each of the segments to the marine environment and once there is no evident separation between areas of the same substrate in this environment, Pmax was adapted to the maximum number of species observed in each of the substrates (subtidal sandy, subtidal rocky and intertidal rocky areas) and P (optimal potential) to constitute 80% of that maximum potential. This optimal potential was calculated by reducing the inherent variability or “noise” of the maximum potential, with the removal of 20% of the total potential richness, which corresponds to the mean percentage of rare and uncommon captured species that occurred in a total of 88 studies collected for the Portuguese coast. In this way, the optimal potential value is related to the number of species with higher capture probability, above which we can consider an increase in ecological quality that includes an increasing number of rare and uncommon species, until the maximum potential for that substrate is reached.
evaluating ecological status of the marine environment
Table 2. Ecological scale adapted to each index.
These indices were calculated using the following original formulas: CDI = 10 x (1-J) x (logP/logPmax);
BHI = 10 x J x (lnP/lnPmax);
where J = O/P (Jaccard similarity coeficient)
The final values of these indices vary between 0 and 10. For the CDI, the closest to 10 the more degraded the system is, the opposite occurring for the BHI. To make the comparison of these indices with the remaining multimetric ones possible, an ecological quality scale was adjusted by dividing the maximum possible value in quintiles, each of these corresponding to the limits of the several ecological statuses (Bad, Poor, Moderate, Good and Excellent) (Table 2).
Rating CDI score BHI score EBI score EFCI score TFCI score Bad [8 – 10] [0 - 2] [0 - 15] [16 - 20] [0,2 - 0,36] Poor [6 - 8] [2 - 4] [15 - 30] [22 - 38] [0,36 - 0,52] Moderate [4 - 6] [4 - 6] [30 - 45] [40 - 44] [0,52 - 0,68] Good [2 - 4] [6 - 8] [45 - 60] [46 - 62] [0,68 - 0,84] Excellent [0 - 2] [8 - 10] [60 - 75] [64 - 68] [0,84 - 1]
2.3 Adaptation of the EBI, EFCI and TFCI 2.3.1 Metrics
The metrics of the EBI, EFCI and TFCI were adapted taking the basic structure into consideration (organization of the metrics to be evaluated according to ecological function). Due to this fact, only the estuarine functional groups (estuarine metrics) were replaced by equivalent marine functional groups (marine metrics), in order to avoid loss of index integrity (Table 3).
evaluating ecological status of the marine environment
Table 3: Estuarine metrics of each original index and the correspondent adapted marine metrics. An abbreviation of the attribute that each metric represents is also indicated (DC-species diversity and composition, A-species abundance; NF-nursery function; TI-trophic integrity; O-other).
Attribute Estuarine metrics Marine metrics Indices
DC Total number of taxa Total number of taxa EFCI; EBI; TFCI DC Rare or threatened species Commercially threatened species EFCI
DC Exotic or introduced species Exotic or introduced species EFCI DC Species composition (% Bray-Curtis similarity) Species composition (% Bray-Curtis similarity) EFCI A Relative abundance (% Bray-Curtis similarity) Relative abundance (% Bray-Curtis similarity) EFCI; TFCI A Number of species that make up 90% of abundance Number of species that make up 90% of abundance EFCI; EBI; TFCI NF Number of estuarine resident taxa Number of resident taxa in that substrate EFCI; EBI; TFCI NF Number of estuarine-dependent marine taxa Number of dependent taxa in that substrate excluding resident taxa EFCI; TFCI NF Relative abundance of estuarine resident taxa Relative abundance of resident taxa in that substrate EFCI NF Relative abundance of estuarine-dependent marine taxa Relative abundance of dependent taxa in that substrate excluding resident taxa EFCI TI Number of benthic invertebrate feeding taxa Number of invertivore taxa EFCI; TFCI TI Number of piscivore taxa Number of piscivore and macrocarnivore taxa EFCI; TFCI TI Relative abundance of benthic invertebrate feeding taxa Relative abundance of invertivore taxa EFCI TI Relative abundance of piscivore taxa Relative abundance of piscivore and macrocarnivore taxa EFCI A Abundance in number (ln(n+1)) Abundance in number (ln(n+1)) EBI NF Number of nursery species Number of nursery species (in that subatrate) EBI NF Number of estuarine spawners Number of spawning species (in that substrate) excluding resident taxa EBI O Proportion of benthic-associated species Proportion of benthic-associated species EBI O Proportion of disease or abnormal species Proportion of disease or abnormal species EBI TI Feeding guild composition (number) Feeding guild composition (number) TFCI TI Functional guild composition (number) Functional guild composition (number) TFCI DC Presence of "indicator species" Presence of "indicator species" TFCI
evaluating ecological status of the marine environment
For some of the metrics it was not possible to obtain a direct equivalence between estuarine and marine metrics because of the particularities of the marine environment and their fish communities. Therefore, for these cases, the marine metrics chosen as equivalent were based on the initial concept that each author used to measure ecological status.
The metric “rare or threatened species” of the EFCI was selected by Harrison and Whitfield (2004) because it is an additional measure of the conservation value of the ecosystem, once that these species are fragile and tend to decrease with an increase in anthropogenic stress. As the marine environment is very broad and with undefined frontiers, the presence or absence of rare or threatened species cannot be assessed as a direct function of ecological status. For this reason, this metric was replaced by the presence or absence of “commercially threatened species” as a measure of the effect of fishing, as this is the main anthropogenic impact directly affecting the structure of marine fish communities in Portugal.
The metrics, in number of species and abundance, relative to piscivore species of the EFCI and TFCI, did not have a direct equivalence as well, considering that marine fish communities have only a few exclusively piscivore species. Therefore, we considered both the macrocarnivore and piscivore species, keeping the initial meaning of these metrics: a measure of the top carnivores in the trophic network (Harrison and Whitfield, 2004; Coates et al., 2007).
2.3.2 Reference Limits
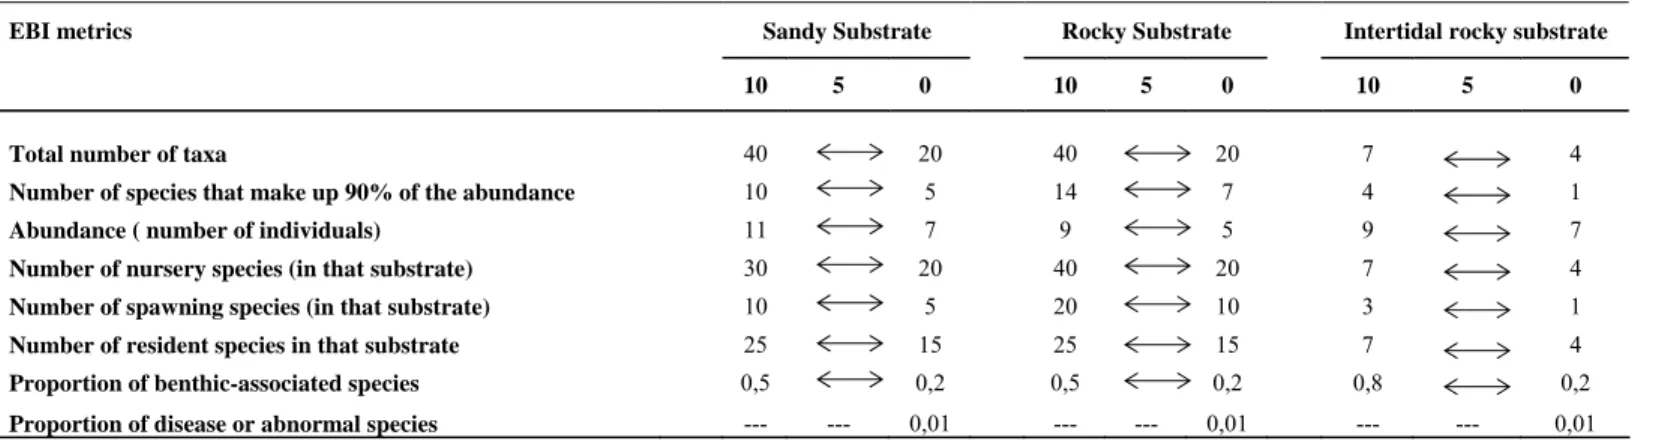
For each index a reference situation was calculated for each type of substrate (sandy, rocky and rocky intertidal) due to the differences between the typical communities of each substrate (Tables 4, 5 and 6).
evaluating ecological status of the marine environment
Table 4: Scoring system for the EBI metrics and respective reference values by type of substrate.
EBI metrics Sandy Substrate Rocky Substrate Intertidal rocky substrate
10 5 0 10 5 0 10 5 0
Total number of taxa 40 20 40 20 7 4
Number of species that make up 90% of the abundance 10 5 14 7 4 1
Abundance ( number of individuals) 11 7 9 5 9 7
Number of nursery species (in that substrate) 30 20 40 20 7 4
Number of spawning species (in that substrate) 10 5 20 10 3 1
Number of resident species in that substrate 25 15 25 15 7 4
Proportion of benthic-associated species 0,5 0,2 0,5 0,2 0,8 0,2 Proportion of disease or abnormal species --- --- 0,01 --- --- 0,01 --- --- 0,01
evaluating ecological status of the marine environment
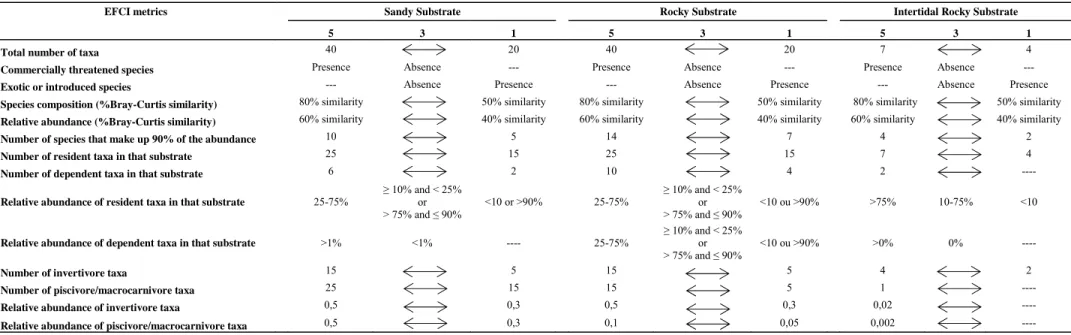
Table 5: Scoring system for the EFCI metrics and respective reference values by type of substrate.
EFCI metrics Sandy Substrate Rocky Substrate Intertidal Rocky Substrate
5 3 1 5 3 1 5 3 1
Total number of taxa 40 20 40 20 7 4
Commercially threatened species Presence Absence --- Presence Absence --- Presence Absence ---
Exotic or introduced species --- Absence Presence --- Absence Presence --- Absence Presence
Species composition (%Bray-Curtis similarity) 80% similarity 50% similarity 80% similarity 50% similarity 80% similarity 50% similarity
Relative abundance (%Bray-Curtis similarity) 60% similarity 40% similarity 60% similarity 40% similarity 60% similarity 40% similarity
Number of species that make up 90% of the abundance 10 5 14 7 4 2
Number of resident taxa in that substrate 25 15 25 15 7 4
Number of dependent taxa in that substrate 6 2 10 4 2 ----
Relative abundance of resident taxa in that substrate 25-75%
≥ 10% and < 25% or > 75% and ≤ 90% <10 or >90% 25-75% ≥ 10% and < 25% or > 75% and ≤ 90% <10 ou >90% >75% 10-75% <10
Relative abundance of dependent taxa in that substrate >1% <1% ---- 25-75%
≥ 10% and < 25% or > 75% and ≤ 90%
<10 ou >90% >0% 0% ----
Number of invertivore taxa 15 5 15 5 4 2
Number of piscivore/macrocarnivore taxa 25 15 15 5 1 ----
Relative abundance of invertivore taxa 0,5 0,3 0,5 0,3 0,02 ----
evaluating ecological status of the marine environment
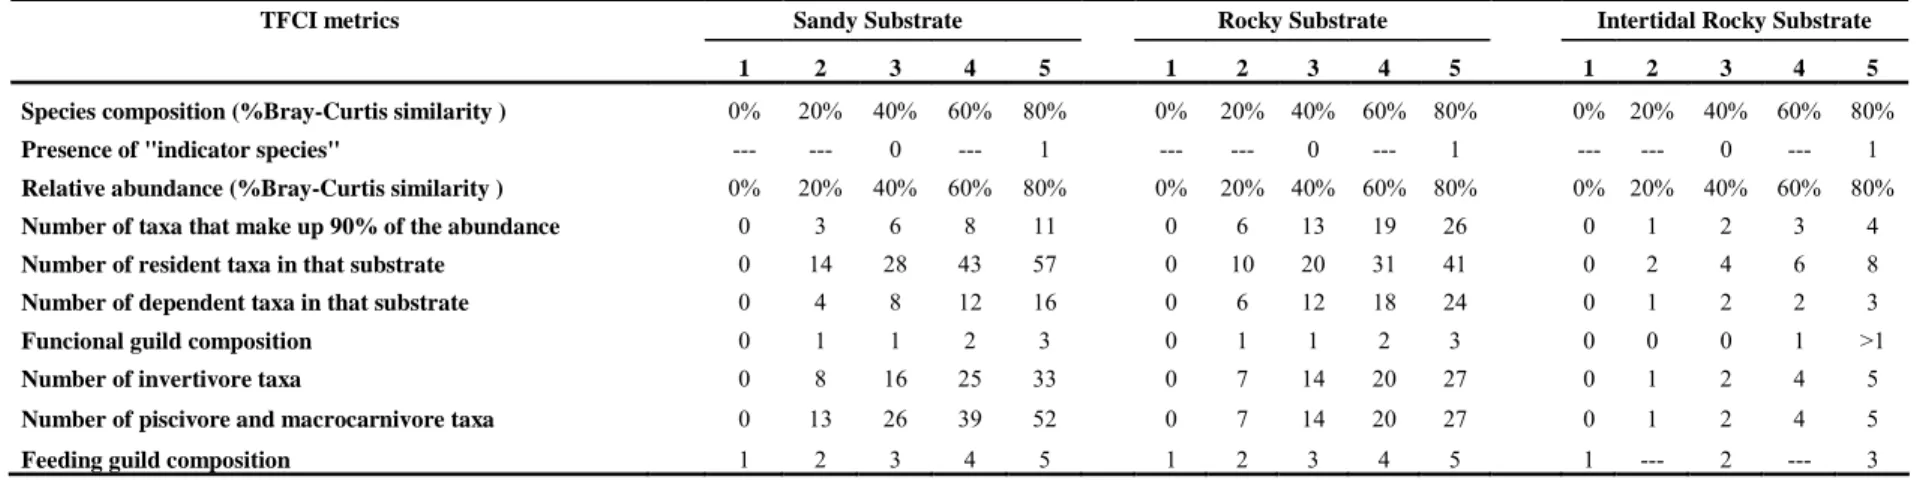
Table 6: Scoring system for the TFCI metrics and respective reference values by type of substrate.
TFCI metrics Sandy Substrate Rocky Substrate Intertidal Rocky Substrate 1 2 3 4 5 1 2 3 4 5 1 2 3 4 5 Species composition (%Bray-Curtis similarity ) 0% 20% 40% 60% 80% 0% 20% 40% 60% 80% 0% 20% 40% 60% 80%
Presence of "indicator species" --- --- 0 --- 1 --- --- 0 --- 1 --- --- 0 --- 1 Relative abundance (%Bray-Curtis similarity ) 0% 20% 40% 60% 80% 0% 20% 40% 60% 80% 0% 20% 40% 60% 80% Number of taxa that make up 90% of the abundance 0 3 6 8 11 0 6 13 19 26 0 1 2 3 4 Number of resident taxa in that substrate 0 14 28 43 57 0 10 20 31 41 0 2 4 6 8 Number of dependent taxa in that substrate 0 4 8 12 16 0 6 12 18 24 0 1 2 2 3 Funcional guild composition 0 1 1 2 3 0 1 1 2 3 0 0 0 1 >1 Number of invertivore taxa 0 8 16 25 33 0 7 14 20 27 0 1 2 4 5 Number of piscivore and macrocarnivore taxa 0 13 26 39 52 0 7 14 20 27 0 1 2 4 5
evaluating ecological status of the marine environment
Since no historical data exist for the evaluated sites, neither a great number of studies using the same sampling method and physico-chemical data available to know which are the unimpacted sites, the reference limits of each metric were calculated from the metric values of the 15 studies complemented with expert judgement, except for the metrics “relative abundance” of the EFCI and “species composition” of the EFCI and TFCI that employ the Bray-Curtis similarity index. The reference to calculate the similarity percentage of these metrics was defined based on a broader set of studies (69 including the 15 assessed studies), selected by substrate type and considering the sampling method used.
Independently of the aforementioned methods, only the potential occurrence of typical species of each substrate was considered, meaning that the rare, uncommon and occasional species were not taken into account, once that the capture probability of these species is very low. This way, if non-typical species are captured in the samples, it only increases the score value of each metric and therefore the final value of the index.
Although this methodology does not guarantee that the reference limits are real, the ecological results obtained with these reference limits can be compared, considering that the same principles were used in their calculation for all indices, that the sampling methods were representative of each substrate and that the goal of this study is to compare the efficiency of each index in the assessment of ecological status.
2.3.3 Score System and Ecological Scale
The metric score system of the EFCI and TFCI, according to the adapted reference limits, are similar to the ones initially proposed by the authors (Harrison and Whitfield, 2004; Coates et al., 2007) (Tables 5 and 6). In order to obtain the final ecological scale with the EFCI we only adapted the terminology of
evaluating ecological status of the marine environment
“Good” and “Very Good” correspond respectively to “Bad”, “Poor”, “Moderate”, “Good” and “Excellent”, keeping the value gaps of the EFCI (Table 2).
The final value of the TFCI is given as a “Relative Score” (RS) that varies between 0 and 1. The RS is calculated by dividing the total sum of scores of the 10 metrics by the highest possible score. However, the authors of this index did not give any ecological quality scale adapted to these RS values, thus, keeping the guidelines of adaptation formally used with the CDI and the BHI, we divided the maximum final RS value in quintiles, each one corresponding to the limits of the ecological statuses (Bad, Poor, Moderate, Good and Excellent) (Table 2).
Once the score system of the EBI was originally tested to separate only low-quality sites from medium-quality ones due to the absence of high-quality (reference) sites (Deegan et al., 1997), it had to be adapted to make the comparison between its results and the remaining indices possible. Based upon the principles of the original EBI, with a value of 0 for metrics with low quality and 5 for metrics with medium quality, a score of 10 was added for metrics with good quality (Table 4). The authors still defined that, if the final EBI value was less or equal to 25 out of a maximum of 40 (meaning that at least 3 out of the 8 metrics failed), the site was classified as “low quality” (Deegan et
al., 1997), thus, the ecological scale for the final value of the adapted EBI had to be altered. Following
the same principle of the remaining indices, the highest possible value of the adapted EBI (75) was divided in quintiles, each one corresponding to an ecological status (Bad, Poor, Moderate, Good and Excellent) (Table 2).
2.4 Evaluation of adapted indices
For each study the values of the various metrics were calculated based on the principles used by authors of the EBI, EFCI and TFCI (Deegan et al., 1997; Harrison and Whitfield, 2004; Coates et al., 2007),
evaluating ecological status of the marine environment
the “exotic or introduced species” of the EFCI, as there are no species in this category for Portuguese marine waters. In order to avoid the negative influence of these metrics on the final index value, we attributed an intermediate score for all zones assessed, so these metrics were excluded from the analysis.
According to the adapted reference values, a score was given to the remaining metrics and the CDI and BHI potentials (P and Pmax) were also calculated following the same method. The final values of each index were then estimated and the values obtained were compared with the respective ecological scale. The metrics responsible for the ecological status obtained were analysed using histograms representing the metric scores of each study, by index.
2.5 Statistical Analysis
The Kruskal-Wallis test was used to calculate the differences in the final scores of the various indices by substrate. These analyses were performed using Statistica 6.0 software package (StatSoft, 2003) and a 0.05 significance level was considered.
In order to compare the distribution of all the metric values by study and analyse their grouping independently of index organization and reference situation, a correspondence analysis (CA) was performed using Canoco for windows 4.5 software package (ter Braak and Šmilauer, 2002).
3.Results
The results obtained in the application of the adapted estuarine indices (Table 7) show clearly that these indices were not coherent, considering that discrepant ecological statuses were obtained for the same zones. Additionally, different patterns of ecological status were verified according to the type of substrate. Generally, lower ecological statuses were obtained on sandy substrate and the
evaluating ecological status of the marine environment
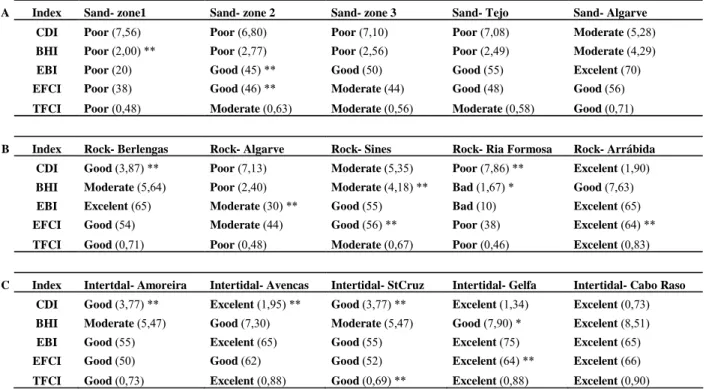
Table 7: Ecological status obtained with each index for all evaluated zones (A- sandy zones; B- rocky zones; C- intertidal rocky zones). Every final index value is in brackets. The ecological status indicated by * were close to the upper status and the ones that are indicated by ** were close to the lower ecological status.
Among the sandy substrate zones evaluated (Table 7a) the highest values were obtained for “Algarve 2005”, where none of the indices showed values below Moderate. The lowest ecological status corresponded to the deep sandy zones 1, 2 and 3 (20-100m). In this substrate the CDI and the BHI agreed, although these indices showed the lowest ecological statuses. Among the remaining indices, the most demanding one (with lower ecological statuses) was the TFCI, followed by the FCI and the EBI. The metrics responsible for lower ecological statuses for the TFCI (Figure 1) were the “relative abundance”, the “number of species that make up 90% of abundance” and the “number of invertivore taxa”, while for the EFCI (Figure 2) were the “species composition” and the “relative abundance”, and at last for the EBI (Figure 3) were the “number of resident taxa in that substrate”, the “number of nursery species (in that substrate)”, the “number of species that make up 90% of abundance” and the “proportion of benthic-associated species”. We also verified that for this
A Index Sand- zone1 Sand- zone 2 Sand- zone 3 Sand- Tejo Sand- Algarve CDI Poor (7,56) Poor (6,80) Poor (7,10) Poor (7,08) Moderate (5,28) BHI Poor (2,00) ** Poor (2,77) Poor (2,56) Poor (2,49) Moderate (4,29) EBI Poor (20) Good (45) ** Good (50) Good (55) Excelent (70)
EFCI Poor (38) Good (46) ** Moderate (44) Good (48) Good (56)
TFCI Poor (0,48) Moderate (0,63) Moderate (0,56) Moderate (0,58) Good (0,71)
B Index Rock- Berlengas Rock- Algarve Rock- Sines Rock- Ria Formosa Rock- Arrábida CDI Good (3,87) ** Poor (7,13) Moderate (5,35) Poor (7,86) ** Excelent (1,90) BHI Moderate (5,64) Poor (2,40) Moderate (4,18) ** Bad (1,67) * Good (7,63) EBI Excelent (65) Moderate (30) ** Good (55) Bad (10) Excelent (65)
EFCI Good (54) Moderate (44) Good (56) ** Poor (38) Excelent (64) **
TFCI Good (0,71) Poor (0,48) Moderate (0,67) Poor (0,46) Excelent (0,83)
C Index Intertdal- Amoreira Intertidal- Avencas Intertidal- StCruz Intertidal- Gelfa Intertidal- Cabo Raso CDI Good (3,77) ** Excelent (1,95) ** Good (3,77) ** Excelent (1,34) Excelent (0,73) BHI Moderate (5,47) Good (7,30) Moderate (5,47) Good (7,90) * Excelent (8,51)
EBI Good (55) Excelent (65) Good (55) Excelent (75) Excelent (65)
EFCI Good (50) Good (62) Good (52) Excelent (64) ** Excelent (66)
evaluating ecological status of the marine environment
resident taxa” and to the “functional guild composition” of the TFCI (Figure 1) and the metric “commercially threatened species” of the EFCI (Figure 2) did not contribute for the separation of ecological status, since they always retrieved the same score value.
Unlike the observed on sandy substrate, the BHI was more demanding than the CDI on the rocky substrate; in four out of five studies evaluated with the BHI, the ecological statuses obtained were one step lower than with the CDI (Table 7b). With the exception of “Ria Formosa” and similarly to the sandy zones, the most demanding index was the TFCI, followed by the EFCI and the EBI. The “Bad” ecological status obtained with the EBI for “Ria Formosa” is due to the fact that only two of the eight metrics had intermediate scores and the other ones scored low (Figure 3). For this substrate, the metrics responsible for the lowest ecological status obtained with the TFCI (Figure 1) were the “number of species that make up 90% of abundance”, the “number of resident taxa in that substrate” and the “number of piscivore and macrocarnivore taxa”, with the EFCI (Figure 2) were the “number of resident taxa in that substrate” and the “species composition”, finally with the EBI (Figure 3) were the metric “number of species that make up 90% of abundance”, the “number of nursery species (in that substrate)” and the “number of resident taxa in that substrate”. We also verified that the metrics “presence of indicator species” and “functional guild composition” of the TFCI and once again the metric “commercially threatened species” of the EFCI did not contribute to the separation of ecological status.
evaluating ecological status of the marine environment
Figure 1. Scores obtained with each metric of the TFCI on all evaluated zones. The TFCI score system varies between 1 and 5.
evaluating ecological status of the marine environment
Figure 2. Scores obtained with each metric of the EFCI on all evaluated zones. The possible scores for each metric are 1, 3 or 5.
evaluating ecological status of the marine environment
Figure 3. Scores obtained with each metric of the EBI on all evaluated zones. The possible scores for each metric are 0, 5 or 10.
evaluating ecological status of the marine environment
On the intertidal rocky substrate, the BHI was more demanding than the CDI (Table 7c). In general, except for the BHI and the “Avencas” zone with the EFCI, the ecological statuses obtained were all coherent between them. However, many of the evaluated metrics did not contribute for the separation of ecological status, namely the “presence of indicator species” of the TFCI, the “total number of taxa”, the “number of resident taxa in that substrate” and the “proportion of benthic-associated species” of the EBI and the “total number of taxa”, the “relative abundance”, the “number of resident taxa in that substrate” and the “relative abundance of resident taxa in that substrate” of the EFCI. The metrics that contributed for the lower ecological status were the “number of spawning species (in that substrate)” of the EBI and the “number of piscivore and macrocarnivore taxa” of the TFCI.
The results obtained with the Kruskal-Wallis test showed significant differences between the averaged final scores for the three substrates with the CDI (H= 7.594; p< 0.05), the BHI (H= 6.512; p<0.05) and the TFCI (H=6.776;p<0.05).
The bidimentional plot of the CA representing the evaluated zones according to their affinity in metric values is represented in figure 4. The cumulative percentage of variation explained by the two first axes was 71.5%. It is possible to identify three main groups corresponding to the intertidal zones (group 1), deep sandy zones (group 2) and shallow sandy and rocky subtidal zones (group 3).