Secondary structure of nrDNA Internal Transcribed Spacers as a useful tool
to align highly divergent species in phylogenetic studies
Giovanna C. Giudicelli
1, Geraldo Mäder
1, Gustavo A. Silva-Arias
1, Priscilla M. Zamberlan
1,
Sandro L. Bonatto
2and Loreta B. Freitas
11
Laboratory of Molecular Evolution, Department of Genetics, Universidade Federal do Rio Grande do Sul
(UFRGS), Porto Alegre, Brazil
2
Laboratory of Genomic and Molecular Biology, Pontifícia Universidade Católica do Rio Grande do Sul,
Porto Alegre, RS, Brazil
Abstract
Recently, it has been suggested that internal transcribed spacer (ITS) sequences are under selective constraints to preserve their secondary structure. Here, we investigate the patterns of the ITS nucleotide and secondary structure conservation across thePassiflora L. genus to evaluate the potential use of secondary structure data as a helpful tool for the alignment in taxonomically complex genera. Considering the frequent use of ITS, this study also presents a perspective on future analyses in other plant groups. The ITS1 and ITS2 sequences presented significant differ-ences for mean values of the lowest energy state (LES) and for number of hairpins in differentPassiflora subgenera. Statistical analyses for the subgenera separately support significant differences between the LES values and the to-tal number of secondary structures for ITS. In order to evaluate whether the LES values of ITS secondary structures were related to selective constraints, we compared these results among 120 ITS sequences fromPassiflora species and 120 randomly generated sequences. These analyses indicated thatPassiflora ITS sequences present charac-teristics of a region under selective constraint to maintain the secondary structure showing to be a promising tool to improve the alignments and identify sites with non-neutral substitutions or those correlated evolutionary steps.
Keywords:Passiflora; lowest energy state; hairpins; ITS1; ITS2. Received: February 24, 2016; Accepted: August 23, 2016.
Introduction
Ribosomal DNA (rDNA) consists of one of the larg-est multigenic families in eukaryotic genomes and is pres-ent at one or several locations in arrays of tandem elempres-ents (Hillis and Dixon, 1991). Each unit is composed of three rRNA gene regions (18S, 5.8S, and 26S) that are preceded by an external transcribed spacer, and the two internal tran-scribed spacers ITS1 and ITS2 separate the genes respec-tively (Buckler-IVet al., 1997). The rDNA exons are high-ly conserved across eukaryotic organisms, whereas the ITS regions present length variability due to point mutations and insertions/deletions (indels) (Baldwin et al., 1995; Álvarez and Wendel, 2003). Gene regions are further pro-cessed to produce the mature RNAs to form the cytoplas-mic ribosomes, whereas ITS regions suffer a specific cleav-age during the maturation of the ribosomal subunits and are thus not incorporated into mature ribosomes (Hillis and Dixon, 1991; Baldwinet al., 1995). ITS regions play an
im-portant role in rRNA processing. Deletion of the central portion of ITS1, including a processing region that is used in the early stages of ribosomal maturation, blocks the for-mation of 40S subunits (Musters et al., 1990), whereas
small deletions in the 5’-terminal region of ITS2 prevent the maturation of 26S rRNA, and deletions in the 3’-terminal portion severely reduce the efficiency of this process (van der Sandeet al., 1992). The maturation and splicing processes depend on the secondary structure of ITS regions and thus imply some degree of conservation at the sequence or structural level (Mai and Coleman, 1997).
ITS sequences have been widely used in the inference of phylogenetic hypotheses or in molecular evolution stud-ies in plants (Álvarez and Wendel, 2003), including several taxonomic levels (Kresset al., 2002; Zimmeret al., 2002;
Kochet al., 2003; Rauscheret al., 2004; Bellarosaet al.,
2005; Kanet al., 2007; Queirozet al., 2011; Ghadaet al.,
2013; Fanet al., 2014). In thePassifloragenus, ITS regions
are the most commonly used marker for estimating the phylogenetic relationships among subgenera and species (Muschneret al., 2003; Krosnick and Freudenstein, 2005;
Lorenz-Lemkeet al., 2005; Koehler-Santos et al., 2006;
DOI: http://dx.doi.org/10.1590/1678-4685-GMB-2016-0042
Send corresponding to Loreta B. Freitas. Laboratory of Molecular Evolution, Department of Genetics, Universidade Federal do Rio Grande do Sul, P.O. Box 15053, 91501-970, Porto Alegre, RS, Brazil. E-mail: [email protected]
Mäderet al., 2010; Cazéet al., 2013; Krosnicket al., 2013;
Ramaiyaet al., 2014), although this is usually combined
with other sequences in these studies.
The Passiflora genus is the largest member of the
Passifloraceae family, with more than 520 species widely distributed in the Neotropical region and a few species oc-curring in the Old World (Deginani, 2001; Ulmer and MacDougal, 2004). This genus was initially divided into 22 or 23 subgenera based on floral morphology (Killip, 1938; Escobar, 1989), but the current infrageneric classification (Feuillet and MacDougal, 2003) regrouped the species into four subgenera that have been partially or fully corrobo-rated in phylogenetic studies (Muschneret al., 2003, 2012;
Yockteng and Nadot 2004a; Hansenet al., 2006, 2007): Astrophea (DC.) Mast., Decaloba (DC.) Rchb., Deidamioides(Harms) Killip, andPassiflora. The species
of thePassifloragenus present a large diversity of floral
and vegetative features, which contributes to the complex taxonomy of this group (Krosnick and Freudenstein, 2005). The first study to obtain a molecular phylogeny for
Passiflora(Muschneret al., 2003) described a high
diver-gence among ITS sequences of the different subgenera; consequently, alignment of these sequences presents sev-eral ambiguous regions and indels. For that reason, authors suggested a separate alignment per subgenus. Several plas-tid regions (Muschner et al., 2003; Krosnick and
Freudenstein, 2005; Hansenet al., 2006) and other nuclear
markers (Yockteng and Nadot, 2004a,b; Muschneret al.,
2012) have also been used inPassiflorastudies; however,
they do not present sufficient variability to distinguish spe-cies as efficiently as observed in ITS. Despite this, the low variability in plastid and other nuclear regions is advanta-geous in relation to ITS because allows the alignment of all subgenera simultaneously (Muschneret al., 2003; Mäderet al., 2010).
Mutations in the tandem repeats of rDNA are com-monly homogenized through concerted evolution (Arnheimet al., 1980; Baldwinet al., 1995). This
phenom-enon makes each copy of an rRNA array very similar to other copies within individuals and species, thus providing a high degree of similarity in gene family and affecting the region variability (Hillis and Dixon, 1991; Buckler-IVet al., 1997). However, the high level of ITS polymorphism
present inPassifloraspecies indicates that the process of
concerted evolution is not sufficiently fast to homogenize the region (Lorenz-Lemkeet al., 2005; Koehler-Santoset al., 2006), as observed in other plant groups (Wissemann
and Ritz, 2005; Harpke and Peterson, 2006). Melo and
Guerra (2003) suggested that the high variability of ITS present inPassifloracould be related to the chromosomal
location of rDNA in this genus, as has been suggested for
GossypiumL. (Wendelet al., 1995), because the 45S sites
where the ITS region is located were mapped in subtermi-nal position, which interferes with copy homogenization (Li and Zhang, 2002).
The presence of a high number of polymorphisms in sequences makes it more difficult to obtain good align-ments, and this could affect phylogenetic inference (Álvarez and Wendel, 2003). For that reason, the aim of this study was to investigate the patterns of ITS nucleotide and secondary structure conservation across thePassiflora
ge-nus to evaluate the potential use of secondary structure data as a helpful tool to improve the alignments in a genus that presents high taxonomic complexity. We also evaluated for the first time whether the ITS sequences are under selective constraints, considering their secondary structure in
Passifloraspecies. Considering the frequent use of ITS
se-quences, this study also presents a perspective for future analyses of secondary structure and estimates of phylo-genies in other plant groups. Moreover, this original contri-bution improves the database of ITS secondary structure that is essential for a trustworthy reference to phylogenetic and DNA barcoding analyses (Ankenbrandet al., 2015).
Material and Methods
Taxon sampling
GenBank sampling included 870 accessions of ITS1 and ITS2 from 163 species representatives of all four sub-genera: Astrophea (9 spp.), Decaloba (112 spp.),
Deidamioides(6 spp.), andPassiflora(36 spp.). We also included 74 new sequences (GenBank accessions numbers: KP769869- KP769905; KP769917- KP769953) from 26 species (Astrophea5 spp.,Decaloba1 spp., andPassiflora
20 spp.), totaling 944 sequences from 189Passiflora spe-cies. All these sequences were used to assess diversity in
Passiflora. Subgenera were represented by different num-ber of sequences according the numnum-ber of species included on each one. Sequences that presented a large number of missing data in initial or final portions of ITS1 or ITS2 were not included in our analyses.
Plant material, DNA extraction, PCR amplification and sequencing
To obtain the new sequences, the total DNA was ex-tracted from young leaves dried in silica gel using the method of Royet al.(1992). Voucher specimens were
de-posited at ICN Herbarium (Department of Botany, Federal University of Rio Grande do Sul, Porto Alegre, Brazil). ITS1 and ITS2 regions were amplified using primers 92 and 75 (Whiteet al., 1990) and amplification conditions as
previously described (Desfeux and Lejeune, 1996). To ex-clude the presence of low stability templates, we used 10% dimethyl sulfoxide (DMSO) (Buckler-IV et al., 1997;
Fuertes-Aguilaret al., 1999). We checked the quality and
1000 DNA Analysis System (GE Healthcare Biosciences, Pittsburgh, PA, USA).
Data analyses
We removed the 5.8S gene region from ITS se-quences because of its well-conserved nature, and ITS1 and ITS2 were analyzed individually. We discarded identical sequences obtained from a same species, such that each se-quence type was considered only once, using DnaSP 5 (Librado and Rojas, 2009). BecausePassiflorasubgenera
present high genetic variability among them, we conducted the analysis considering each subgenus separately. Conse-quently, for each subgenus, sequences of ITS1 or ITS2 were automatically aligned using default parameters in ClustalX (Thompsonet al., 1997), visually reviewed, and
manually adjusted using MEGA6 (Tamuraet al., 2013).
We deleted ambiguous sites from ITS sequences (Mäderet al., 2010), and gaps were coded as binary characters
(Simmons and Ochoterena 2000) using GapCoder (Young and Healy, 2003).
We selected 120 sequences from 60 species (Astrophea6 ssp.,Decaloba39 ssp.,Deidamioides6 ssp.,
andPassiflora9 ssp.) to model secondary structures of both
ITS1 and ITS2 regions. For this selection, we first con-structed phylogenetic trees in BEAST 1.8 (Drummondet al., 2012) using the HKY substitution model with four
gamma categories, a Yule tree prior, and 107chain lengths. The first 1000 trees were discarded as Òburn inÓ. We used the JModelTest software (Guindon and Gascuel, 2003; Darribaet al., 2012) to select the best evolution model for
our BEAST analysis, but because the resulting models were not available in the BEAST software, we selected the HKY substitution model as the closest to our results, based on
Passifloraphylogenies previously obtained (Muschner et al., 2003; Lorenz-Lemke et al., 2005; Koehler-Santos et al., 2006; Mäderet al., 2010; Cazéet al., 2013).
Phylogen-etic trees obtained using BEAST are available in Supple-mentary Material (Figures S1-S8). We selected the species to obtain the ITS1 and ITS2 secondary structures consider-ing only species from well-supported clades (posterior probability 3 0.7). We included a greater number of
Decaloba species to test differences between secondary
structures of species from different supersections that are phylogenetically well supported (Krosnicket al., 2013).
For this analysis, we randomly chose three species from each supersection, except forMultiflora: all sequences
a-vailable for this supersection were analyzed because it is the only paraphyletic supersection inDecaloba subgenus
studies (Krosnicket al., 2013).
We calculate mean guanine-cytosine (GC) content for eachPassiflora subgenus and ITS segment (ITS1 or
ITS2) separately. Considering these values and the size variation (bp) of the original ITS sequences, we generated 120 random sequences to evaluate whether the total num-ber of secondary structures and lowest energy state (LES)
values of ITS1 and ITS2 sequences were related to selec-tive constraints. These sequences were obtained using a Random DNA Sequence Generator (www.faculty.ucr.edu/ ~mmaduro/random.htm) and presented the same length range (176 bp to 280 bp) of the original sequences. There-fore, for eachPassifloraITS1 or ITS2 sequence, we
ob-tained a random sequence that presented the same size (bp) and a similar GC content. All secondary structures for those random sequences were also modeled, and the obtained in-formation is available in Supplementary Material Table S2.
Secondary structure prediction
We modeled ITS1 and ITS2 putative secondary struc-tures for the 120 sequences of 60Passifloraspecies and 120 random sequences using RNAstructure 5.3 (Reuster and Mathew, 2010). Output parameters of this software in-cluded the LES and total number of structures for each ana-lyzed sequence. We manually anaana-lyzed the number of hairpins and paired nucleotides of ITS sequences as per-formed by Edgeret al.(2014). Our analysis included for each Passiflora subgenus and random sequences: list of species, GenBank accession numbers, lengths, LES, total number of structures, number of hairpins, and number and percentage of paired nucleotides (Supplementary Material Tables S1 and S2).
We use the Wilcoxon-Mann-Whitney test in R soft-ware package (R Development Core Team, 2011) to assess whether there are significant differences between second-ary structure parameters (i.e., LES, total number of struc-tures, and number of hairpins) obtained for ITS1, ITS2, and random sequences. We performed an analysis comparing all ITS1 and ITS2 sequences to the 120 random sequences generated and another two analyses considering only ITS1 or ITS2 sequences and their 60 random sequences sepa-rately. We assessed differences for the same secondary structure parameters among the fourPassiflorasubgenera
using a Kruskal-Wallis test (Kruskal and Wallis, 1952).
Results and Discussion
ITS1 and ITS2 sequences characteristics and secondary structure
Alignments for all subgenera presented indels with different extensions among species, as previously observed in otherPassiflorastudies (Muschneret al., 2003; Mäderet al., 2010). Characteristics of ITS1 and ITS2 regions
evalu-ated per subgenera are summarized in Table 1. ITS1 se-quences always presented higher length than the ITS2 sequences within each subgenus. Decaloba showed the
longest length for ITS1 (336 base pairs - bp), as did
Passiflorafor ITS2 (239 bp).Decalobaexhibited the
high-est percentages of variable and informative sites for both ITS1 and ITS2 sequences, whereasDeidamioidesshowed
Considering ITS1 and ITS2 sequences of all subgen-era, the ITS1 region size range was between 220 and 280 bp, whereas ITS2 ranged between 176 and 222 bp. We evaluated each ITS1 and ITS2 sequence based on different parameters: sequence length, LES, total number of struc-tures, number of hairpins, and number and percentage of paired nucleotides (Table 2; Supplementary Material Table S1). ITS1 sequences presented higher average length (mean 263 bp, Standard Deviation SD = 19 bp) than ITS2 sequences (mean 206 bp, SD 7 bp), considering the four subgenera. Additionally, ITS1 sequences displayed signifi-cant differences and lower mean values of LES than ITS2 sequences (-105.6 and -80.5 degrees, respectively;
P< 0.001; Table 2). This result means that although they are of shorter sequence length, ITS2 sequences require more energy than ITS1 to form the secondary structures.
ITS1 sequences exhibited higher values of variable and informative characters, whereas the ITS2 region
showed higher numbers of conserved sites, as previously observed for a differentPassifloraspecies set (Giudicelliet al., 2015). High conservative patterns in ITS2 sequences have been previously reported and related to structural con-straints that are present at very deep phylogenetic scales in eukaryotes (Mai and Coleman 1997; Shultzet al., 2005). Although highly conserved motifs have also been reported for ITS1 sequences in plants, such motifs seem to be shorter than those observed in ITS2, and inPassifloraITS1 region, remaining parts of the sequence are more variable these motifs (Liu and Schardl 1994).
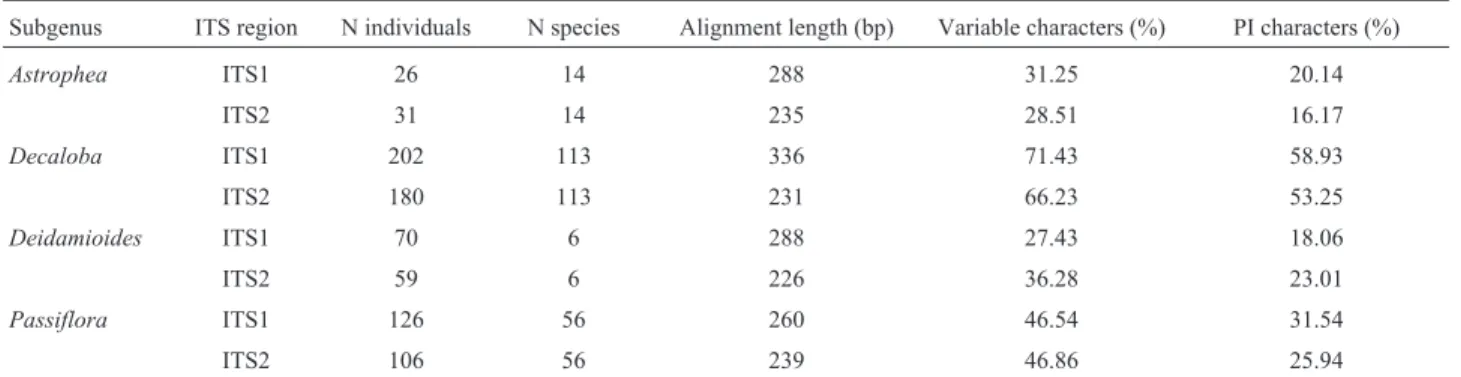
No statistically significant differences were observed between ITS1 and ITS2 in the total number of possible sec-ondary structures. ITS1 and ITS2 sequences exhibited sta-tistically significant differences in the numbers of hairpins (P< 0.001; Table 2; Figure 1). The most frequent number
of hairpins for ITS1 was seven (min = 2, max = 8), whereas the most frequent number of hairpins in ITS2 was three Table 1- Characteristics of ITS1 and ITS2 dataset presented perPassiflorasubgenera.
Subgenus ITS region N individuals N species Alignment length (bp) Variable characters (%) PI characters (%)
Astrophea ITS1 26 14 288 31.25 20.14
ITS2 31 14 235 28.51 16.17
Decaloba ITS1 202 113 336 71.43 58.93
ITS2 180 113 231 66.23 53.25
Deidamioides ITS1 70 6 288 27.43 18.06
ITS2 59 6 226 36.28 23.01
Passiflora ITS1 126 56 260 46.54 31.54
ITS2 106 56 239 46.86 25.94
ITS, internal transcribed spacer; BP, base pairs; PI, parsimony informative
Table 2- Mean parameters values analyzed for ITS1 and ITS2 sequences perPassiflorasubgenera. Standard deviations for each value are shown in
pa-rentheses.
ITS 1
Astrophea[6]* Decaloba[39]* Deidamioides[6]* Passiflora[9]* All sequences [60]*
Length (bp) 270.2 (2.3) 271.8 (8.8) 251.2 (19.7) 225.8 (2.5) 262.7 (19.1) Lowest Energy State (LES) -121.8 (5.5) -104.2 (9.4) -104.4 (4.9) -101.8 (6.1) -105.6 (9.8) Total number of Structures 15.8 (3.9) 12.6 (4.1) 16 (4.5) 8.8 (3.8) 12.7 (4.5) No. Hairpins 5.8 (1.6) 5.6 (1.4) 5.2 (2.1) 4.0 (0.9) 5.3 (1.5) No. Paired Nucleotides 168.3 (2.7) 167.7 (10.8) 149.3 (12.6) 135.3 (7.3) 161.1 (15.7) % Paired Nucleotides 62.3 (0.8) 61.7 (2.8) 59.4 (0.5) 59.9 (3.1) 61.3 (2.7)
ITS 2
Length (bp) 208.8 (7.3) 208.1 (3.2) 204.5 (5) 195.3 (10.9) 205.9 (7.1) Lowest Energy State (LES) -90.3 (1.5) -74.9 (6.2) -87.9 (7.9) -92.9 (6.1) -80.4 (9.7) Total number of Structures 14.2 (2.2) 11.2 (4) 13.8 (3.6) 17.3 (3.8) 12.7 (4.3) No. Hairpins 2.8 (1.3) 3.3 (0.6) 2.3 (0.8) 2.8 (1) 3.0 (0.8) No. Paired Nucleotides 128.7 (4.5) 123.4 (6.1) 128.7 (4.1) 130.7 (10.5) 125.5 (7.1) % Paired Nucleotides 61.6 (1) 59.3 (3) 62.9 (2.6) 66.8 (2.6) 61.0 (3.8)
(min = 2, max = 5). No differences were observed in the percentage of paired nucleotides for ITS1 and ITS2 se-quences (Table 2). Sese-quences had over 50% of their bases paired with other nucleotides to form secondary structures (Table 2), as observed for Brassicaceae (Edgeret al., 2014).
Because ITS1 sequences displayed longer lengths than ITS2 and because the sequences exhibited significant dif-ferences according to the number of paired nucleotides, ITS1 presented a higher number of paired nucleotides (P< 0.001; Table 2).
Statistical analyses conducted for the four subgenera separately support significant differences between LES values for ITS1 (P< 0.01) and ITS2 (P< 0.001) sequences.
These differences are not surprising when taking into ac-count the large observed differences of the sequences a-mong the four Passiflora subgenera. The highest mean
value of LES for ITS1 was observed inPassiflorasubgenus
(-101.8 degrees), and for ITS2 inDecaloba(-74.9 degrees;
Table 2). There were also statistically significant differ-ences in the total number of possible secondary structures among subgenera for ITS1 (P< 0.01) and ITS2 (P< 0.01). For ITS1,Deidamioides showed a higher mean value of
possible alternate secondary structures (16 possible struc-tures, Table 2), while for ITS2 this was the case for
Passiflora(17 possible structures; Table 2). No statistically significant differences were observed within Decaloba
when the species were separated according to the super-sections previously proposed (Feuillet and MacDougal, 2003; Ulmer and MacDougal, 2004). We also observed that different sequences types of a species did not exhibit differ-ences on their secondary structure (data not shown). Figure 1- Frequency and examples of number of hairpins for ITS1 and ITS2 sequences. (a) Frequency of the total number of hairpins for ITS1 (gray) and
Comparison of secondary structures of ITS1, ITS2, and random sequences to assess selective
constraints of ITS regions
Randomly generated sequences presented -80.2 de-grees for LES (min = -126.7, max = -53.9) on average and a mean of 17.2 possible secondary structures (min = 3, max = 20). In all three analyses comparing ITS and ran-domly-generated sequences (Figure 2), we found different values: to combined ITS sequences, LESP < 0.001 and number of possible secondary structuresP< 0.001; ITS1 only, LESP < 0.001 and number of possible secondary structuresP< 0.001; and ITS2 only, LESP< 0.001 and number of possible secondary structuresP< 0.001. Those analyses indicated that Passiflora sequences secondary structures exhibit significantly lower energy states and less structures compared with randomly generated sequences that are similar in length and GC content. These results sug-gest thatPassifloraITS sequences show characteristics of a region that is under selective constraint to maintain its sec-ondary structure.
Different secondary structure predictor softwares may propose very distinct structures from the same se-quence, even when using the same initial parameters (Gottschling and Pltner, 2004). Additionally, thermody-namically optimal structures certainly do not reflect the structures in cells, because there are many unaccounted biochemical factors that give a dynamic (temporarily un-stable) characteristic to the secondary structure of the rRNA transcripts. However, in addition to the strong differ-ences seen among thePassiflorasequences, there are
high-ly conserved structural patterns and sequence motifs for the entire genus, which support the suggestion of selective con-straints for maintaining the secondary structures.
Utility of ITS secondary structures to improve alignments
Analyses conducted for the fourPassiflorasubgenera
separately revealed no statistically significant differences in the total number of hairpins among subgenera. However, although no pattern was observed to characterize each sub-genus, secondary structures were shown to be a potential tool for improving the quality of alignments and identifying possible sites with non-neutral substitution patterns or sites with correlated evolution. This allows to obtain better re-sults in phylogenetic inferences for Passiflora, as
previ-ously observed for other plant groups (Gottschlinget al.,
2001; Goertzenet al., 2003).
The highly conserved motif in the central region of the ITS1 sequence previously described for flowering plants (Liu and Schardl, 1994) was also present in the
Passiflora sequences and was helpful in aligning the Passiflorasequences for phylogenetic analysis. Other ITS1
conserved motifs described in other groups were also found inPassiflora, such as 5’AAGGAA 3’ in the central region
of ITS1 (Liu and Schardl, 1994; Gottschlinget al., 2001)
and a region rich in adenine and cytosine (Colemanet al.,
1998). Conserved patterns that had already been described in angiosperms (Hershkovitz and Zimmer 1996; Mai and Coleman, 1997) and green algae (Mai and Coleman, 1997) were also observed inPassiflora ITS2 sequences. These
Figure 2- ITS sequences compared with random sequences. Scatter plot of t lowest energy state values (X-axis) and total number of secondary structures
conserved motifs are commonly associated with the forma-tion of hairpins in secondary structure.
Comparisons among species from different subgen-era that presented the same number of hairpins showed con-served patterns on secondary structure that could be useful for improving thePassiflorasequence alignments. For
ex-ample, when comparing the ITS1 region among species from theAstrophea,Decaloba,andDeidamioides
subgen-era with seven hairpins, we observed a common hairpin with 5-6 paired bases formed by initial (5’-TCGAA) and fi-nal (TTCGA-3’) portions. This same motif was also found in ITS1 sequences that presented different numbers of hair-pins, thus demonstrating the conserved nature of ITS1 se-quences and serving as a reason why a universal set of primers could be used to amplify sequences of plants and fungi (Whiteet al., 1990; Álvarez and Wendel, 2003). The
analysis of secondary structure also facilitates the identifi-cation of indels when sequences with different number of hairpins are compared, thus contributing to the improve-ment of the alignimprove-ment of sequences with different lengths and high diversity index.
The conservation of specific nucleotides in secondary structures contributes to positional homology and is a help-ful tool to improve the alignments (Keller et al., 2010). Therefore, we believe that analyses of ITS secondary struc-tures obtained from thePassifloraspecies could be a valu-able source of information to improve alignment, considering the difficulties of aligning species from the dif-ferent subgenera (Muschner et al., 2003; Mäder et al., 2010), and the same strategy could be used in other plant genera that present a complex taxonomy.
ManyPassiflorastudies have used ITS sequences to
estimate phylogenetic relationships, and our results show that ITS regions are under selective constraints to maintain their secondary structures, likely due to their specific func-tions in the splicing process, as was observed for Brassicaceae (Edgeret al., 2014). The use of ITS as a
mo-lecular marker carries some risk and must be done cau-tiously, but it presents the advantage of having a great deal of sequence data for this locus (Krosnick et al., 2013).
Plastid markers are not sufficiently variable in the
Passiflora genus (Muschner et al., 2003; Mäder et al.,
2010; Cazé et al., 2013), and ITS secondary structures
could thus be a helpful tool to improve phylogenetic infer-ences and evolutionary studies in this genus and others.
Acknowledgments
This work was supported by the Conselho Nacional de Desenvolvimento Científico e Tecnológico (CNPq), the Coordenação de Aperfeiçoamento de Pessoal de Nível Su-perior (CAPES), and the Programa de Pós-Graduação em Genética e Biologia Molecular da Universidade Federal do Rio Grande do Sul (PPGBM-UFRGS).
References
Ankenbrand MJ, Keller A, Wolf M, Schultz J and Frster F (2015) ITS2 database V: Twice as much. Mol Biol Evol 32:3030-3032.
Álvarez I and Wendel JF (2003) Ribosomal ITS sequences and plant phylogenetic inference. Mol Phylogenet Evol 29:417-434.
Arnheim N, Krystal M, Schmickel R, Wilson G, Ryder O and Zimmer E (1980) Molecular evidence for genetic exchanges among ribosomal genes on non-homologous chromosomes in man and apes. Proc Natl Acad Sci USA 77:7323-7327. Baldwin BG, Sanderson MJ, Porter JM, Wojciechowski MF,
Campbell CS and Donoghue MJ (1995) The ITS region of nuclear ribosomal DNA: A valuable source of evidence on angiosperm phylogeny. Ann Mo Bot Gard 82:247-277. Bellarosa R, Simeonea MC, Papinib A and Schironea B (2005)
Utility of ITS sequence data for phylogenetic reconstruction of ItalianQuercusspp. Mol Phylogenet Evol 34:355-370.
Buckler-IV ES, Ippolito A and Holtsford TP (1997) The evolution of ribosomal DNA: Divergent paralogues and phylogenetic implications. Genetics 145:821-832.
Cazé ALR, Mäder G, Bonatto SL and Freitas LB (2013) A molec-ular systematic analysis ofPassiflora ovalisandPassiflora contracta(Passifloraceae). Phytotaxa 132:39-46.
Coleman AW, Maria Preparata R, Mehrota B and Mai JC (1998) Derivation of the secondary structure of the ITS-1 transcript in Volvocales and its taxonomic correlations. Protist 149:135-146.
Darriba D, Taboada GL, Doallo R and Posada D (2012) jModelTest 2: More models, new heuristics and parallel computing. Nat Methods 9:772.
Deginani NB (2001) Las especies argentinas del género Passiflora (Passifloraceae). Darwiniana 39:43-129.
Desfeux C and Lejeune B (1996) Systematics of Euromediter-ranean Silene (Caryophyllaceae): Evidence from a phylo-genetic analysis using ITS sequence. C R Acad Sci III 319:351-358.
Drummond AJ, Suchard MA, Xie D and Rambaut A (2012) Bayesian phylogenetics with 346 BEAUti and the BEAST 1.7. Mol Biol Evol 29:1969-1973.
Dunn IS and Blattner FR (1987) Charons 36 to 40: Multi-enzyme, high capacity, recombination deficient replacement vectors with polylinkers and polystuffers. Nucleic Acids Res 15:2677-2698.
Edger PP, Tang M, Bird KA, Mayfield DR, Conant G, Mummenhoff K, Koch MA and Pires JC (2014) Secondary structure analyses of the nuclear rRNA internal transcribed spacers and assessment of its phylogenetic utility across the Brassicaceae (Mustards). PLoS ONE 9:e101341.
Escobar LK (1989) A new subgenus and five new species in
Passiflora(Passifloraceae) from South America. Ann Mo Bot Gard 76:877-885.
Fan X, Liu J, Sha LN, Sun GL, Hu ZQ, Zeng J, Kang HY, Zhang HQ, Wang Y, Wang XL,et al.(2014) Evolutionary pattern
of rDNA following polyploidy in Leymus (Triticeae: Poaceae). Mol Phylogenet Evol 77:296-306.
Feuillet C and MacDougal JM (2003) A new infrageneric classifi-cation ofPassifloraL. (Passifloraceae). Passiflora 13:34-38.
natu-ral and artificial hybrids ofArmeria(Plumbaginaceae). Mol
Ecol 8:1341-1346.
Ghada B, Ahmed BA, Messaoud M and Amel SH (2013) Genetic diversity and molecular evolution of the internal transcribed spacer (ITSs) of nuclear ribosomal DNA in the Tunisian fig cultivars (Ficus caricaL.; Moracea). Biochem Syst Ecol
48:20-33.
Giudicelli GC, Mäder G and Freitas LB (2015) Efficiency of ITS sequences for DNA barcoding in Passiflora
(Passifloraceae). Int J Mol Sci 16:7289-7303.
Goertzen LR, Cannone JJ, Gutell RR and Jansen RK (2003) ITS secondary structure derived from comparative analysis: Im-plications for sequence alignment and phylogeny of the Asteraceae. Mol Phylogenet Evol 29:216-234.
Gottschling M and Pltner J (2004) Secondary structure models of the nuclear internal transcribed spacer regions and 5.8S rRNA in Calciodinelloideae (Peridiniaceae) and other dino-flagellates. Nucleic Acids Res 32:307-315.
Gottschling M, Hilger HH, Wolf M and Diane N (2001) Second-ary structure of the ITS1 and its application in a reconstruc-tion of the phylogeny of Boraginales. Plant Biol 3:629-636. Guindon S and Gascuel O (2003) A simple, fast and accurate
method to estimate large phylogenies by maximum-likelihood. Syst Biol 52:696-704.
Hansen AK, Gilbert LE, Simpson BB, Downie SR, Cervi AC and Jansen RK (2006) Phylogenetic relationships and chromo-some number evolution inPassiflora. Syst Bot 31:138-150. Hansen AK, Escobar LK, Gilbert LE and Jansen RK (2007)
Pater-nal, materPater-nal, and biparental inheritance of the chloroplast genome in Passiflora (Passifloraceae): Implications for phylogenetic studies. Am J Bot 94:42-46.
Harpke D and Peterson A (2006) Non-concerted ITS evolution in
Mammillaria (Cactaceae). Mol Phylogenet Evol
41:579-593.
Hershkovitz MA and Zimmer EA (1996) Conservation patterns in angiosperm rDNA ITS2 sequences. Nucleic Acids Res 24:2857-2867.
Hillis DM and Dixon MT (1991) Ribosomal DNA: Molecular evolution and phylogenetic inference. Q Rev Biol 66:411-453.
Kan XZ, Wang SS, Ding X and Wang XQ (2007) Structural evo-lution of nrDNA ITS in Pinaceae and its phylogenetic impli-cations. Mol Phylogenet Evol 44:765-777.
Keller A, Frster F, Müller T, Dandekar T, Schultz J and Wolf M (2010) Including RNA secondary structures improves accu-racy and robustness in reconstruction of phylogenetic trees. Biol Direct 5:4.
Killip EP (1938) The American Species of Passifloraceae. Botani-cal Series, Field Museum of Natural History, Chicago, 613 p.
Koch MA, Dopes C and Mitchell-Olds T (2003) Multiple hybrid formation in natural populations: Concerted evolution of the Internal Transcribed Spacer of nuclear ribosomal DNA (ITS) in North AmericanArabis divaricarpa(Brassicaceae). Mol Biol Evol 20:338-350.
Koehler-Santos P, Lorenz-Lemke A, Muschner VC, Bonatto SL, Salzano FM and Freitas LB (2006) Molecular genetic varia-tion inPassiflora alata(Passifloraceae), an invasive species
in southern Brazil. Biol J Linn Soc Lond 88:611-630.
Kress WJ, Prince LM and Williams KJ (2002) The phylogeny and a new classification of the gingers (Zingiberaceae): Evi-dence from molecular data. Am J Bot 89:1682-1696. Krosnick SE and Freudenstein JV (2005) Monophyly and floral
character homology of Old World Passiflora(Subgenus
Decaloba: SupersectionDisemma). Syst Bot 30:139-152.
Krosnick SE, Porter-Utley KE, MacDougal JM, Jørgensen PM and McDade LA (2013) New insights into the evolution of
PassiflorasubgenusDecaloba(Passifloraceae):
Phylogen-etic relationships and morphological synapomorphies. Syst Bot 38:692-713.
Kruskal WH and Wallis WA (1952) Use of ranks in one-criterion variance analysis. J Am Stat Assoc 47:583-621.
Li D and Zhang X (2002) Physical localization of the 18S-5.8S-26S rDNA and sequence analysis of ITS regions in
Thinopyrum ponticum(Poaceae, Triticaceae): Implications for concerted evolution. Ann Bot 90:445-452.
Librado P and Rojas J (2009) DnaSP v5: A software for compre-hensive analysis of DNA polymorphism data. Bio-informatics 25:1451-1452.
Liu JS and Schardl CL (1994) A conserved sequence in internal transcribed spacer 1 of plant nuclear rRNA genes. Plant Mol Biol 26:775-778.
Lorenz-Lemke AP, Muschner VC, Bonatto SL, Cervi AC, Salzano FM and Freitas LB (2005) Phylogeographic infer-ences concerning evolution of BrazilianPassiflora actinia
andP. elegans(Passifloraceae) based on ITS (nr DNA)
vari-ation. Ann Bot 95:799-806.
Mäder G, Zamberlan PM, Fagundes NJR, Magnus T, Salzano FM, Bonatto SL and Freitas LB (2010) The use and limits of ITS data in the analysis of intraspecific variation in
PassifloraL. (Passifloraceae). Genet Mol Biol 33:99-108. Mai JC and Coleman AW (1997) The internal transcribed spacer 2
exhibits a common secondary structure in green algae and flowering plants. J Mol Evol 44:258-271.
Melo NF and Guerra M (2003) Variability of the 5S and 45S rDNA sites inPassifloraL. species with distinct base
chro-mosome numbers. Ann Bot 92:309-316.
Muschner VC, Lorenz AP, Cervi AC, Bonatto SL, Souza-Chies TT, Salzano FM and Freitas LB (2003) A first molecular phylogenetic analysis of Passiflora (Passifloraceae). Am J Bot 90:1229-1238.
Muschner VC, Zamberlan PM, Bonatto SL and Freitas LB (2012) Phylogeny, biogeography and divergent times inPassiflora
(Passifloraceae). Genet Mol Biol 35:1036-1043.
Musters W, Boon K, van der Sande CA, van Heerikhuizen H and Planta RJ (1990) Functional analysis of transcribed spacers of yeast ribosomal DNA. EMBO J 9:3989-3996.
Queiroz CS, Batista FRC and Oliveira LO (2011) Evolution of the 5.8S nrDNA gene and internal transcribed spacers in
Carapichea ipecacuanha (Rubiaceae) within a
phylogeo-graphic context. Mol Phylogenet Evol 59:293-302. R Development Core Team (2011) R: A language and
environ-ment for statistical computing. R Foundation for Statistical Computing. Vienna, Austria. Available online at http://www.R-project.org/.
Ramaiya SD, Bujang JS and Zakaria MH (2014) Genetic diversity inPassifloraspecies assessed by morphological and ITS
se-quences analysis. Sci World J 2014:598313.
evolu-tion in theGlycine tomentella(Leguminosae) allopolyploid
complex. Genetics 166:987-998.
Reuster JS and Mathews DH (2010) RNAstructure: Software for RNA secondary structure prediction and analysis. BMC Bioinformatics 11:129.
Roy A, Frascaria N, Mackay J and Bousquet J (1992) Segregating random amplified polymorphic DNAs (RAPDs) inBetula alleghaniensis. Theor Appl Genet 85:173-180.
Shultz J, Maisel S, Gerlach D, Müller T and Wolf M (2005) A common core of secondary structure of the internal tran-scribed spacer 2 (ITS2) throughout the Eukaryota. RNA 11:361-364.
Simmons MP and Ochoterena H (2000) Gaps as characters in se-quence based phylogenetic analyses. Syst Biol 49:369-381. Tamura K, Stecher G, Peterson D, Filipski A and Kumar S (2013) MEGA6: Molecular Evolutionary Genetics Analysis ver-sion 6.0. Mol Biol Evol 30:2725-2729.
Thompson JD, Gibson TJ, Plewniak F, Jeanmougin F and Higgins DG (1997) The CLUSTALX windows interface: Flexible strategies for multiple sequences alignment aided by quality analysis tools. Nucleic Acids Res 25:4876-4882.
Ulmer T and MacDougal JM (2004)Passiflora- Passionflowers
of the World. Timber Press, Portland, 430 p.
van der Sande CA, Kwa M, Nues RW van, Heerikhuizen H van, Raué HA and Planta RJ (1992) Functional analysis of inter-nal transcribed spacer 2 ofSaccharomyces cerevisiae ribo-somal DNA. J Mol Biol 223:899-910.
Wendel JF, Schnabel A and Seelanan T (1995) Bidirectional interlocus concerted evolution following allopolyploid speciation in cotton (Gossypium). Proc Natl Acad Sci U S A 92:280-284.
White TJ, Bruns T, Lee S and Taylor J (1990) Amplication and di-rect sequencing of fungal ribosomal RNA genes for phylogenetics. In: Innis M, Gelfand D, Sninsky J and White T (eds) PCR Protocols: A Guide to Methods and Applica-tions. Academic Press, San Diego, pp 315-322.
Wissemann V and Ritz CM (2005) The genusRosa(Rosoideae,
Rosaceae) revisited: Molecular analysis of nrITS-1 and
atpB-rbcLintergenic spacers (IGS) versus conventional tax-onomy. Bot J Linn Soc Lond 147:275-290.
Yockteng R and Nadot S (2004a) Infrageneric phylogenies: A comparison of chloroplast-expressed glutamine synthetase, cytosol-expressed glutamine synthetase and cpDNA
maturase K in Passißora. Mol Phylogenet Evol.
31:397-402.
Yockteng R and Nadot S (2004b) Phylogenetic relationships amongPassifloraspecies based on the glutamine synthase nuclear gene expressed in chloroplast (ncpGS). Mol
Phylogenet Evol 31:379-396.
Young ND and Healy J (2003) GapCoder automates the use of indel characters in phylogenetic analysis. BMC Bioinformatics 4:6.
Zimmer EA, Roalson EH, Skog LE, Boggan JK and Idnurm A (2002) Phylogenetic relationships in the Gesnerioideae (Gesneriaceae) based on nrDNA ITS and cpDNAtrnL-F
andtrnE-Tspacer region sequences. Am J Bot 89:296-311.
Supplementary material
The following online material is available for this ar-ticle:
Figure S1 - Phylogenetic trees based on ITS se-quences forAstrophea, ITS1.
Figure S2 - Phylogenetic trees based on ITS se-quences forAstrophea, ITS2.
Figure S3 - Phylogenetic trees based on ITS se-quences forDecaloba, ITS1.
Figure S4 - Phylogenetic trees based on ITS se-quences forDecaloba, ITS2.
Figure S5 - Phylogenetic trees based on ITS se-quences forDeidamioides, ITS1.
Figure S6. Phylogenetic trees based on ITS sequences forDeidamioides, ITS2.
Figure S7. Phylogenetic trees based on ITS sequences forPassiflora, ITS1.
Figure S8 - Phylogenetic trees based on ITS se-quences forPassiflora, ITS2.
Table S1 - ITS1 and ITS2 sequences parameters ana-lyzed
Table S2 - Random sequences parameters analyzed.
Associate Editor: Marcio de Castro Silva Filho