NHESSD
1, 2589–2632, 2013A vulnerability assessment of RC
walls loaded by avalanches
P. Favier et al.
Title Page
Abstract Introduction
Conclusions References
Tables Figures
◭ ◮
◭ ◮
Back Close
Full Screen / Esc
Printer-friendly Version Interactive Discussion
Discussion
P
a
per
|
Dis
cussion
P
a
per
|
Discussion
P
a
per
|
Discussio
n
P
a
per
|
Nat. Hazards Earth Syst. Sci. Discuss., 1, 2589–2632, 2013 www.nat-hazards-earth-syst-sci-discuss.net/1/2589/2013/ doi:10.5194/nhessd-1-2589-2013
© Author(s) 2013. CC Attribution 3.0 License.
Geoscientiic Geoscientiic
Geoscientiic Geoscientiic
Natural Hazards and Earth System Sciences
Open Access
Discussions
This discussion paper is/has been under review for the journal Natural Hazards and Earth System Sciences (NHESS). Please refer to the corresponding final paper in NHESS if available.
A reliability assessment of physical
vulnerability of reinforced concrete walls
loaded by snow avalanches
P. Favier1,2, D. Bertrand1, N. Eckert2, and M. Naaim2 1
INSA Lyon/LGCIE (Laboratoire de G ´enie Civil et Ing ´enierie Environnementale), Site Coulomb 2, Avenue A. Einstein 69621, Villeurbanne cedex, France
2
IRSTEA, UR ETGR, Grenoble, France, 2 rue de la papeterie, BP76, 38402 Saint-Martind’H `eres, France
Received: 16 April 2013 – Accepted: 1 May 2013 – Published: 7 June 2013
Correspondence to: P. Favier ([email protected])
NHESSD
1, 2589–2632, 2013A vulnerability assessment of RC
walls loaded by avalanches
P. Favier et al.
Title Page
Abstract Introduction
Conclusions References
Tables Figures
◭ ◮
◭ ◮
Back Close
Full Screen / Esc
Printer-friendly Version Interactive Discussion
Discussion
P
a
per
|
Dis
cussion
P
a
per
|
Discussion
P
a
per
|
Discussio
n
P
a
per
|
Abstract
Snow avalanches are a threat to many kinds of elements (human beings, communi-cation axes, structures, etc.) in mountain regions. For risk evaluation, the vulnerability assessment of civil engineering structures such as buildings and dwellings exposed to avalanches still needs to be improved. This paper presents an approach to
deter-5
mine the fragility curves associated with Reinforced Concrete (RC) structures loaded by typical avalanche pressures and provides quantitative results for different geomet-rical configurations. First, several mechanical limit states of the RC wall are defined using classical engineering approaches (Eurocodes – EC2), and the pressure of struc-ture collapse is calculated from the usual yield line theory. Next, the failure probability
10
is evaluated as a function of avalanche loading using a Monte Carlo approach, and sensitivity studies (Sobol indexes) are conducted to estimate the respective weight of the RC wall model inputs. Finally, fragility curves and relevant indicators such a their mean and fragility range are proposed for the different structure boundary conditions tested. The influence of the input distributions on the fragility curves is investigated.
15
This shows the wider fragility range and/or the slight shift in the median that has to be considered when the possible correlation/non-Gaussian nature of the input distribu-tions is accounted for.
1 Introduction
The increasing urban development in mountainous areas requires addressing hazard
20
issues such as rockfalls, landslides and avalanches (Naaim et al., 2010). In addition to human casualties, the physical vulnerability of civil engineering structures is concerned by snow avalanche risk management. Depending on the external loading applied to the structure, that is to say the natural hazard considered (rockfall, landslide, earthquake, etc.), the physical vulnerability of civil engineering structures is usually assessed diff
er-25
NHESSD
1, 2589–2632, 2013A vulnerability assessment of RC
walls loaded by avalanches
P. Favier et al.
Title Page
Abstract Introduction
Conclusions References
Tables Figures
◭ ◮
◭ ◮
Back Close
Full Screen / Esc
Printer-friendly Version Interactive Discussion
Discussion
P
a
per
|
Dis
cussion
P
a
per
|
Discussion
P
a
per
|
Discussio
n
P
a
per
|
is defined that represents the overall damage level of the structure, the potential failure of the system can be assessed and even its failure probability if the calculations are performed within a stochastic framework.
Avalanche risk mapping is often carried out combining probabilistic avalanche hazard quantification (e.g. Keylock, 2005; Eckert et al., 2010) and vulnerability (deterministic
5
framework) or fragility (probabilistic framework) relations to assess individual risk for people (Arnalds et al., 2004) and buildings (Cappabianca et al., 2008). For instance, the Bayesian framework (Eckert et al., 2009, 2008; Pasanisi et al., 2012) makes it possible to take into account uncertainties in the statistical modeling assumptions and data availability. On the other hand, better defining vulnerability or fragility relations
10
remains a challenge for the improvement of the integrated framework of avalanche risk assessment (Eckert et al., 2012).
A review of vulnerability approaches for alpine hazards (Papathoma-K ¨ohle et al., 2010) mentioned various studies conducted to derive vulnerability relations. Several definitions have been proposed. One point of view is to define the vulnerability of
15
a structure by its economic cost and not its physical damage (Fuchs et al., 2007), which can require to express a recovery cost (Mavrouli and Corominas, 2010). Another point of view suggests that human survival probability inside a building is commonly related to the vulnerability of the building itself by empirical relations (Jonasson et al., 1999; Barbolini et al., 2004). For instance, Wilhelm (1998) introduced thresholds to build
vul-20
nerability relations for five different construction types impacted by snow avalanches and Keylock and Barbolini (2001) proposed relating the vulnerability of buildings with their position in the avalanche path. More recently, Bertrand et al. (2010) suggested using a deterministic numerical simulation to assess the structural failure susceptibility of reinforced concrete (RC) structures.
25
NHESSD
1, 2589–2632, 2013A vulnerability assessment of RC
walls loaded by avalanches
P. Favier et al.
Title Page
Abstract Introduction
Conclusions References
Tables Figures
◭ ◮
◭ ◮
Back Close
Full Screen / Esc
Printer-friendly Version Interactive Discussion
Discussion
P
a
per
|
Dis
cussion
P
a
per
|
Discussion
P
a
per
|
Discussio
n
P
a
per
|
the latter technique is often used. In hydraulic risk research, some studies focus on assessing dam safety using reliability methods (Peyras et al., 2012). Direct simulations (such as Monte Carlo methods) give robust results but can be time-consuming. As an alternative, simulation-based or surface approximation methods are used to avoid the direct calculation of the failure probability (Lemaire, 2005), but convergence of the
5
algorithm can be cumbersome.
In the snow avalanche context, vulnerability relations are often derived from back-analyzed in situ data which are often very scarce. These relations give the fraction of destroyed buildings as a function of the avalanche loading. A reliability assessment of vulnerability relations (fragility curve derivation) is therefore a useful complementary
10
tool for examining the interaction between the avalanche and the structures at different scales (avalanche path, urban area, individual house, etc.). This paper attempts to im-prove risk evaluations by proposing an innovative way to derive refined fragility curves that can be used in snow avalanche engineering.
As RC is the most usual material used to build structures exposed to potential
15
avalanche loadings, herein we focus on this technology. First of all, the RC structure is described. Secondly, the mechanical model of the RC wall, the snow avalanche loading description and the damage level definitions are presented following by the statistical distributions of the inputs of the deterministic mechanical model. Finally, fragility curves are derived and their sensitivity to input parameters, modeling assumptions and failure
20
criterion are discussed.
2 Methods
To protect people against snow avalanches, French hazard zoning defines three re-gions, which correspond to several levels of danger. The white zone corresponds to a safety zone where no potential interaction between the avalanche flow and the civil
25
NHESSD
1, 2589–2632, 2013A vulnerability assessment of RC
walls loaded by avalanches
P. Favier et al.
Title Page
Abstract Introduction
Conclusions References
Tables Figures
◭ ◮
◭ ◮
Back Close
Full Screen / Esc
Printer-friendly Version Interactive Discussion
Discussion
P
a
per
|
Dis
cussion
P
a
per
|
Discussion
P
a
per
|
Discussio
n
P
a
per
|
zone (blue zone), civil engineering structures, such as buildings or houses, can be built only within certain restrictions. For the wall facing the avalanche, no opening is al-lowed and the wall has to resist at least a pressure of 30 kPa. Several technologies are available. As mentioned by Givry and Perfettini (2004) the most common are wooden, masonry, RC or mixed structures. RC technology appears to provide the best value
5
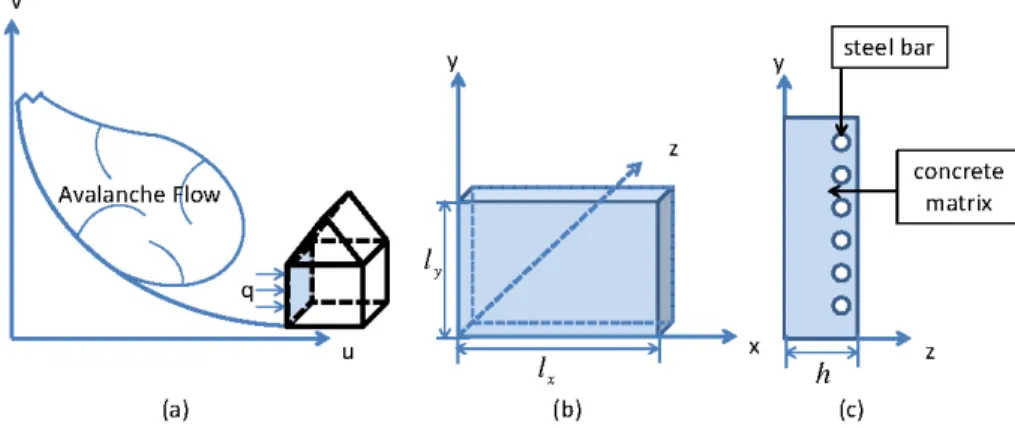
for money. Moreover, RC is usually the most frequently encountered material for such structures and in particular for dwellings. The most vulnerable part of a structure built in an avalanche path is the wall facing the flow (Fig. 1). Thus, the damage of the en-tire structure can be assessed from the wall’s resistance capacity. Indeed, the stress applied by the avalanche flow on the structure is balanced almost solely by the wall
10
facing the avalanche. Hence, in order to overcome the complex problem of modeling the entire dwelling, only the structural elements carrying the load, i.e. a flat vertical RC wall, are considered in this work.
2.1 RC wall description
First, the features of the wall considered are presented (geometry, mechanical
prop-15
erties of reinforced concrete, boundary conditions). Then, the out-of-plane mechanical response of a RC wall is described. The nature of the damage and how it evolves over time as a function of the loading magnitude are presented. From the physical vulnera-bility assessment point of view, relevant performance functions dedicated to quantifying the damage level of the RC wall can be proposed. Finally, the wall loading due to a snow
20
avalanche is presented and discussed.
2.1.1 RC wall features
The RC wall is composed of concrete and steel bars. The bars are orthogonal to one another and disposed homogeneously in the region of the wall where tensile stresses can develop (Fig. 1c). The number of steel bars is calculated from the steel density (ρs) 25
NHESSD
1, 2589–2632, 2013A vulnerability assessment of RC
walls loaded by avalanches
P. Favier et al.
Title Page
Abstract Introduction
Conclusions References
Tables Figures
◭ ◮
◭ ◮
Back Close
Full Screen / Esc
Printer-friendly Version Interactive Discussion
Discussion
P
a
per
|
Dis
cussion
P
a
per
|
Discussion
P
a
per
|
Discussio
n
P
a
per
|
situated in mountainous regions have been considered. Depending on the construc-tion soluconstruc-tion chosen, the RC wall boundary condiconstruc-tions can vary from one dwelling to another. Three kinds of boundary conditions are usually encountered. Each side of the wall can be considered either simply supported or clamped or can move without any constraint. From a mechanical point of view, concrete strength differs from compressive
5
to tensile regimes. The characteristic compressive strength (fc28) is generally ten times
greater than the tensile strength (ft). The compressive strength allowable for
calcula-tion is defined asfbc, as a function of the loading time parameter θ and the security
coefficientγbdescribed below:
fbc=
0.85×fc28
θγb
. (1)
10
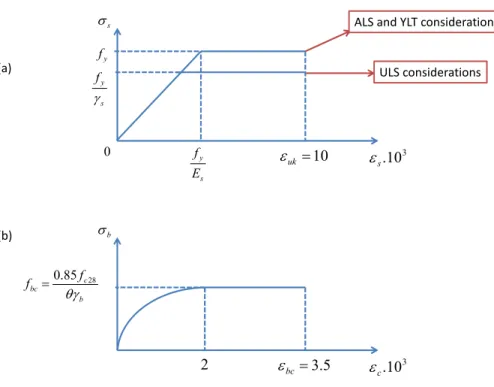
Steel’s behaviour exhibits two typical limits. First, the yield strength (fy) corresponds
to the development of permanent strain inside steel and secondly, the ultimate ten-sile strain (ǫuk) highlights the ability of steel to undergo more or less substantial yield
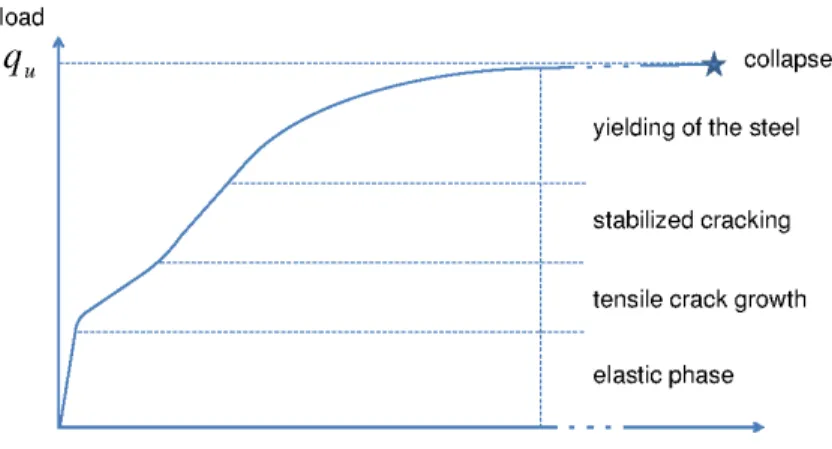
strain before failure. The RC behaviour is a combination of the two materials. Figure 2 depicts the typical evolution of a RC member subjected to a monotonic loading. Four
15
stages can be identified. The first stage represents the elastic response of the RC wall. The second stage corresponds to crack appearance and growth in the tensile zone of concrete. Once the crack distribution is stabilized (stage 3), the steel bars undergo plastic strain until the collapse of the RC element (stage 4). At the scale of the RC member, this last stage ends when a typical fracture lines pattern develops over the
20
entire RC structure. This failure mechanism induces structure’s loss of stability, leading to its collapse.
2.1.2 Limit states definitions
Appropriate quantitative performance functions are deduced from the RC wall dam-age levels. The structural failure is assumed to be due to excessive bending of the
25
NHESSD
1, 2589–2632, 2013A vulnerability assessment of RC
walls loaded by avalanches
P. Favier et al.
Title Page
Abstract Introduction
Conclusions References
Tables Figures
◭ ◮
◭ ◮
Back Close
Full Screen / Esc
Printer-friendly Version Interactive Discussion
Discussion
P
a
per
|
Dis
cussion
P
a
per
|
Discussion
P
a
per
|
Discussio
n
P
a
per
|
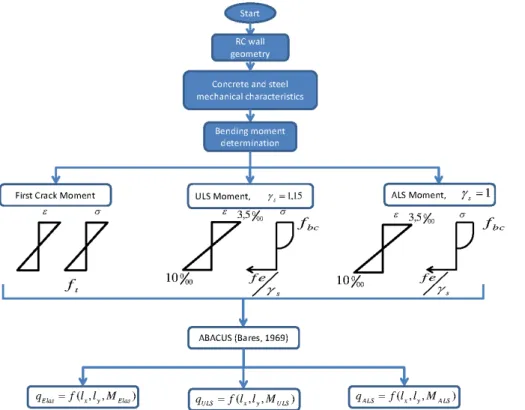
defined according to the crack appearance. The second and third damage levels are defined from Eurocode 2 design procedures (Mosley et al., 2007), where typical safety coefficients are proposed. Finally, the collapse of the RC wall is modeled by yield line theory (Johansen, 1962). It allows calculating the ultimate pressure that the structure can support before collapse. The first three stages are defined from the local
mechan-5
ical balance of the cross-section where the highest bending moment arises, whereas stage 4 considers the whole failure pattern of the wall.
2.1.3 Elastic limit state
The first crack in the concrete defines the upper limit of stage 1. Beyond the first stage, the RC wall is no longer elastic. This limit is calculated from the bending moment
10
leading to exceeding the tensile strength inside the concrete.
2.1.4 Ultimate Limit State (ULS)
This stage is defined in the Eurocode 2 regulation and concerns the safety of people in buildings and the building itself. In this paper, the ULS is related to potential loadings which can arise during the “normal” life term of the RC wall. The loadings are either
15
permanent or transitory but not exceptional. Under bending, the ultimate limit state is obtained when either the concrete reaches its ultimate compressive strain or the steel its ultimate tensile strain. Usually, a RC member is designed to optimize its mass (thus its cost). Therefore, the cross-section is calculated to reach the ultimate strain limits inside concrete and steel at the same time.
20
2.1.5 Accidental Limit State (ALS)
NHESSD
1, 2589–2632, 2013A vulnerability assessment of RC
walls loaded by avalanches
P. Favier et al.
Title Page
Abstract Introduction
Conclusions References
Tables Figures
◭ ◮
◭ ◮
Back Close
Full Screen / Esc
Printer-friendly Version Interactive Discussion
Discussion
P
a
per
|
Dis
cussion
P
a
per
|
Discussion
P
a
per
|
Discussio
n
P
a
per
|
2.1.6 Collapse
Finally, the collapse of the structure is characterized by its failure pattern. Under bend-ing, failure lines develop through the RC member leading to the structure’s collapse. In order to obtain the ultimate load, the yielding line theory is used, which is based on limit analysis theory; see for instance Nielsen and Hoang (2011). In the literature, some
5
theoretical and experimental studies have been compared. They related collapse fail-ure patterns as a function of boundary conditions (Sawczuk and Jaeger, 1963). Favre et al. (1990) provide theoretical solutions for RC slabs under various configurations.
2.1.7 Snow avalanche loading
Different types of avalanche flows can be observed in the Alps, inducing various
load-10
ings on the impacted structures. Spatial and temporal changes in snow avalanche loadings were experimentally observed and measured. For instance, small-scale ex-periments were conducted to reproduce the granular behaviour of snow and study its interaction with obstacles (Faug et al., 2010). Moreover, real-scale experiments were conducted, which allowed assessing the pressure magnitudes reached by dense
15
avalanche flows (Thibert et al., 2008) and powder avalanches (Sovilla et al., 2008). An open question concerning the physical vulnerability assessment of civil engineering structures is whether the problem should be considered with a dynamical approach or a quasi-static approach. Various studies (Daudon et al., 2013) considered that the dynamic effect has to be taken into account, whereas others obtained vulnerability
re-20
sults assuming quasi-static approaches (Bertrand et al., 2010). As already suggested, the type of avalanche can control the type of flow loading (quasi-static or dynamic). To determine whether a dynamic or a quasi-static approach has to be considered, a modal analysis has to be performed to compare avalanche loading and structure characteristic times. In this paper, it is assumed that the pressure of the avalanche
25
NHESSD
1, 2589–2632, 2013A vulnerability assessment of RC
walls loaded by avalanches
P. Favier et al.
Title Page
Abstract Introduction
Conclusions References
Tables Figures
◭ ◮
◭ ◮
Back Close
Full Screen / Esc
Printer-friendly Version Interactive Discussion
Discussion
P
a
per
|
Dis
cussion
P
a
per
|
Discussion
P
a
per
|
Discussio
n
P
a
per
|
are observed (Baroudi et al., 2011). The uniform pressure distribution could be consid-ered as a safety factor, since the maximum is applied over the entire vertical whereas, in reality it decreases.
2.2 Mechanical approaches
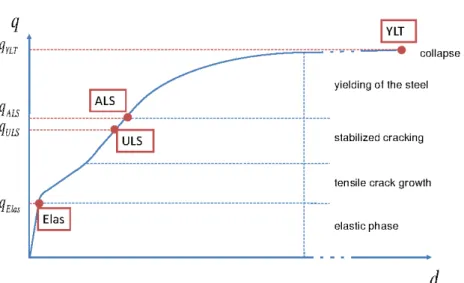
Figure 3 depicts the transitions between each damage levels (Elas: elastic limit, ULS:
5
ultimate limit state, ALS: accidental limit state, YLT: yield line theory). For each point, a loading pressure (qElas,qULS,qALS,qYLT) can be calculated. For the first three cases,
the load is obtained from the mechanical balance of the cross-section, which is submit-ted to the maximal bending moment inside the RC wall (Fig. 4). For the collapse load, yield line theory is used.
10
2.2.1 RC wall design under bending
2.2.2 Bending moment expression
First, the loss of RC elasticity is related to crack appearance when the tensile strength of concrete is exceeded. At this stage, the steel contribution in the overall behaviour can be ignored. The bending moment can thus be expressed as:
15
MElas=
ft·lxh2
6 . (2)
The second (resp. third) damage limit is attained when the bending moment defined by the ULS (resp. ALS) is reached. In this case, the following assumptions are made:
– Sections remain plane during loading.
– No slip can occur between concrete and steel.
20
NHESSD
1, 2589–2632, 2013A vulnerability assessment of RC
walls loaded by avalanches
P. Favier et al.
Title Page
Abstract Introduction
Conclusions References
Tables Figures
◭ ◮
◭ ◮
Back Close
Full Screen / Esc
Printer-friendly Version Interactive Discussion
Discussion
P
a
per
|
Dis
cussion
P
a
per
|
Discussion
P
a
per
|
Discussio
n
P
a
per
|
– Concrete’s tensile strength is ignored (ft=0).
– The ultimate compressive strain of the concrete (ǫbc) and the ultimate tensile
strain of the steel (ǫuk) are respectively limited to 3.5 ‰ and 10 ‰.
As functions of the ULS and the ALS, concrete and steel change with the safety coef-ficients (γbandγs). As a consequence, the corresponding maximal bending moments 5
also change. Figure 5 depicts assumed behaviours of the concrete and the steel. The RC wall design consists in attaining the maximum strengths in concrete and in the steel at the same time.fbc(Eq. 1) is estimated: the loading time of an avalanche load is less
than 1 h which impliesθ=0.85 and the safety coefficient γb=1.15. According to
as-sumptions previously made, the Eurocode 2 supplies the coefficientµAB=0.186. Thus, 10
by knowing the effective depth of the RC cross-sectiond, the corresponding moment per linear meter developed in the section can be calculated:
MAB=µABd2fbc. (3)
Next, by knowing the lever armz≈0.9d, the amount of steel (i.e. the percentage of steel inside concrete if normalized by the section area) needed to ensure that the
15
balance of the bending moment is equal to:
As=
MAB
zfy
γs
, (4)
whereγs=1.15 for ULS. Finally, the ULS and ALS (γs=1.0) bending moments are
expressed as:
MULS=MAB, (5)
20
MALS=Asz
fy
γs
NHESSD
1, 2589–2632, 2013A vulnerability assessment of RC
walls loaded by avalanches
P. Favier et al.
Title Page
Abstract Introduction
Conclusions References
Tables Figures
◭ ◮
◭ ◮
Back Close
Full Screen / Esc
Printer-friendly Version Interactive Discussion
Discussion
P
a
per
|
Dis
cussion
P
a
per
|
Discussion
P
a
per
|
Discussio
n
P
a
per
|
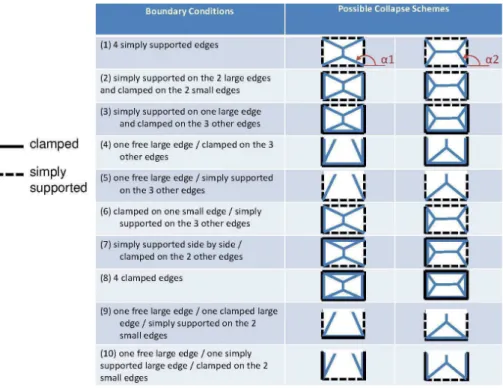
2.2.3 Boundary conditions
The spatial distribution of bending moments when the RC wall is submitted to a uniform pressure depends on the boundary conditions of each wall edge. Many combinations can be considered (free edge, clamped edge or simply supported edge). Bares (1969) proposed a useful abacus which gives the maximal bending moments developed in
5
elastic rectangular plates for numerous configurations of boundary conditions. In this paper, the derivation of vulnerability relations is carried out within a reliability frame-work. Thus, to calculate the failure probability of the RC wall, many runs are needed. By using the abacus to assess the RC wall’s resistance capacity, the computational time to perform a single run is very low, which makes it possible to use robust but
compu-10
tationally intensive reliability methods such as Monte Carlo simulations. Ten boundary conditions were implemented ((1)–(10), cf. Table 2). A linear spline is fitted to extrap-olate coefficients from available coefficients provided by the abacus. Knowing the limit bending moment for each damage stage, the corresponding pressure is deduced for each directionxandy:
15
qx= M
βx×lx2, (7)
qy= M
βy×ly2. (8)
2.2.4 RC wall collapse (yield line theory)
The ultimate resistance capacity of RC slabs under uniformly distributed load can be
20
derived from the classical yield-line theory (Johansen, 1962). This theory provides the collapse mechanism of the RC wall. Under an external loading, cracks will develop to form a pattern of “yield lines” until a mechanism is formed. A yield line corresponds to a nearly straight line along which a plastic hinge has developed because steel has reached its yield strength. To perform the yield line theory algorithm, the bending
NHESSD
1, 2589–2632, 2013A vulnerability assessment of RC
walls loaded by avalanches
P. Favier et al.
Title Page
Abstract Introduction
Conclusions References
Tables Figures
◭ ◮
◭ ◮
Back Close
Full Screen / Esc
Printer-friendly Version Interactive Discussion
Discussion
P
a
per
|
Dis
cussion
P
a
per
|
Discussion
P
a
per
|
Discussio
n
P
a
per
|
moment along yield lines needs to be characterized. The unitary bending moment along those lines remained constant and equal to the yielding steel moment calculated in Eq. (6). Indeed, as we are considering a uniform and isotropic reinforcement, the steadiness is verified. Then the energy balance between external and internal forces is assessed. According to the assumed yield line pattern, each neighbor plate can rotate.
5
The plates rotate around axes defined by the edges of the slab and the yield lines. During the rotation, energy is dissipated inside the material by yielding. The dissipated energy is calculated asMpi ×θi×Li, whereMpi is the plastic moment of the yield line
consideredi,θi the magnitude of the angle of rotation, andLi the length of the yield
line. The ultimate load is calculated from the equality between the external energy
10
(Wext) and the internal energy (Wint). In order to find the most likely collapse pattern,
the kinematic theorem is used. It consists in determining the failure pattern minimizing the collapse load. Thus, the following equations are derived:
Wint=
PnL
i=1
−→
Mpi ·
− →
θi ·Li
Wext=q
RR
δ(x,y)dxdy
(9)
wherenL is the number of yield lines,δ(x,y) is the displacement matrix andq is the 15
uniform load applied on the slab. Various failure patterns were considered as functions of the boundary conditions (Fig. 6). For each boundary condition, two failure patterns are mainly observed (Fig. 6, col. 2 and 3). Each pattern depends on an angleα1orα2.
2.3 Reliability framework
The reliability concept is based on the fact that the structure’s safety cannot be
as-20
NHESSD
1, 2589–2632, 2013A vulnerability assessment of RC
walls loaded by avalanches
P. Favier et al.
Title Page
Abstract Introduction
Conclusions References
Tables Figures
◭ ◮
◭ ◮
Back Close
Full Screen / Esc
Printer-friendly Version Interactive Discussion
Discussion
P
a
per
|
Dis
cussion
P
a
per
|
Discussion
P
a
per
|
Discussio
n
P
a
per
|
2.3.1 Failure probability definition
We wish to calculate the failure probabilityPf defined as the probability for the
resis-tance of the structurer to be less than or equal to a solicitations:
Pf=P[r≤s]=
s
Z
−∞
fR(r)dr. (10)
To solve Eq. (10), the probability density function of the resistancefR(r) needs to be 5
known. The Monte Carlo methods is the randomized algorithm chosen. It is a time-consuming method, but a robust one. By randomly generating N variables from the input probability distributions,N mechanical runs can be calculated. Thus, the proba-bility density function of the response can be approximated by the Monte Carlo integral:
ˆ
Pf. The central limit theorem provides a (1−α) asymptotic confidence interval reflecting 10
a significance level ofα:
ˆ
Pf
1−z1−α/2 q
ˆ
Pf(1−Pˆf)
√
N
≤Pf≤Pˆf
1+z1−α/2 q
ˆ
Pf(1−Pˆf)
√
N
, (11)
wherez1−α/2is theα-quantile of the normal distribution.
2.3.2 Sobol’s index
Sobol’s index is a tool providing the contribution of inputs to model outputs. It consists
15
NHESSD
1, 2589–2632, 2013A vulnerability assessment of RC
walls loaded by avalanches
P. Favier et al.
Title Page
Abstract Introduction
Conclusions References
Tables Figures
◭ ◮
◭ ◮
Back Close
Full Screen / Esc
Printer-friendly Version Interactive Discussion
Discussion
P
a
per
|
Dis
cussion
P
a
per
|
Discussion
P
a
per
|
Discussio
n
P
a
per
|
total effect indexSTi. ConsideringY as the model output andX as the vector of inputs,
Sobol’s indexes are defined as:
Si =VXi(EX∼i(Y|Xi))
V(Y) , (12)
STi=1−
VX
∼i(EXi(Y|X∼i))
V(Y) . (13)
5
According to Saltelli et al. (2010), Jansen (1999) provides the most efficient estimator of Eq. (13) through the approximation:
ˆ
STi=
1 2N
N
X
j=1
f(A)j−fA(Bi)
j
2
, (14)
whereY =f(X1,X2, ,Xk),AandBare anN×kmatrix of input factors andA
(i)
B is a matrix
where columni comes from matrixBand all otherk−1 columns from matrixA.
10
2.4 Vulnerability assessment
Statistical distributions of inputs need to be established. For calculation, six input vari-ables were chosen and their distributions were determined:lx,ly,h(m),fc28,fy, andft. Two sets of distributions are used: a set of normal independent distributions and a more realistic and intricate one provided by the Joint Committee on Structural Safety (2001)
15
NHESSD
1, 2589–2632, 2013A vulnerability assessment of RC
walls loaded by avalanches
P. Favier et al.
Title Page
Abstract Introduction
Conclusions References
Tables Figures
◭ ◮
◭ ◮
Back Close
Full Screen / Esc
Printer-friendly Version Interactive Discussion
Discussion
P
a
per
|
Dis
cussion
P
a
per
|
Discussion
P
a
per
|
Discussio
n
P
a
per
|
2.4.1 Statistical description of inputs
2.4.2 Normal distributions
First, to analyze the effect of each variable separately, a normal distribution describes each variable. Low and Hao (2001) provided several references identifying distributions for material inputs involved in our reinforced concrete slab problem. Mirza and
MacGre-5
gor (1979) assumed normal distributions to model the variability/uncertainty regarding the dimensions of slabs. After in situ experiments, a 0.05 coefficient of variations is sug-gested and the designed value is adopted as the mean distribution value. To undergo a first statistical description for our model, a 0.05 coefficient of variation is assumed for all the inputs concerned, leading to the mean and standard deviation provided in
10
(Table 3).
2.4.3 JCSS distributions
As reported by the JCSS, correlations between input variables can be taken into ac-count. Steel’s yield strength is still independent and follows a normal distribution. On the other hand, the tensile strength (ft) and the compressive strength of the concrete
15
(fbc) distributions are deduced from the basic concrete compression strength (fc28)
dis-tributions. For a ready-mixed concrete type with aC25 concrete grade, based on the given parameters, our parameters m,v,s,n are: m=3.65, v=3.0, s=0.12, n=10 and,tv is a random variable from a Student distribution forv degrees of freedom:
fc28=exp m+tvs
1+1n
0.5!
. (15)
20
Then,ft and fbc are calculated with λ,Y1 and, Y2.λis a factor taking into account the
NHESSD
1, 2589–2632, 2013A vulnerability assessment of RC
walls loaded by avalanches
P. Favier et al.
Title Page
Abstract Introduction
Conclusions References
Tables Figures
◭ ◮
◭ ◮
Back Close
Full Screen / Esc
Printer-friendly Version Interactive Discussion
Discussion
P
a
per
|
Dis
cussion
P
a
per
|
Discussion
P
a
per
|
Discussio
n
P
a
per
|
special placing, curing, and hardening of the concrete. In our case, αc is considered
equal to 0.85θγ
b:
fbc=αcfc28λ Y1, (16)
ft=0.3f
2/3
bc Y2. (17)
5
For all parameters, the marginal mean and standard deviation were set according to the JCSS recommendation (Table 4). Difference with the previous case (Table 3) concerns (fc28) for which they are higher in this case.
2.4.4 Normal correlated distributions
To implement an intermediate case, normal distributions are considered with
10
a variance-covariance matrix deduced from the JCSS distributions. Means and vari-ances of the six parameterslx,ly,h,fc28,fy, andftfollow Table 3. The main correlation
is the relation betweenfc28andft:ρ(fc28,ft)=0.31; others are lower than 0.01, i.e. close
to independence.
2.4.5 Fragility curves derivation
15
A fragility curveF(x) is a monotonic curve providing a failure probability as a function of a pressure applied, hence the cumulative distribution function F(x) of the failure probability for the loadx. The usual way to compute fragility curves is to set a pressure and vary the inputs from their statistical distributions. Thus, for each pressure a failure probability is obtained to build the fragility curve. Our approach is somewhat original as
20
failure probabilities are derived from an inverse resolution. First, the structure capacity of resistance is found, then by abacus inversion, a load distribution is assessed. Finally, the cumulative distribution function of the latter distribution makes it possible to link a failure probability to a pressure. For instance, Fig. 7 depicts an output histogram of the ULS case for a rectangular wall with one free edge and three clamped edges with
NHESSD
1, 2589–2632, 2013A vulnerability assessment of RC
walls loaded by avalanches
P. Favier et al.
Title Page
Abstract Introduction
Conclusions References
Tables Figures
◭ ◮
◭ ◮
Back Close
Full Screen / Esc
Printer-friendly Version Interactive Discussion
Discussion
P
a
per
|
Dis
cussion
P
a
per
|
Discussion
P
a
per
|
Discussio
n
P
a
per
|
normal independent inputs and the fragility curve associated through its cumulative distribution function.
3 Results
3.1 Fragility curves with uncorrelated normally distributed inputs
3.1.1 Overview of all configurations
5
Using 10 000 runs per curve, smoothed fragility curves are obtained. Figure 8 depicts fragility curves according to the ten explored boundary conditions. They are sorted by the four failure criteria. Two visual groups are formed. First, all the curves representing the elastic limit state are gathered at low pressure loads. By considering the minimum 2.5 % quantile and their maximum 97.5 % quantile, their fragility range is [2.8, 27.2]
10
(kPa). They do not interfere with fragility curves of the other failure criteria. On the other hand, the ULS, ALS and YLT fragility curves are defined on a range from 22.7 kPa to 218.6 kPa. It is interesting to note that the ALS fragility curves are scaled from the ULS curves by the security coefficient 1.15. This is easily explained by the definition itself of the ALS failure criterion.
15
Another point of view can be taken by plotting the same data according to the de-scription of their boundary conditions (Fig. 9). Sets of fragility curves can be deduced. The four weakest structures present free edges. Rectangular walls with one free edge are sorted from the weakest by their boundary conditions as below: (1) one free edge and three supported edges, (2) one supported edge, two clamped edges and one free,
20
(3) one clamped edge, two supported edges and one free1and (4) one free edge and three clamped edges. Then the second set of curves gathers the rectangular wall with supported edges ((5) four supported edges, (6) one clamped edge and three supported ones, (7) two supported edges and two clamped ones, (8) two supported edges and
1
NHESSD
1, 2589–2632, 2013A vulnerability assessment of RC
walls loaded by avalanches
P. Favier et al.
Title Page
Abstract Introduction
Conclusions References
Tables Figures
◭ ◮
◭ ◮
Back Close
Full Screen / Esc
Printer-friendly Version Interactive Discussion
Discussion
P
a
per
|
Dis
cussion
P
a
per
|
Discussion
P
a
per
|
Discussio
n
P
a
per
|
two clamped edges side by side, (9) one supported edge and three clamped ones). Finally, the less vulnerable rectangular wall has four clamped edges. Equation (18) provides thepquantile of each vulnerability curve:
F(x)=Pr(X ≤x)=p. (18)
The previous equation allows considering a more quantitative approach. Table 5 sums
5
up the 50 % quantiles and similar conclusions as described above are set up. The fragility range is defined as an interval: the lower bound is the 2.5 % quantile and the upper bound is the 97.5 % quantile of the fragility curve, which could be considered as very useful quantitative thresholds for engineering applications.
3.1.2 An example of one case: one free edge and three clamped edges
10
To investigate Monte Carlo confidence interval quantification, a focus on a particu-lar case was required. The selected case is the rectanguparticu-lar wall with one free edge and three clamped edges (Fig. 10). The four limit state fragility curves can be distin-guished together with Monte Carlo confidence intervals. As mechanical runs are not time-consuming, the number of calls N can be high enough to make numerical
un-15
certainty negligible. Thus 10 000 runs induce thin confidence intervals near the curve, giving confidence in all the numerical results provided.
3.2 Parametric study
This section is devoted to the analysis of total Sobol indexes. As each of the input variables are independent, their sum is equal to 1. Sensitivity pies of outputs according
20
to the input distribution can be plotted (Fig. 11). Four input parameters influence the fragility assessment based on the elastic failure criterion:ft,lx,ly and h. The variable
NHESSD
1, 2589–2632, 2013A vulnerability assessment of RC
walls loaded by avalanches
P. Favier et al.
Title Page
Abstract Introduction
Conclusions References
Tables Figures
◭ ◮
◭ ◮
Back Close
Full Screen / Esc
Printer-friendly Version Interactive Discussion
Discussion
P
a
per
|
Dis
cussion
P
a
per
|
Discussion
P
a
per
|
Discussio
n
P
a
per
|
be the variable influenced the most by these outputs. This indicates which variables should be considered with the greatest care while designing a structure in practice, depending on the chosen failure criterion.
3.3 Correlated versus independent inputs
Fragility curves are highly dependent on the input distributions used. Outcomes were
5
obtained from the three distributions previously described (Fig. 12). As a general overview, correlated distributions induce greater spread in fragility curves. Their fragility ranges have a higher amplitude than the range derived from a normal independent approach. Two explanations can be proposed. First, correlated distributions make me-chanical variables evolve at the same tendency. Thus the whole system attains higher
10
amplitudes. The second explanation lies in the number of variables considered: the more variables are considered, the more uncertainties are taken into account. It may be generalized that the more uncertainties are introduced in the input variables, the larger the fragility range of the fragility curves is. To ascertain and detail this conclu-sion, Fig. 13 focuses on the ULS example for the same boundary conditions. It
ap-15
pears clearly that from the deterministic point of view (a simple 0−1 response if the fragility limit is attained or is not attained) to the JCSS-based approach, fragility curves have wider fragility ranges. Quantiles at 2.5 %, 50 % and 97.5 % support these results (Table 6). Moreover, deterministic and normal distributions (whether or not they are correlated) have the same 50 % quantile. This results from the linear resolution of the
20
mechanical process: the 50 % quantile remains constant whatever the covariance ma-trix, whereas the fragility range changes according to the normal distributions, marginal variances and correlations. On the other hand, a non-normal distribution (JCSS) in-duces a change in the 50 % quantile and in the fragility curve shape because of the non-symmetry of the joint input distribution. Note, however, that the non-Gaussian
cor-25
NHESSD
1, 2589–2632, 2013A vulnerability assessment of RC
walls loaded by avalanches
P. Favier et al.
Title Page
Abstract Introduction
Conclusions References
Tables Figures
◭ ◮
◭ ◮
Back Close
Full Screen / Esc
Printer-friendly Version Interactive Discussion
Discussion
P
a
per
|
Dis
cussion
P
a
per
|
Discussion
P
a
per
|
Discussio
n
P
a
per
|
4 Conclusions
The proposed approach can be considered as a comprehensive framework providing fragility curves for RC walls exposed to a snow avalanche pressure load. It could be considered with benefits for other sorts of problems and in particular for other types of civil engineering structures (structures with different materials, structures built with
5
another technology, etc.) or natural hazards.
In detail, the influence of the boundary conditions and of the stochastic input distri-butions were systematically investigated, so as to provide robust fragility curves for var-ious building types. Their most useful application may be individual risk assessment, including sensitivity analyses, for which the main concern is to evaluate the survival
10
probability as a function of space for a hypothetical individual within different building types.
Four limit states based on the RC wall’s mechanical response were considered, three local (cross-section scale) and one global (wall scale). For instance, the distinction between the ULS, concerning the safety of people, and the real collapse, where the
15
structure is no longer standing, could lead to considering different thresholds for risk boundary assessment, leading to refined risk maps taking into account the winter us-age of each building.
It has also been shown that, from a statistical point of view, stochastic input dis-tributions strongly influence the shape of the fragility curves. Hence, independent or
20
correlated variables and as well as the number of variables considered constitute im-portant factors in the variability of fragility curves. This sensitivity to the input parameter distributions highlights that it seems important to consider and describe precisely the uncertainty sources for each application.
Finally, the deterministic simulations were carried out through simplified and effective
25
NHESSD
1, 2589–2632, 2013A vulnerability assessment of RC
walls loaded by avalanches
P. Favier et al.
Title Page
Abstract Introduction
Conclusions References
Tables Figures
◭ ◮
◭ ◮
Back Close
Full Screen / Esc
Printer-friendly Version Interactive Discussion
Discussion
P
a
per
|
Dis
cussion
P
a
per
|
Discussion
P
a
per
|
Discussio
n
P
a
per
|
exist, based on the finite element (FE) method, which can simulate the structure in greater detail and in particular describe how the damage field evolves when mate-rial nonlinearities develop inside the concrete and the steel reinforcement. However, these FE models are often more complex (i.e. for assessing convergence) and time-consuming. Hence, they may be less well-adapted to a generic individual risk base
5
approach, but more useful for studies deriving refined fragility curves for specific struc-tures included in precise engineering projects.
Acknowledgements. The authors thank the research program MOPERA (Mod ´elisation proba-biliste pour l’Etude du Risque d’Avalanche – avalanches.irstea.fr/mopera-projet/) and the MAP3 ALCOTRA INTERREG program for financially supporting this work. Authors are also grateful
10
to Regis Monnard for providing some pieces of advice.
References
Arnalds, P., J ´onasson, K., and Sigurdsson, S. : Avalanche hazard zoning in Iceland based on individual risk, Ann. Glaciol., 38, 285–290, doi:10.3189/172756404781814816, 2004. 2591 Barbolini, M., Cappabianca, F., and Sailer, R.: Empirical estimate of vulnerability relations
15
avalanche risk assessment, Manag. Informat. Syst., 9, 533–542, doi:10.2495/RISK040481, 2004. 2591
Bares, R.: Tables pour le calcul des dalles et des Parois, Dunod, Paris, 1969 (in French). 2599, 2623
Baroudi, D., Sovilla, B., and Thibert, E.: Effects of flow regime and sensor geometry on snow
20
avalanche impact-pressure measurements, J. Claciol., 57, 277–288, 2011. 2597
Bertrand, D., Naaim, M., and Brun, M.: Physical vulnerability of reinforced concrete build-ings impacted by snow avalanches, Nat. Hazards Earth Syst. Sci., 10, 1531–1545, doi:10.5194/nhess-10-1531-2010, 2010. 2591, 2596
Cappabianca, F., Barbolini, M., and Natale, L.: Snow avalanche risk assessment and mapping:
25
NHESSD
1, 2589–2632, 2013A vulnerability assessment of RC
walls loaded by avalanches
P. Favier et al.
Title Page
Abstract Introduction
Conclusions References
Tables Figures
◭ ◮
◭ ◮
Back Close
Full Screen / Esc
Printer-friendly Version Interactive Discussion
Discussion
P
a
per
|
Dis
cussion
P
a
per
|
Discussion
P
a
per
|
Discussio
n
P
a
per
|
CEN, Eurocode 2: Design of concrete structures – Part 1-1: – general rules and rules for build-ings (EN 1992-1-1:2004), CEN Technical Committee, 2005. 2613
Daudon, D., Baroth, J., Ma, Y., Perrotin, P., and Mommessin, M.: Sensitivity of a reinforced concrete protective gallery under a snow avalanche load, Struc. Saf., 41, 47–56, 2013. 2596 Eckert, N., Parent, E., Faug, T., and Naaim, M.: Optimal design under uncertainty of a passive
5
defense structure against snow avalanches: from a general Bayesian framework to a simple analytical model, Nat. Hazards Earth Syst. Sci., 8, 1067–1081, doi:10.5194/nhess-8-1067-2008, 2008. 2591
Eckert, N., Parent, E., Faug, T., and Naaim, M.: Bayesian optimal design of an avalanche dam using a multivariate numerical avalanche model, Stoch. Env. Res. Risk A., 23, 1123–1141,
10
2009. 2591
Eckert, N., Naaim, M., and Parent, E.: Long-term avalanche hazard assessment with a Bayesian depth-averaged propagation model, J. Glaciol., 56, 563–586, 2010. 2591 Eckert, N., Keylock, C., Bertrand, D., Parent, E., Faug, T., Favier, P., and Naaim, M.: Quantitative
risk and optimal design approaches in the snow avalanche field: review and extensions, Cold
15
Reg. Sci. Technol., 79–80, 1–19, 2012. 2591
Ellingwood, B. R.: Earthquake risk assessment of building structures, Reliab. Eng. Syst. Safe., 74, 251–262, 2001. 2591
Faug, T., Chanut, B., Beguin, R., Naaim, M., Thibert, E., and Baroudi., D.: A simple analytical model for pressure on obstacles induced by snow avalanches, Ann. Glaciol., 51, 1–8, 2010.
20
2596
Favre, R., Jaccoud, J., Burdet, O., and Charif, H.: Dimensionnement des Structure en B ´eton – Aptitude au Service et ´El ´ements de Structures, Presses Polytech. et Univ. Romandes, Lausanne, 1990. 2596, 2621
Fuchs, S., Thoeni, M., McAlpin, M. C., Gruber, U., and Bruendl, M.: Avalanche hazard mitigation
25
strategies assessed by cost effectiveness analyses and cost benefit analyses – evidence from Davos, Switzerland, Nat. Hazards, 41, 113–129, 2007. 2591
Givry, M. and Perfettini, P.: Construire en montagne: la prise en compte du risque d’avalanche, Tech. rep., Minist `ere de l’ ´ecologie et du d ´eveloppement durable, 2004 (in French). 2593 Jansen, M.: Analysis of variance designs for model output, Comput. Phys. Commun., 117, 35–
30
43, 1999. 2602
NHESSD
1, 2589–2632, 2013A vulnerability assessment of RC
walls loaded by avalanches
P. Favier et al.
Title Page
Abstract Introduction
Conclusions References
Tables Figures
◭ ◮
◭ ◮
Back Close
Full Screen / Esc
Printer-friendly Version Interactive Discussion
Discussion
P
a
per
|
Dis
cussion
P
a
per
|
Discussion
P
a
per
|
Discussio
n
P
a
per
|
Joint Committee on Structural Safety: Probabilistic Model Code, Part I–III, available at: http: //www.jcss.byg.dtu.dk/, last access: 24 May 2013, 2001. 2602
Jonasson, K., Sigurosson, S. T., and Arnalds, D.: Estimation of avalanche risk, Report No. R99001-URO, Reykjavik, Veourstofu Islands, Reykjavik, VI-R99001-UR01, 44 pp., 1999. 2591
5
Keylock, C.: An alternative form for the statistical distribution of extreme avalanche runout dis-tances, Cold Reg. Sci. Technol., 42, 185–193, 2005. 2591
Keylock, C. and Barbolini, M.: Snow avalanche impact pressure – vulnerability relations for use in risk assessment, Can. Geotech. J., 38, 227–238, 2001. 2591
Lagaros, N. D.: Probabilistic fragility analysis: A tool for assessing design rules of RC buildings,
10
Earthq. Eng. Eng. Vib., 7, 45–56, 2008. 2591
Lemaire, M.: Fiabilit ´e des Structures-couplage M ´ecano-fiabiliste Statique, Hermes, Paris, 2005. 2592
Li, Y. and Ellingwood, B. R.: Reliability of woodframe residential construction subjected to earth-quakes, Struc. Saf., 29, 294–307, 2007. 2591
15
Low, H. Y. and Hao, H.: Reliability analysis of reinforced concrete slabs under explosive loading, Struc. Saf., 23, 157–178, 2001. 2591, 2603
Mavrouli, O. and Corominas, J.: Rockfall vulnerability assessment for reinforced concrete build-ings, Nat. Hazards Earth Syst. Sci., 10, 2055–2066, doi:10.5194/nhess-10-2055-2010, 2010. 2591
20
Mirza, S. A. and MacGregor, J. G.: Variations in dimensions of reinforced concrete members, J. Struct. Div.-ASCE, 105, 751–766, 1979. 2603
Mosley, B., Bungey, J., and Hulse, R.: Reinforced Concrete Design: to Eurocode 2, 6th Edn., Palgrave Macmillan, UK, 2007. 2595
Naaim, M., Faug, T., Naaim, F., and Eckert, N.: Return period calculation and passive structure
25
design at the Taconnaz avalanche path, France, Ann. Glaciol., 51, 89–97, 2010. 2590 Nielsen, M. and Hoang, L.: Limit analysis and concrete plasticity, CRC Press, Boca Raton, FL,
USA, 2011. 2596
Papathoma-K ¨ohle, M., Kappes, M., Keiler, M., and Glade, T.: Physical vulnerability assessment for alpine hazards: state of the art and future needs, Nat. Hazards, 58, 1–36, 2010. 2591
30
NHESSD
1, 2589–2632, 2013A vulnerability assessment of RC
walls loaded by avalanches
P. Favier et al.
Title Page
Abstract Introduction
Conclusions References
Tables Figures
◭ ◮
◭ ◮
Back Close
Full Screen / Esc
Printer-friendly Version Interactive Discussion
Discussion
P
a
per
|
Dis
cussion
P
a
per
|
Discussion
P
a
per
|
Discussio
n
P
a
per
|
Peyras, L., Carvajal, C., Felix, H., Bacconnet, C., Royet, P., Becue, J.-P., and Boissier, D.: Probability-based assessment of dam safety using combined risk analysis and reliability methods-application to hazards studies, European Journal of Environmental and Civil En-gineering (EJECE), 16, 795–817, 2012. 2592
Saltelli, A., Annoni, P., Azzini, I., Campolongo, F., Ratto, M., and Tarantola, S.: Variance based
5
sensitivity analysis of model output, Design and estimator for the total sensitivity index, Com-put. Phys. Commun., 181, 259–270, 2010. 2601, 2602
Sawczuk, A. and Jaeger, T.: Grenztragf ¨ahigkeits-Theorie der Flatten, Springer-Verlag Berlin/G ¨ottingen/Heidelberg, 1963 (in German). 2596
Sobol, I.: Global sensitivity indices for nonlinear mathematical models and their Monte Carlo
10
estimates, Math. Comput. Simulat., 55, 271–280, 2001. 2601
Sovilla, B., Schaer, M., and Rammer, L.: Measurements and analysis of full-scale avalanche impact pressure at the Vallee de la Sionne test site, Cold Reg. Sci. Technol., 51, 122–137, 2008. 2596
Thibert, E., Baroudi, D., Limam, A., and Berthet-Rambaud, P.: Avalanche impact pressure on
15
an instrumented structure, Cold Reg. Sci. Technol., 54, 206–215, 2008. 2596 2591
NHESSD
1, 2589–2632, 2013A vulnerability assessment of RC
walls loaded by avalanches
P. Favier et al.
Title Page
Abstract Introduction
Conclusions References
Tables Figures
◭ ◮
◭ ◮
Back Close
Full Screen / Esc
Printer-friendly Version Interactive Discussion
Discussion
P
a
per
|
Dis
cussion
P
a
per
|
Discussion
P
a
per
|
Discussio
n
P
a
per
|
Table 1.Safety coefficients on steel and concrete strength for ULS and ALS calculations CEN (2005).
ULS safety coefficient ALS safety coefficient
Steel γs=1.15 γs=1
NHESSD
1, 2589–2632, 2013A vulnerability assessment of RC
walls loaded by avalanches
P. Favier et al.
Title Page
Abstract Introduction
Conclusions References
Tables Figures
◭ ◮
◭ ◮
Back Close
Full Screen / Esc
Printer-friendly Version Interactive Discussion
Discussion
P
a
per
|
Dis
cussion
P
a
per
|
Discussion
P
a
per
|
Discussio
n
P
a
per
|
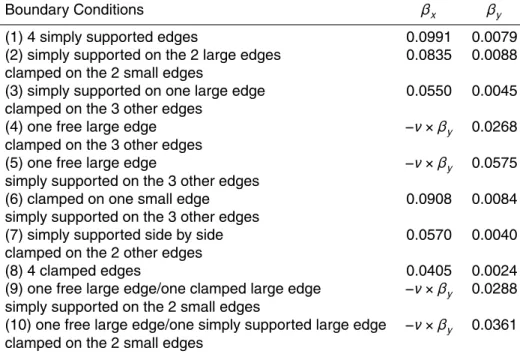
Table 2.Maximum bending moment coefficients (βx,βy) for a rectangular plate subjected to an uniform load. The Poisson’s ratioν=0.15 and lx
ly =0.5.
Boundary Conditions βx βy
(1) 4 simply supported edges 0.0991 0.0079
(2) simply supported on the 2 large edges 0.0835 0.0088 clamped on the 2 small edges
(3) simply supported on one large edge 0.0550 0.0045 clamped on the 3 other edges
(4) one free large edge −ν×βy 0.0268
clamped on the 3 other edges
(5) one free large edge −ν×βy 0.0575
simply supported on the 3 other edges
(6) clamped on one small edge 0.0908 0.0084
simply supported on the 3 other edges
(7) simply supported side by side 0.0570 0.0040
clamped on the 2 other edges
(8) 4 clamped edges 0.0405 0.0024
(9) one free large edge/one clamped large edge −ν×βy 0.0288 simply supported on the 2 small edges
NHESSD
1, 2589–2632, 2013A vulnerability assessment of RC
walls loaded by avalanches
P. Favier et al.
Title Page
Abstract Introduction
Conclusions References
Tables Figures
◭ ◮
◭ ◮
Back Close
Full Screen / Esc
Printer-friendly Version Interactive Discussion
Discussion
P
a
per
|
Dis
cussion
P
a
per
|
Discussion
P
a
per
|
Discussio
n
P
a
per
|
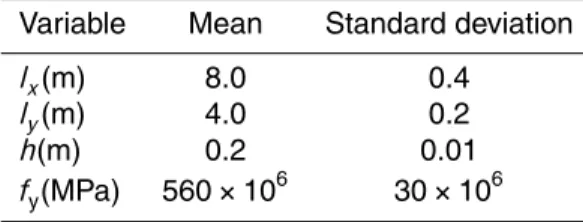
Table 3.Table presenting the distribution parameters of material inputs.
Variable Mean Standard deviation
lx(m) 8.0 0.4
ly(m) 4.0 0.2
h(m) 0.2 0.01
fc28(MPa) 30 1.5
fy(MPa) 500×106 25×106
NHESSD
1, 2589–2632, 2013A vulnerability assessment of RC
walls loaded by avalanches
P. Favier et al.
Title Page
Abstract Introduction
Conclusions References
Tables Figures
◭ ◮
◭ ◮
Back Close
Full Screen / Esc
Printer-friendly Version Interactive Discussion
Discussion
P
a
per
|
Dis
cussion
P
a
per
|
Discussion
P
a
per
|
Discussio
n
P
a
per
|
Table 4.Table presenting the distribution of independent material inputs.
Variable Mean Standard deviation
lx(m) 8.0 0.4
ly(m) 4.0 0.2
h(m) 0.2 0.01
NHESSD
1, 2589–2632, 2013A vulnerability assessment of RC
walls loaded by avalanches
P. Favier et al.
Title Page
Abstract Introduction
Conclusions References
Tables Figures
◭ ◮
◭ ◮
Back Close
Full Screen / Esc
Printer-friendly Version Interactive Discussion
Discussion
P
a
per
|
Dis
cussion
P
a
per
|
Discussion
P
a
per
|
Discussio
n
P
a
per
|
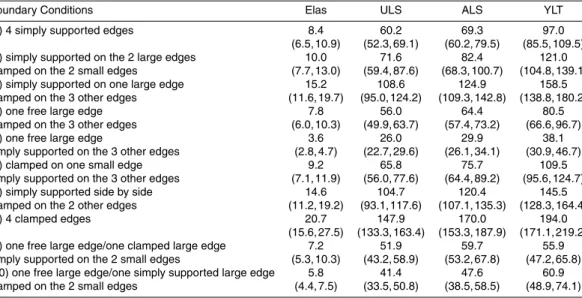
Table 5.50 % quantile of the CDF fragility curves according to boundary conditions and failure criterion, and (2.5 %, 97.5 %) quantile defining a fragility range (kPa).
Boundary Conditions Elas ULS ALS YLT
(1) 4 simply supported edges 8.4 60.2 69.3 97.0
(6.5, 10.9) (52.3, 69.1) (60.2, 79.5) (85.5, 109.5)
(2) simply supported on the 2 large edges 10.0 71.6 82.4 121.0
clamped on the 2 small edges (7.7, 13.0) (59.4, 87.6) (68.3, 100.7) (104.8, 139.1)
(3) simply supported on one large edge 15.2 108.6 124.9 158.5
clamped on the 3 other edges (11.6, 19.7) (95.0, 124.2) (109.3, 142.8) (138.8, 180.2)
(4) one free large edge 7.8 56.0 64.4 80.5
clamped on the 3 other edges (6.0, 10.3) (49.9, 63.7) (57.4, 73.2) (66.6, 96.7)
(5) one free large edge 3.6 26.0 29.9 38.1
simply supported on the 3 other edges (2.8, 4.7) (22.7, 29.6) (26.1, 34.1) (30.9, 46.7)
(6) clamped on one small edge 9.2 65.8 75.7 109.5
simply supported on the 3 other edges (7.1, 11.9) (56.0, 77.6) (64.4, 89.2) (95.6, 124.7)
(7) simply supported side by side 14.6 104.7 120.4 145.5
clamped on the 2 other edges (11.2, 19.2) (93.1, 117.6) (107.1, 135.3) (128.3, 164.4)
(8) 4 clamped edges 20.7 147.9 170.0 194.0
(15.6, 27.5) (133.3, 163.4) (153.3, 187.9) (171.1, 219.2)
(9) one free large edge/one clamped large edge 7.2 51.9 59.7 55.9
simply supported on the 2 small edges (5.3, 10.3) (43.2, 58.9) (53.2, 67.8) (47.2, 65.8)
(10) one free large edge/one simply supported large edge 5.8 41.4 47.6 60.9
NHESSD
1, 2589–2632, 2013A vulnerability assessment of RC
walls loaded by avalanches
P. Favier et al.
Title Page
Abstract Introduction
Conclusions References
Tables Figures
◭ ◮
◭ ◮
Back Close
Full Screen / Esc
Printer-friendly Version Interactive Discussion
Discussion
P
a
per
|
Dis
cussion
P
a
per
|
Discussion
P
a
per
|
Discussio
n
P
a
per
|
Table 6.Quantiles of fragility curves illustrated in Fig. 13.
Approach 2.5 % 50 % 97.5 %
Deterministic 55.5
Normal independent 50.2 56.3 64
JCSS 45.3 62.5 86.2
NHESSD
1, 2589–2632, 2013A vulnerability assessment of RC
walls loaded by avalanches
P. Favier et al.
Title Page
Abstract Introduction
Conclusions References
Tables Figures
◭ ◮
◭ ◮
Back Close
Full Screen / Esc
Printer-friendly Version Interactive Discussion
Discussion
P
a
per
|
Dis
cussion
P
a
per
|
Discussion
P
a
per
|
Discussio
n
P
a
per
|
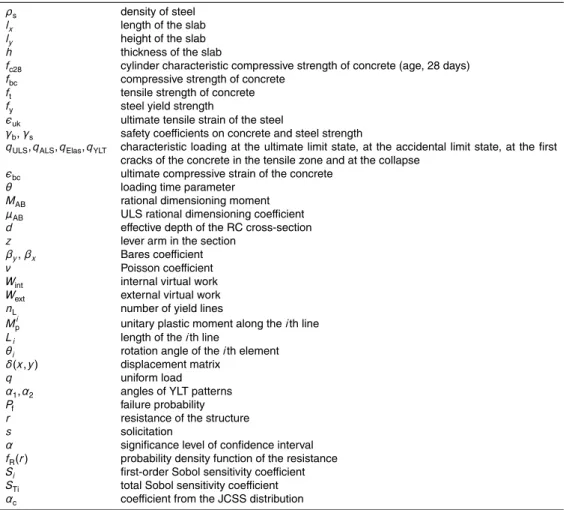
Table 7.Nomenclature.
ρs density of steel
lx length of the slab
ly height of the slab
h thickness of the slab
fc28 cylinder characteristic compressive strength of concrete (age, 28 days)
fbc compressive strength of concrete
ft tensile strength of concrete
fy steel yield strength
ǫuk ultimate tensile strain of the steel
γb,γs safety coefficients on concrete and steel strength
qULS,qALS,qElas,qYLT characteristic loading at the ultimate limit state, at the accidental limit state, at the first
cracks of the concrete in the tensile zone and at the collapse
ǫbc ultimate compressive strain of the concrete
θ loading time parameter
MAB rational dimensioning moment
µAB ULS rational dimensioning coefficient
d effective depth of the RC cross-section
z lever arm in the section
βy,βx Bares coefficient
ν Poisson coefficient
Wint internal virtual work
Wext external virtual work
nL number of yield lines
Mpi unitary plastic moment along theith line
Li length of theith line
θi rotation angle of theith element
δ(x,y) displacement matrix
q uniform load
α1,α2 angles of YLT patterns
Pf failure probability
r resistance of the structure
s solicitation
α significance level of confidence interval
fR(r) probability density function of the resistance
Si first-order Sobol sensitivity coefficient
STi total Sobol sensitivity coefficient
NHESSD
1, 2589–2632, 2013A vulnerability assessment of RC
walls loaded by avalanches
P. Favier et al.
Title Page
Abstract Introduction
Conclusions References
Tables Figures
◭ ◮
◭ ◮
Back Close
Full Screen / Esc
Printer-friendly Version Interactive Discussion
Discussion
P
a
per
|
Dis
cussion
P
a
per
|
Discussion
P
a
per
|
Discussio
n
P
a
per
|