www.hydrol-earth-syst-sci.net/18/493/2014/ doi:10.5194/hess-18-493-2014
© Author(s) 2014. CC Attribution 3.0 License.
Hydrology and
Earth System
Sciences
Analyzing streamflow changes: irrigation-enhanced interaction
between aquifer and streamflow in the Republican River basin
R. Zeng and X. Cai
Ven Te Chow Hydrosystems Laboratory, Department of Civil and Environmental Engineering, University of Illinois at Urbana-Champaign, Urbana, Illinois, USA
Correspondence to:X. Cai (xmcai@illinois.edu)
Received: 1 June 2013 – Published in Hydrol. Earth Syst. Sci. Discuss.: 19 June 2013 Revised: 20 December 2013 – Accepted: 2 January 2014 – Published: 10 February 2014
Abstract.Groundwater-fed irrigation has altered surface and groundwater interactions in the Republic River basin (RRB) in the midwestern United States, where agriculture heavily depends on irrigation. The decreasing flow trend recorded at the RRB gauging station since the 1950s reflects the syn-thetical effect of dynamic interactions between surface wa-ter and groundwawa-ter systems, which has been enhanced by groundwater pumping and irrigation return flow. This study uses a systematic modeling approach to analyze the conjunc-tive effects of pumping and return flow on streamflow. A wa-tershed management model, the Soil and Water Assessment Tool (SWAT), is modified and established for the French-man Creek basin (FCB), a subbasin of RRB, to examine the causes of streamflow changes. The baseflow component in SWAT is linked to aquifer storage so that the model can sim-ulate the combined effects of groundwater pumping and ir-rigation return flow on natural streamflow. Results show that irrigation has not only depleted streamflow but also changed the flow pattern and seasonal variability. The changes can be decomposed into decrease in the slow component (baseflow) and increase in the fast components (surface and subsurface flow). Since the fast components are subject to higher ability than the slow component, the annual streamflow vari-ability is amplified. Agricultural water use in this region also has changed the groundwater storage seasonal regime from the pattern of “summer recharge and winter discharge” in the past to “summer discharge and winter recharge” at present. This challenges the existing groundwater modeling, which usually assumes fixed recharge pattern and rates.
1 Introduction
Irrigation has contributed to the agricultural production in-crease during the past decades, becoming the largest wa-ter consumption sector throughout the world, accounting for about 70 % of the global freshwater withdrawals and 90 % of consumptive water uses (Siebert et al., 2010). In the United States, irrigation is located in the states where average an-nual precipitation is typically less than 20 inches and thereby is insufficient for crop consumption. As the surface water resources is prone to be affected by climate variability and pollution, and needs infrastructure investment for storage (i.e., reservoir) and delivery (i.e., channels), groundwater has replaced surface water as the major water source in many places. In 2005, 13 western states consumed nearly 90 % of the groundwater used for irrigation, among which ground-water was the primary source for irrigation in Nebraska, Arkansas, Texas, Kansas, Mississippi, and Missouri (Kenny et al., 2009).
ergy and water through the interactions between soil profile, land surface flux and groundwater depth. Studies have shown that irrigation increases surface latent heat flux and dew point temperature, while decreases sensible heat flux and near-ground temperature (Adegoke et al., 2003; Tang et al., 2007). DeAngelis et al. (2010) found the intensive groundwater pumping for agricultural use over the Great Plains leads to increased vapor, which aggregates to enhance downwind precipitation. According to Ferguson and Maxwell (2012), the effect of water management (e.g., pumping and irriga-tion) on terrestrial water and energy budgets is even com-parable in magnitude to the impact of climate change (e.g., changes in temperature and precipitation). Thus, understand-ing the details of how irrigation affects hydrological pro-cesses will help in understanding hydrological alterations over watershed scales, as well as providing support for con-junctive management of surface water and groundwater re-sources in terms of satisfying both human and environmental water needs.
While the complex feedbacks between irrigation and land surface processes have been less studied because of difficul-ties in observation data, the impact of large-scale pumping on aquifer storage and streamflow is more likely to be ob-served (McGuire, 2009) and hence has been studied inten-sively since Theis (1940). Jenkins (1968) analyzed the stream depletion volume and residual timing of pumping by intro-ducing the SDF (stream depletion factor), which measures how fast groundwater withdrawal transfers from aquifer stor-age to stream depletion, to account for the transient effect of pumping. Kendy and Bredehoeft (2006) assessed the re-sponse of streamflow to pumping wells with different dis-tances to the river. They found that stream depletion caused by near-stream pumping wells quickly reaches equilibrium and responses temporally in phase with pumping; however, far-away wells cause smaller stream depletion and seasonal fluctuation, and a greater portion of the depletion occurs dur-ing post-irrigation season. They also examined the impact of irrigation efficiency on the streamflow seasonality and found that when the irrigation system delivers water inefficiently, irrigation return flow recharges the aquifer during irrigation season and discharges to stream during post-irrigation sea-son, boosting fall and winter low flows. The return flow to stream is a loss of irrigation water but a gain of streamflow in many cases. For example, Gosain et al. (2005) studied return
by the models used for the analysis. Few current groundwa-ter models explicitly simulate the impact of irrigation return flow on aquifer–stream interaction; while surface hydrologi-cal models usually do not simulate the impact of groundwater pumping on baseflow appropriately. Both modeling groups capture one aspect of the picture, but not the whole. For ex-ample, the aquifer recharge, evapotranspiration and channel loss in groundwater models are usually decided through cal-ibration and treated as fixed values during the simulation pe-riod. Attempts to simulate crop processes, such as with the Farm Process package of MODFLOW, improve the estimate of crop water requirement (Schmid et al., 2006). However, those models usually do not simulate the soil profile, which plays an important role in determining crop growth, recharge and evapotranspiration (Rodriguez-Iturbe et al., 1999). Some surface hydrological models have detailed representations of crop irrigation requirement and soil moisture, but usu-ally assume that groundwater-fed irrigation has no impact on the source (i.e., aquifer storage) (Sophocleous and Perkins, 2000). It is important to note irrigation affects spatially dis-tributed hydrological processes and land-energy fluxes de-pending on the location of irrigated crops (Ferguson and Maxwell, 2011). The streamflow recorded at gauging stations is the result of dynamic interactions between surface water and groundwater systems over different temporal and spa-tial scales, where return flow plays a critical role in parspa-tially compensating the stream depletion caused by groundwater pumping and changing the process of streamflow response to climatic variability through the conjunctive management of surface water and groundwater systems.
Fig. 1. Accumulative number of active groundwater pump-ing wells of Colorado, Kansas and Nebraska in RRB (adopted from Republican River Compact Administration http://www.republicanrivercompact.org/v12p). Starting in the 1960s, groundwater-fed irrigation has become the largest aquifer water use in this region.
in the area since the 1950s and considerable streamflow de-pletion has been reported (Burt et al., 2002). This case study will then illustrate the streamflow change in the context of stream–aquifer interaction under the effects of pumping and return flow.
2 Study area and model description
2.1 Frenchman Creek basin
The RRB, lying above the northern Ogallala Aquifer, is shared by Colorado, Nebraska, and Kansas. The FCB, a sub-basin of RRB, lays above the Ogallala Formation, which is composed mainly of silt, sand, gravel, and clay-rock debris that have been washed off the face of the Rocky Mountains and other more local sources over the past several million years (Gutentag, 1984). Recharge to the High Plains aquifer is primarily fed by precipitation through infiltration. Natu-ral discharge from the High Plains aquifer goes to springs, seeps, and streams, as well as by evapotranspiration flux. However, the pumping for irrigated crops now becomes a sig-nificant discharge from the aquifer. The Ogallala Formation has the greatest saturated thickness, and the portion in FCB ranges from 200 to 300 ft. above the Permian bedrock (Miller et al., 1997). The aquifer underlying the FCB is conceptu-alized as a one-layer unconfined aquifer above a non-leaky bedrock in the groundwater model established by the Repub-lican River Compact Administration (RRCA). Groundwater-fed irrigation since the 1950s (shown in Fig. 1 as the pump-ing well numbers) in this region has reduced aquifer storage and caused stream depletion problems in the RRB as shown in Fig. 2. Groundwater storage in the High Plains aquifer in 2009 was about 2.9 billion acre-ft., showing a decline of about 274 million acre-ft. (or about 9 %) from predevelop-ment storage (McGuire, 2011). Szilagyi (2001) found the
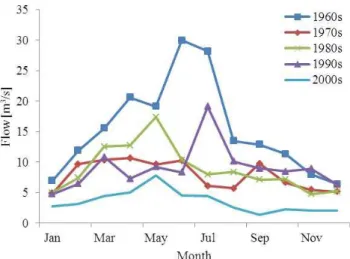
Fig. 2.Monthly flow regime (monthly average flow by each decade) at RRB outlet (source: USGS Station 06853500).
Republican River annual streamflow has declined by 61 % without a significant change in climate. Disputes about sur-face water and groundwater rights lead to a legal issue among the states sharing the aquifer.
The Frenchman Creek, about 166 mi. long, flows from Colorado to Nebraska. The average annual precipitation in this region from 1941 to 1994 was about 443 mm according to the Automated Weather Data Network with the High Plain Regional Climate Center (HPRCC, 2010), which increases from east to west as the effect of elevation gradient; annual potential evapotranspiration in this region is about 1100 mm. The crop in the basin is heavily dependent on central pivot ir-rigation from pumping wells. Although lacking of well doc-umented groundwater consumptive use data, studies have shown a strong statistical relationship between the number of pumping wells and stream depletion in this watershed (Burt et al., 2002). In this study, the pumping is estimated from annual irrigated crop acreage from the National Agricultural Statistics Service (USDA, 1999). The FCB has experienced stream depletion over the past decades. The majority of the flow in the watershed was sustained by the Ogallala Aquifer system. The perennial drainage section of the headwater, once located several miles west of the Nebraska–Colorado border, now shrinks downstream by several miles east of the border.
Fig. 3.Domain of the Frenchman Creek basin in the Republican River basin.
459 mm for pre-1970 and post-1970, respectively, and the standard deviation remain unchanged at around 95 mm. The annual average minimum temperature slightly increases from 1.96 to 2.13◦C; the annual average maximum temperature slightly decreases from 18.07 to 17.92◦C. Standard devia-tion of the both remain unchanged at around 0.7◦C. More-over, the seasonality of climatic variables was examined by averaging the monthly data for each decade; it is found that the pattern remains unchanged, i.e., the rainfall season is still in phase with the warm season. Actually, a slight decrease is found in the diurnal temperature range (difference between daily maximum and minimum temperature), which can be the result of irrigation. Irrigation leads to increased evapo-transpiration and humidity above farmland, converting more radiative energy into latent heat, which results in redistribu-tion of surface energy between latent heat, sensible heat and ground heat flux. Adegoke et al. (2003) compared the surface energy budget between irrigated and non-irrigated farmland in Nebraska. They found that due to the “cooling effect”, ir-rigation contributes to a 15 % decrease in sensible heat and 1.2◦C decrease in near-ground temperature. Thus, based on the observed data and some relevant analyses, changes in climate forcing cannot explain the significant decrease in streamflow, which is then mostly likely due to other factors such as land use and water use in the region.
2.2 Watershed management model
SWAT, a semi-distributed, physically based watershed model, includes components such as weather, hydrology, sediment transport, crop growth, water quality, and agricul-tural management, and has been widely applied to assessing water quantity and quality, land use and climate change im-pacts, and agriculture management in heterogeneous water-sheds (Gassman et al., 2007). Irrigation is simulated by an auto-irrigation subroutine, i.e., irrigation is applied when the soil moisture of a crop field is below the prescribed irrigation triggering threshold during the crop growing season.
Fig. 4.Annual precipitation (left) and maximum/mininimum tem-perature (right) in FCB. The climate exhibits no significant change during the last several decades. The slight decrease in diurnal tem-perature range implies the impact of irrigation on land surface en-ergy redistribution.
In the SWAT model the baseflow is calculated by the fol-lowing equation:
Qgw,i=Qgw,i−1Exp(−α1t )+Wrchrg,i[1−Exp(−α1t )], (1) wherei is the simulation day,1t is the time step (i.e., one day), Qgw,i is the baseflow, Wrchrg is the shallow aquifer
recharge from soil profile, andα is the baseflow recession coefficient. In Eq. (1), baseflow depends on the baseflow from the previous day (representing recession process) and recharge (representing the effect of rain-induced recharge on baseflow). However, the process reflecting the impact of groundwater pumping on streamflow is missing in Eq. (1). Groundwater pumping first captures aquifer storage, if the storage is not fully recovered, then the induced water table gradient would change the discharge (i.e., baseflow), causing stream depletion. To represent this process, alternatively, the baseflow component in SWAT has been modified based on the shallow (unconfined) aquifer water storage (Ssh):
Qgw,i =α Ssh,i, (2)
and storage is updated through shallow aquifer water bal-ance:
Ssh,i=Ssh,i−1+Wrchrg,i−Qgw,i−Wrevap,i−Wpump,i, (3)
whereWrevapis the water evapotranspirated from the shallow
aquifer by deep root vegetation;Wpumpis the water pumped
from aquifer for irrigation use, which is based on the soil moisture content. Note that Eq. (2) represents a linear stor-age model (Chow et al., 1988). If there is no recharge, i.e., evapotranspiration and pumping, baseflow is an ordinary dif-ferential equation and Eq. (1), originally used in SWAT, can be derived from Eqs. (2) and (3). Thus the baseflow recession parameter is consistently used in the original and modified model. However, the modified equation requires one more parameter, the initial storage, which needs to be calibrated from model outputs. Note that Eq. (3) assumes groundwater lateral flux is negligible in the water balance equation. This assumption is validated by checking the water table contour in the study area. The water table contour in 1979 and 1995 are obtained from the Conservation and Survey Division in the University of Nebraska (Swinehart and Richmond, 1994). Those contours show that the groundwater in FCB flows from west to east following the topographic gradient. Since the water table contour is generally perpendicular to the boundary of the FCB within Nebraska, the groundwater lateral flow exchange with the adjacent aquifer is negligible. The irrigated cropland acreage over years is an important model input, which determines the timing and location of groundwater pumping for irrigation. Since irrigation is the major water use in this watershed, the spatial and temporal expansion of irrigated crop water use affects the spatial het-erogeneity and temporal variability of groundwater storage change through pumping, which further affects the interac-tion between surface and ground water, especially the con-tribution of baseflow to river streams. Running the SWAT
model over years will capture the temporal variability of groundwater storage and then streamflow; the spatial vari-ability of groundwater storage, baseflow and the total stream-flow is related to the spatial distribution of irrigation pumping over the spatial units of the SWAT model (i.e., hydrologic re-sponse units represented by watersheds of a certain stream order).
To calibrate the model for the FCB, the outlet of the water-shed is chosen at the upstream of Enders Reservoir (USGS siteID 06831500) to exclude the impacts of surface water regulation on streamflow. The model is calibrated and val-idated for the periods 1981–1985 and 1986–1990, respec-tively, with a multiple-objective genetic algorithm. The root-mean-square error (RMSE) and logarithm of the RMSE of streamflow are chosen as calibration criteria to consider both high flow and low flow. The SWAT model is calibrated by the total streamflow (i.e., including both baseflow from aquifer discharge and surface runoff). The RMSE of crop yield is also set as criteria, mainly to calibrate the auto-irrigation trigger parameter, thus the water management activity (i.e., pumping amount and timing) is retrieved through flow and crop data. It is worth noting that the best calibration result of the original SWAT model does not even capture the stream decline trend. For details on model data, parameters, and cal-ibration procedures, the reader is referred to Zeng (2012).
3 Results
3.1 Streamflow change due to land use and pumping
The SWAT model is applied to three land use and water management scenarios, all under historical climate forcing data: (1) no agricultural development in this region; (2) land use change is represented by historical crop area but no ir-rigation (i.e., rain-fed crop); (3) historical crop area with groundwater pumping simulated by auto-irrigation in SWAT. The auto-irrigation module of SWAT calibrated to the case study watershed is used to determine the irrigation schedul-ing, including the water application timing and amount. By comparing the results from these scenarios, the impacts of land use and groundwater irrigation can be identified.
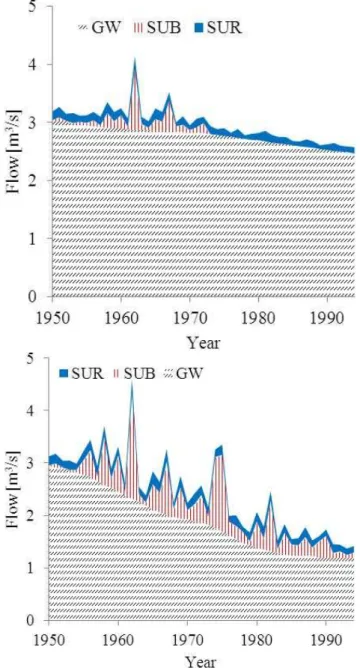
Fig. 5. Surface flow (SUR), subsurface flow (SUB) and base-flow (GW) for the non-irrigation (left) and irrigation (right) cases. Groundwater-fed irrigation decreases the slow flow component (GW) and increases fast flow components (SUR and SUB), leading to a streamflow more subjected to climate variability. The conver-sion from natural grassland to irrigated cropland leads to a decrease of slow components, due to depletion of aquifer discharge by pump-ing. The increased soil moisture during growing season increases subsurface lateral flow and surface runoff during storm events.
The streamflow under agricultural development is shown in Fig. 5 with only land use change (non-irrigation sce-nario) and with both land use change and irrigation (irri-gation scenario). For the non-irri(irri-gation scenario, the mean streamflow is 3.22 and 2.77 m3s−1 during pre-1970s and post-1970s periods, respectively. For the irrigation scenario,
Fig. 6.Baseflow index for non-irrigation and irrigation cases.
the mean streamflow is 3.05 and 1.93 m3s−1 during
pre-1970s and post-pre-1970s periods, respectively. Note that the streamflow from the pre-1970s periods is not significantly different among these scenarios, since large-scale agricul-tural development and groundwater pumping had just started at that time. Comparing the flow pre-1970s under the three scenarios shows that groundwater pumping amounts to a 0.84 m3s−1decrease in streamflow, more than twice as that caused by land use at 0.31 m3s−1.
3.2 Flow component change
The SWAT model simulates three flow components (i.e., baseflow, subsurface flow and overland runoff), which en-able us to decompose the effect of groundwater-fed irriga-tion on streamflow. In Fig. 5, the surface flow, subsurface flow from the soil profile, and baseflow from the aquifer dis-charge are denoted as SUR, SUB and GW, respectively. As mentioned earlier, streamflow is decomposed to a slow com-ponent (corresponding to a sustained baseflow from aquifer) and a fast flow component (corresponding to runoff from surface and unsaturated zone), which has a shorter travel time and is more prone to climate variability. Although the streamflow decreases under both scenarios (land use only, land use and irrigation), the changes on the different flow components are significantly different. In the non-irrigation scenario, all flow components decrease, especially for the subsurface flow, which is nearly zero after the 1970s. For the groundwater-fed irrigation scenario, the decrease is mainly from aquifer discharge (i.e., from 2.56 to 1.41 m3s−1), while
surface flow decreases slightly from 0.177 to 0.154 m3s−1
and subsurface flow increases from 0.311 to 0.362 m3s−1.
Fig. 7. Soil profile percolation for non-irrigation and irrigation cases.
Aquifer discharge provides streams with a stable flow (i.e., slow flow component) and is relatively insensitive to cli-mate variation; while surface and subsurface flow is prone to climate variability (i.e., temperature, and vapor pressure) through soil moisture dynamics, vegetation water use or hu-man water hu-management (Harhu-man et al., 2011). Thus, sur-face and subsursur-face flow convert the climatic variability into streamflow variability and exhibit as fast flow components. The baseflow index (BFI, ratio of baseflow in total stream-flow) is shown in Fig. 6 for irrigation and non-irrigation sce-narios. The BFI decreases from 95 to 75 % due to groundwa-ter pumping and irrigation return flow. As shown in Fig. 6, the baseflow accounts for 70–80 % of the total flow. The baseflow indices calculated from a recursive digital filter (Santhi et al., 2008) and the US Geological Survey 1 km baseflow index data set (Wolock, 2003) show similar values to our results (i.e., between 69 and 76 %).
The effects of stream depletion and irrigation return flow change the ratio of the fast and slow flow components in stream, leading to changes in streamflow variability. The co-efficient of variation (CoV) of streamflow under the irriga-tion case is 0.077 and 0.151 for pre- and post-1970s periods, respectively. In watersheds with intensive agricultural activ-ities streamflow components are affected by crop water con-sumption and water management. Thus besides climatic vari-ability, human interference (irrigation, return flow) is also an important factor to affect the stream variability by changing the dynamics of surface water and groundwater interaction.
3.3 Aquifer recharge–discharge pattern change
Associated with the streamflow changes, the pumping for ir-rigation and return flow also change the temporal pattern of aquifer storage. The increased soil moisture by irrigation ap-plication increases subsurface flow. Meanwhile the increased soil moisture also helps recharge the aquifer through soil
pro-Fig. 8.Monthly aquifer storage change averaged by decades (stor-age change before the 1950s is not simulated in this model and is adapted from the RRCA).
file percolation. Figure 7 shows the soil percolation, which is considerably higher under the irrigation scenario than the non-irrigation one. Especially after 1973, the soil profile per-colation is nearly zero in the non-irrigation case, since soil moisture in a large portion of the watershed is lost to the at-mosphere through crop evapotranspiration. While for the ir-rigated case, irrigation maintains soil moisture and then soil profile percolation over the years.
Fig. 9.Accumulative aquifer storage change.
specific yield in the area is 0.175 (the value used in the RRCA model). Thus the average water table decrease in the FCB is about 31.5 m, which is validated by the area-weighted aver-age from observation wells (McGuire, 2009). Aquifer stor-age depletion started in the 1960s, reached the maximum during the 1970s, and remained stable since then. During the 1980s, the aquifer storage depletion recovers slightly, which corresponds to the irrigation regulation within the re-gion started in the late 1980s. According to the records of the US Geological Survey (USGS), the water table in the aquifer remains in a declining trend but at a slower rate in recent years (McGuire, 2012). The decline of the aquifer storage during the period 2009–2011 is estimated as 2.8 million acre-ft., equivalent to 0.1 ft. decline in the water table. Thus, the intensive pumping reverses the natural seasonal groundwa-ter recharge patgroundwa-tern, from “summer recharge and wingroundwa-ter dis-charge” under natural conditions to “summer discharge and winter recharge” under the human interferences.
4 Conclusions
Streamflow change is a result of climate forcings, catch-ment properties and human activities in watersheds around the world. At the study site discussed in this paper, stream-flow records at the gauging stations reflect the synthetical effect of dynamic interactions between surface water and groundwater systems, which are enhanced by groundwater pumping and return flow with heavy groundwater-fed irri-gation. In this study, a modeling analysis based on a mod-ified SWAT model is applied to analyze the conjunctive ef-fects of pumping and irrigation return flow on streamflow. By relating baseflow to shallow aquifer storage through a lin-ear reservoir model, the streamflow response to groundwa-ter pumping is explicitly simulated, and the synthetic effects of two types of human interferences (i.e., pumping and re-turn flow) are assessed. While irrigation rere-turn flow partially
of the streamflow variability, rooted with climatic variability but aggravated by human interferences (groundwater pump-ing and return flow). Agricultural water use in this region has shifted the groundwater seasonal regime from the pattern of “summer recharge and winter discharge” in the past to “sum-mer discharge and winter recharge” at present. This could affect the ecosystems that depend on the streamflow regime. Moreover the shift challenges existing groundwater model-ing, which usually assumes fixed recharge patterns and rates. Although the modified model can simulate streamflow re-sponse to groundwater pumping, it only represents one way of the stream–aquifer interaction, that is, flow from aquifer to stream. This limits the model to simulate the situation where groundwater pumping inverses stream–aquifer interaction. This model is valid in a headwater zone such as FCB, where baseflow is sustained by the aquifer, but may not be appli-cable to areas where streamflow recharges the aquifer. Also, the SWAT model is semi-distributed, that is, each hydrolog-ical representative unit is only connected with each other by river network and no interaction exists due to the water table gradient. Thus, the assessment of aquifer storage is averaged from all subbasins. Improvement of the subbasin aquifer stor-age connection would provide the spatial impact of ground-water movement. If spatial information (e.g., impact of the location of pumping wells relative to streams, the location of drawdown cones, etc.) is included, the groundwater move-ment under human interferences can be better understood.
activities. Indeed the model results provide some insights on the impact of irrigation on streamflow through a highly non-linear process. From a modeler’s perspective, both the im-provement and the limitation of this model provide experi-ences for further development of an integrated surface water– groundwater model.
Acknowledgements. This study was financially supported by the US National Science Foundation grants CMMI 0825654 and CBET-0727476. The authors thank the three anonymous reviewers for their comments and suggestions, which helped to improve this paper.
Edited by: D. Gerten
References
Adegoke, J. O., Pielke, R. A., Eastman, J., Mahmood, R., and Hubbard, K. G.: Impact of Irrigation on Midsummer Sur-face Fluxes and Temperature under Dry Synoptic Condi-tions: A Regional Atmospheric Model Study of the U.S. High Plains, Mon. Weather Rev., 131, 556–564, doi:10.1175/1520-0493(2003)131<0556:IOIOMS>2.0.CO;2, 2003.
Alley, W. M., Healy, R. W., LaBaugh, J. W., and Reilly, T. E.: Flow and storage in groundwater systems, Science, 296, 1985–1990, 2002.
Arnold, J. G., Srinivasan, R., Muttiah, R. S., and Williams, J.: Large area hydrologic modeling and assessment part I: Model develop-ment1, JAWRA J. Am. Water Resour. Assoc., 34, 73–89, 1998. Burt, O. R., Baker, M., and Helmers, G. A.: Statistical estimation of
streamflow depletion from irrigation wells, Water Resour. Res., 38, 1296, doi:10.1029/2001wr000961, 2002.
Chow, V. T., Maidment, D. R., and Mays, L. W.: Applied hydrology, Mc-Graw Hill, New York, 1988.
DeAngelis, A., Dominguez, F., Fan, Y., Robock, A., Kustu, M. D., and Robinson, D.: Evidence of enhanced precipitation due to ir-rigation over the Great Plains of the United States, J. Geophys. Res.-Atmos., 115, D15115, doi:10.1029/2010JD013892, 2010. Ferguson, I. M. and Maxwell, R. M.: Hydrologic and land–energy
feedbacks of agricultural water management practices, Environ. Res. Lett., 6, 014006, doi:10.1088/1748-9326/6/1/014006, 2011. Ferguson, I. M. and Maxwell, R. M.: Human impacts on terrestrial hydrology: climate change versus pumping and irrigation, Env-iron. Res. Lett., 7, 044022, doi:10.1088/1748-9326/7/4/044022, 2012.
Gassman, P. W., Reyes, M. R., Green, C. H., and Arnold, J. G.: The Soil and Water Assessment Tool: Historical development, applications, and future research directions, Trans. ASABE, 50, 1211–1250, 2007.
Gleeson, T., Alley, W. M., Allen, D. M., Sophocleous, M. A., Zhou, Y., Taniguchi, M., and VanderSteen, J.: Towards Sus-tainable Groundwater Use: Setting Long-Term Goals, Back-casting, and Managing Adaptively, Ground Water, 50, 19–26, doi:10.1111/j.1745-6584.2011.00825.x, 2012.
Gosain, A. K., Rao, S., Srinivasan, R., and Reddy, N. G.: Return-flow assessment for irrigation command in the Palleru river basin using SWAT model, Hydrol. Process., 19, 673–682, doi:10.1002/hyp.5622, 2005.
Gutentag, E. D.: Geohydrology of the High Plains aquifer in parts of Colorado, Kansas, Nebraska, New Mexico, Oklahoma, South Dakota, Texas, and Wyoming, Geological Survey professional paper, 1400-B, 1984.
Harman, C. J., Troch, P. A., and Sivapalan, M.: Functional model of water balance variability at the catchment scale: 2. Elasticity of fast and slow runoff components to precipitation change in the continental United States, Water Resour. Res., 47, W02523, doi:10.1029/2010WR009656, 2011.
HPRCC: Historical climate data summaries, Univ. of Nebraska-Lincoln, Nebraska-Lincoln, NE, available at: http://www.hprcc.unl.edu/ data/historical/ (last access: 27 May 2010), 2010.
Jenkins, C.: Techniques for Computing Rate and Volume of Stream Depletion by Wellsa, Ground Water, 6, 37–46, 1968.
Kendy, E. and Bredehoeft, J. D.: Transient effects of groundwa-ter pumping and surface-wagroundwa-ter-irrigation returns on streamflow, Water Resour. Res., 42, W08415, doi:10.1029/2005wr004792, 2006.
Kenny, J. F., Barber, N. L., Hutson, S. S., Linsey, K. S., Lovelace, J. K., and Maupin, M. A.: Estimated use of water in the United States in 2005, available at: http://pubs.usgs.gov/circ/1344/pdf/ c1344.pdf, Circular 1344, US Geological Survey, Reston, VA, 2009.
Konikow, L. F.: Contribution of global groundwater depletion since 1900 to sea-level rise, Geophys. Res. Lett., 38, L17401, doi:10.1029/2011GL048604, 2011.
Malcolm, I. A., Soulsby, C., Hannah, D. M., Bacon, P. J., Youngson, A. F., and Tetzlaff, D.: The influence of riparian woodland on stream temperatures: implications for the perfor-mance of juvenile salmonids, Hydrol. Process., 22, 968–979, doi:10.1002/hyp.6996, 2008.
McGuire, V. L.: Water-level changes in the High Plains aquifer, pre-development to 2007, 2005-06, and 2006-07, US Geological Sur-vey Scientific Investigations Report, 2009–5019, p. 9, available at: http://pubs.usgs.gov/sir/2009/5019/, 2009.
McGuire, V. L.: Changes in Water Levels and Storage in the High Plains Aquifer, Predevelopment to 2009, US Geological Survey Fact Sheet, 2011–3069, p. 2, available at: http://pubs.usgs.gov/ preview/fs/2011/3069/, 2011.
McGuire, V.: Water-Level and Storage Changes in the High Plains Aquifer, Predevelopment to 2011 and 2009–11, US Geological Survey Scientific Investigations Report, 2012–5291, p. 15, avail-able at: http://pubs.usgs.gov/sir/2012/5291/, 2012.
Miller, J. A., Appel, C. L., Ulibarri, L. J., Dunagan, D. L., and Latzke, G. D.: Ground Water Atlas of the United States: Kansas, Missouri and Nebraska, Segment 3 Hydrol. Atlas 730-D, 24 pp., US Geological Survey, Reston, Va., 1997.
Rodriguez-Iturbe, I., Porporato, A., Ridolfi, L., Isham, V., and Coxi, D. R.: Probabilistic modelling of water balance at a point: the role of climate, soil and vegetation, Proc. Roy. Soc. London A, 455, 3789–3805, doi:10.1098/rspa.1999.0477, 1999.
Santhi, C., Allen, P. M., Muttiah, R. S., Arnold, J. G., and Tuppad, P.: Regional estimation of base flow for the conterminous United States by hydrologic landscape regions, J. Hydrol., 351, 139– 153, doi:10.1016/j.jhydrol.2007.12.018, 2008.
J. Hydrol., 236, 185–201, doi:10.1016/S0022-1694(00)00293-6, 2000.
Swinehart, J. B. and Richmond, G. M.: Quaternary geologic map of the Platte River 4 X 6 Quadrangle, United States, US Geo-logical Survey Misc. Invest. Series Map I-1420 (NK-14), scale 1 : 1 000 000, 1994.
Szilagyi, J.: Identifying Cause of Declining Flows in the Repub-lican River, J. Water Resour. Plann. Manage., 127, 244–253, doi:10.1061/(ASCE)0733-9496(2001)127:4(244), 2001.
Wolock, D. M.: Base-flow index grid for the conterminous United States, US Geological Survey Open-File Report 03–263, digi-tal data set, available at: http://water.usgs.gov/lookup/getspatial? bfi48grd, 2003.