Article
Printed in Brazil - ©2015 Sociedade Brasileira de Química0103 - 5053 $6.00+0.00
A
*e-mail: [email protected]
Intercalated 4-Aminobenzenethiol between Au and Ag Nanoparticles: Effects of
Concentration and Nanoparticles Neighborhood on its SERS Response
Elias de Barros Santos,a Fernando Aparecido Sigolib and Italo Odone Mazali*,b
aInstituto de Ciência e Tecnologia da UNIFESP, 12231-280 São José dos Campos-SP, Brazil
bInstituto de Química, Universidade Estadual de Campinas, CP 6154, 13083-970 Campinas-SP, Brazil
In this work is reported the investigation of the 4-aminobenzenethiol (4-ABT) surface-enhanced Raman scattering (SERS) response for different 4-ABT concentrations as well as when this molecule is intercalated between Ag and Au nanoparticles (AgNP and AuNP). SERS substrates consisting of the individual AgNP or AuNP and bi-layer AgNP/4-ABT/AuNP or AuNP/4-ABT/AgNP were prepared on glass slides. It was observed a decreasing trend of the bands intensity ratios b2/a1 as a function of the 4-ABT solutions concentration. Since the b2 modes are enhanced through the charge transfer (CT) mechanism, this result indicates that this mechanism is less effective for low concentration of 4-ABT. Also, a dependence between a1 and b2-type bands intensities could be identified for the samples where 4-ABT molecules were intercalated between AgNP and AuNP. A significantly increase in the SERS intensities of the a1 mode around 1074 cm-1 and b
2 mode around 1142 cm-1 is observed when AgNP are present in the samples. This result indicates that AgNP promote amplifications of the Raman signal thorough the CT and electromagnetic (EM) mechanisms, whereas for the AuNP the SERS effect is related manly to EM mechanism. These results show that the 4-ABT SERS response can provide more information than the SERS substrate activity. Its SERS signal pattern is rich in information, allowing investigations about the local where the molecule is, details about the substrate surface, and also on the mechanisms present in the system under study.
Keywords: Ag and Au nanoparticles, 4-ABT, Raman/SERS, a1 and b2 modes
Introduction
Surface-enhanced Raman scattering (SERS) is the amplification of the Raman scattering signals from molecules adsorbed and/or very close to vicinity of the metallic nanostructures surface such as silver, gold,
and copper.1,2 The nature of the Raman enhancement is
caused by two contributing mechanisms.2,3 First, is the
electromagnetic mechanism (EM), that is a consequence of the interaction of the electric field (from the incident radiation) with the electrons in the metal surface, leading the excitation of surface plasmon resonance (SPR). Unlike, the chemical enhancement is due to the interaction among the adsorbed molecules and the metal substrate during the incident radiation. In that condition, a charge transfer (CT) from the metal to the molecule adsorbed on the substrate can occur. The investigation of the mechanisms involved in the SERS effect can be performed by monitoring the Raman spectra of molecules adsorbed on metallic nanostructures which exhibit SPR.
4-Aminobenzenethiol (4-ABT) is an ideal probe molecule for SERS study equal to rhodamine 6G and pyridine. It can be strongly adsorbed onto most SERS substrates and can produce a very strong Raman signal, which is very sensitive to the substrate material. Also, the 4-ABT SERS spectral feature is dependent on
the measurement conditions.4-7 However, there is still
uncertainty and a disagreement about the correct attribution
of the b2-type bands observed in the SERS spectra of that
molecule. One side support that the b2 modes are originated
due to charge transfer mechanism from the metal to the
4-ABT molecules adsorbed on the SERS substrate.8-11
Others, support the idea that 4-ABT can be oxidatively transformed into 4,4’-dimercaptoazobenzene (DMAB),
which gives a SERS spectra of so-called b2 modes.12-15
The beginning of that debate can be dated back to the
first article published by Osawa et al.,8 where they showed
a SERS study of 4-ABT adsorbed on silver electrode. They
found that the appearance of strong lines of b2 symmetry
is due to intensity, borrowing from an intense π → π*
molecular transition (1A
1 → 1B2) at 300 nm. Also, they
assigned to the vibrational modes with a1symmetry, mainly
1077 and 1590 cm-1. Another is assigned to the vibrational
modes with b2 symmetry, including the bands at ca. 1142,
1391, 1440, and 1573 cm-1. Following this pioneering work,
many studies of SERS on 4-ABT have been reported, but many of them simply citing the conclusion of Osawa’s
work.16-19 Recently, Tian and co-workers20-22 have been
performed studies of SERS on 4-ABT and they have arrived at a different explanation for the appearance of
b2modes. Those works strongly support the other side of
the debate. They have been demonstrated experimental and theoretical evidence that it is DMAB which contributes to the characteristic SERS behavior in the SERS spectra
of 4-ABT. They believe that the origin of the b2 modes in
the 4-ABT SERS spectra is due to dimer formation on the SERS substrates surface. Although the Tian’s works are conclusive and convincing, giving an end to the current debate, other authors have shown that such transformation is strongly dependent on laser power and on characteristics
of the SERS substrate.23,24 For example, Delafosse et al.23
investigated the influence of the laser power on 4-ABT SERS spectrum, observing evidences of dimer formation for a laser power above 150 µW. In the same work, they also observed a dependence on time of laser illumination.
In this context, the debate about the real origin of the
b2 modes observed in the 4-ABT SERS spectra is still
happening, and also it is an open area to be explored. Several studies have been performed in different systems once the 4-ABT SERS spectra profile is dependent on the
experimental conditions.24-27 In this work, was performed
a study of the effect of the 4-ABT concentration on
its SERS response in a range of 10-4-10-8 mol L-1. This
experimental parameter has not yet been investigated. Also, we have investigated the effect of Ag or Au nanoparticles neighborhood on 4-ABT SERS response when this molecules is intercalated into AgNP and AuNP. For this purpose, Au nanoparticles were synthesized using chitosan as reductant and capping agent and Ag nanoparticles were synthesized by the sodium citrate method. Raman measurements of 4-ABT on metal nanoparticles and of intercalated 4-ABT between Au and Ag nanoparticles were recorded using an He-Ne laser (633 nm).
Experimental
Chemicals
Chitosan powder sample (high molecular weight, 78% deacetylated) was acquired for free from C.E. Roeper (Hamburg, Germany). Tetrachloroauric(III) acid, silver nitrate, trisodium citrate,
3-mercaptopropyl-trimetoxisilane (MPTMS), 3-aminopropyl-3-mercaptopropyl-trimetoxisilane (APTMS), and 4-aminobenzenethiol were purchased from Sigma-Aldrich (St. Louis, USA). All chemicals were used without further purification. All glassware were cleaned with piranha solution (4:1 sulphuric acid:hydrogen peroxide) before using and then rinsed thoroughly with deionized water.
Gold and silver nanoparticles (AuNP and AgNP) synthesis
AuNP was prepared following the procedure reported
elsewhere with some modifications.28 Briefly, a solution of
chitosan 1 mg mL-1 was prepared by dissolving the polymer
in acid acetic solution (pH 2.5). Due to the low solubility of chitosan, the mixture was kept under stirring for 8 h to obtain a clear solution. A mixture of 6 mL solution of
10-3 mol L-1 tetrachloroauric(III) acid and 36 mL solution
of 1 mg mL-1 chitosan was prepared. The AuNP synthesis
was carried out under stirring at 100 oC for 10 min.
AgNP were prepared following the procedure reported elsewhere.29 Briefly, 250 mL of 10-3 mol L-1 AgNO
3 solution
were heated to approximately 90 oC under vigorous stirring.
Then, 10 mL of 1% sodium citrate solution were quickly
added into the solution. The mixture was kept at 90 oC with
stirring during 1 h. After that, the solution was cooled down
to room temperature (about 25 oC) under stirring.
AuNPs and AgNPs substrates preparation
Microscope regular glass slides were cut in 1.2 cm × 1.2 cm small slides, cleaned, and their surfaces were modified with MPTMS and APTMS following
procedures reported elsewhere.28,29 The AuNP substrates
were prepared by soaking the thiol groups modified glass slides into the AuNP colloidal solution for 1 h. Some AuNP
substrates were soaked into 10-3 mol L-1 4-ABT for 10 min.
Then, the substrates were washed with deionized water and
dried with N2 flow. After that, the AuNPs/4-ABT substrates
were soaked into the AgNP colloidal solution for 1 h, and subsequently washed with deionized water and dried
with N2 flow, resulting in sample AuNP/4-ABT/AgNP.
This procedure was repeated changing the order of the metal nanoparticles deposition, resulting in the sample AgNP/4-ABT/AuNP.
Ultraviolet-visible (UV-Vis) measurements
Electron microscopy
High resolution transmission electron microscopy (HRTEM) images were obtained using a JEOL JEM-3010 microscope (300 kV, 1.7 Å point resolution) (Akishima, Japan). The samples were prepared by drop-drying the AuNP or AgNP colloidal solution on a holey carbon coated copper grid.
The scanning electron microscopy (SEM) images were obtained using a FEG, field emission gun microscope model Inspect (Hillsboro, USA), with acceleration voltage of 15 kV. Also, an energy-dispersive X-ray spectroscopy (EDS) elemental analysis was carried out. The samples were covered with a carbon thin film before analysis.
SERS measurements
SERS spectra were acquired using a confocal Jobin-Yvon T64000 Raman spectrometer system (Kyoto, Japan),
equipped with a liquid N2 cooled CCD detector. The
excitation source was a laser at 633 nm. The laser power at the sample surface was about 7.2 mW. The laser was focused with a 100× focal-lens objective to a spot of about 1 µm. For all measurements, the laser exposure time was 10 s with two accumulation. 49 spectra were collected in the
Raman mapping measurements in an area of 60 µm2 on each
substrate surface, using 10 µm of step. 4-ABT compound was dissolved in ethanol to a 10-2 mol L-1 concentration. This
solution was used to prepare six new solutions: from 10-3 to
10-8 mol L-1, where an appropriate amount of 10-2 mol L-1
4-ABT solution was diluted in deionized water. Then, an aliquot of 50 µL of each solution was dropped onto the 1.2 cm × 1.2 cm AuNPs substrate. The films were dried in air atmosphere. After that, the samples were ready to be analyzed.
Results and Discussion
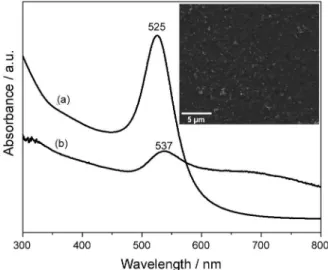
Figure 1a shows the UV-Vis absorption spectrum of the AuNP colloidal solution, where can be observed the localized surface plasmon band (LSPR) at 525 nm, which is a standard optical signature for the formation of AuNP
spheres in solution.30 A distinct band is observed for the
AuNP substrate at 537 nm, indicating a red shift of 12 nm in the LSPR band (Figure 1b). This red shift is caused due to the increase of refractive index of the media surrounding
metallic nanoparticles.31 Also, a little shoulder at about
660 nm is observed in the AuNP substrate UV-Vis spectrum (Figure 1b), that can be associated with the formation of AuNP aggregates during the substrate preparation as shown in the SEM image (Figure 1, inset). As can be seen
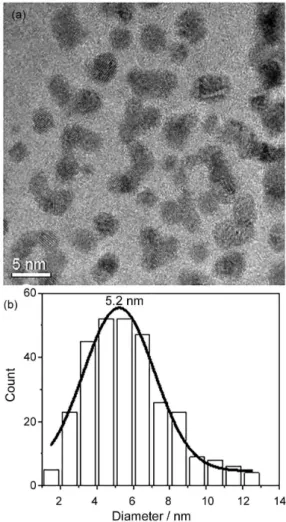
in the high-resolution transmission electron microscopy (HRTEM) image in Figure 2, the AuNP are immersed into the chitosan structure forming a composite. Measuring the AuNP diameter, in different HRTEM images, is obtained an average size distribution of 5.2 nm (Figure 2b). The size distribution (1.5-12.5 nm) indicates that chitosan plays an important role of controlling the AuNP size.
As can be seen in Figure 3, the SERS spectrum of 4-ABT exhibits a different spectral pattern comparing with its own normal Raman spectrum. The band assigned to the vibrational mode with a1 symmetry (ʋCS + ʋCC, 7a) is shifted
from 1088 cm-1 (normal Raman spectrum) to 1078 cm-1 (in
SERS condition). This shift indicates that 4-ABT molecules
are adsorbed on AuNP surface as thiolate after the S−H
bond disruption. Also, the band at 1181 cm-1 is assigned to
the a1 symmetry (δCH,9a), and its intensity is the weakest.
The broad band around 1580 cm-1 is formed by two modes
assigned to ʋCC,8a and 8b(a1 symmetry at 1582 cm-1 and
b2 symmetry at 1570 cm-1). The others bands assigned to
ʋCC + δCH 19b (1432 cm-1), δCH + ʋCC3 (1389 cm-1), and
δCH9b (1139 cm-1) are modes with b2 symmetry.15,32 The most
interesting about the 4-ABT Raman spectrum is that the b2
modes are observed only in SERS condition (Figure 3). In
the normal Raman spectrum of the 4-ABT (10-2 mol L-1)
only the modes with a1 symmetry is observed at 1088 cm-1
and 1594 cm-1. As mentioned in the Introduction, the origin
of b2-type bands in the 4-ABT SERS spectrum has been the
focus of many works,33-35 and this will be discussed below.
We investigated the SERS response of 4-ABT adsorbed on AuNP substrate after drop-drying aliquots of 4-ABT solutions prepared with different concentrations. For the first three 4-ABT concentrations (10-4, 10-5, and 10-6 mol L-1)
all a1 and b2 modes described above could be identified in the
SERS spectra in Figure 4. However, for the concentration
of 10-7 mol L-1 only the bands at 1582, 1139, and 1078 cm-1
could be observed, appearing very weak in the SERS spectrum for 4-ABT 10-8 mol L-1. In general, the intensities
of the a1-and b2-type bands are sensitive to the variation of
the 4-ABT concentration, and that effect is more evident on
the b2 modes (Figure 4). For the laser power of 7.2 mW used
in our Raman measurements is expected the transformation
of 4-ABT to DMAB as have been reported.20-23 However,
this dimerization is not observed with low concentration of 4-ABT as this reaction cannot occur if 4-ABT molecules are too far on from the other in diluted solutions. The
concentration effect on the a1 and b2-type bands could be
confirmed in a more detailed analysis mapping areas on AuNP substrates. Representatives SERS spectra for the five different concentrations of 4-ABT are shown in Figure S1 (Supplementary Information), where can be seen the strong effect of the concentration on a1 and b2-type bands. Even for
the best SERS spectra in the Raman mapping the intensities
of the a1 and b2-type bands decrease for diluted solutions.
This result shows that there is a strong dependence between
the SERS signal of the a1 and b2-type bands and the 4-ABT
concentration. To more diluted solutions the 4-ABT SERS pattern looks very similar to the normal 4-ABT Raman spectrum showed in Figure 3.
Up to now, it can be concluded that the 4-ABT
concentration effect is more evident for the b2 modes and the
behavior of the band at 1139 cm-1 illustrates well this effect.
The band at 1139 cm-1 was observed in all 4-ABT SERS
spectra for the concentrations of 10-4, 10-5, and 10-6 mol L-1
(red areas in the Raman maps, R is a representative spectrum (Figure S1 of the Supplementary Information)). However, decreasing the 4-ABT concentration the Raman
signal of the b2 mode becomes increasingly rare, and it
was observed only in few SERS spectrum for the more diluted solution.
As have been reported,36-38 the 4-ABT vibrational
modes with a1 symmetry are enhanced through the EM
effect, whereas the vibrational modes with b2 symmetry
are enhanced through the CT effect.36-38 As an example,
Figure 2. HRTEM image showing the AuNP into the chitosan structure (a) and the histogram of the AuNP size distribution (b).
Figure 3. Raman spectrum of 10-2 mol L-1 4-ABT onto a glass slide
without AuNP (a) and SERS spectrum of 10-6 mol L-1 4-ABT onto AuNP
substrate (b).
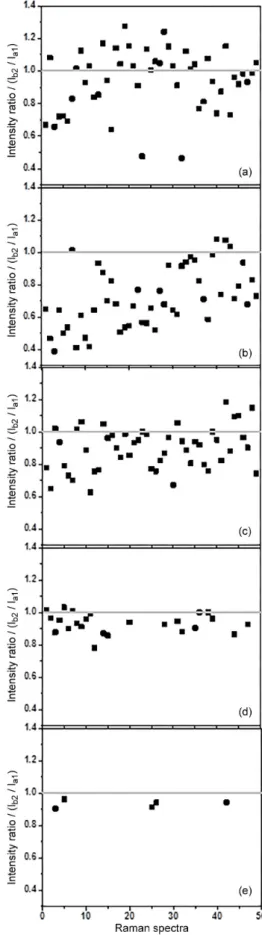
calculating the intensity ratio between the modes b2 (at
1139 cm-1) and a
1 (at 1078 cm-1) for all SERS spectra in
the Raman maps, it is possible to demonstrate the presence and contribution of each effect. These values are drastically affected by the concentration of 4-ABT solution, as shown in Figure 5. For more concentrate solution the intensity ratio values are homogenously distributed around 1 (Figure 5a). However, for the more diluted solutions there is a decreasing trend of the intensity ratios below 1. This result indicates that the observation of CT effect is dependent on 4-ABT concentration, and consequently, shows the importance of the EM effect in SERS. For the most diluted solution, the
modes b2 and a1 are observed only in five Raman spectra
(Figure 5e), and its intensity ratio are below 1, indicating a weak contribution of the CT mechanism and low intensity
of the band at 1139 cm-1.
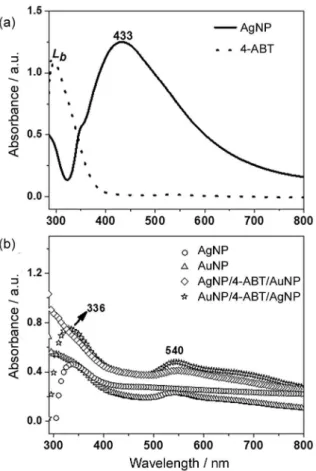
Intercalating 4-ABT molecules between AgNP and AuNP aggregates provides a practical way to distinguish between the modes that are dominantly enhanced by either EM or CT mechanism. Also, the contribution of the metallic nanoparticles neighborhood can be explored. For this purpose, we have conduced one controlled experiment where the 4-ABT molecule were intercalated between gold and silver nanoparticles aggregates. The average size of the AgNP employed in this study is ca. 48 nm as shown in Figure S2 of the Supplementary Information, and they are deposited on glass slides forming aggregates, which is very important in SERS. Figure 6a shows the UV-Vis absorption spectrum of the AgNP colloidal solution, where can be observed the typical LSPR band, with maximum at 433 nm, for spherical AgNP. As can be seen in Figure 6a,
in the absorption spectrum of 10-3 mol L-1 4-ABT is
observed only the band at 299 nm assigned to Lb in Platt’s
notation.39,40 In the UV-Vis absorption spectrum of the
AgNP substrate (Figure 6b) is observed only one band at 336 nm. The AgNP LSPR band is not observed for this substrate, suggesting that the amount of silver nanoparticles in the sample was not enough to be detected by UV-Vis. Since the AuNP colloid shows absorption in the UV-Vis range, the band at 336 nm may also be a contribution from AuNP colloid. Unlike, in the UV-Vis absorption spectrum of the AuNP substrate the LSPR band is observed at 540 nm, even when AuNP are deposited on AgNP (substrate AgNP/4-ABT/AuNP). Other interesting observation is that the gold plasmon band is not suppressed when AgNP are deposited on AuNP (substrate AuNP/4-ABT/AgNP) as shown in Figure 6b.
Points-scan energy dispersive X-ray spectroscopy (EDS) was carried out onto the nanoparticles aggregates on substrates surface. For the AgNP substrate the Ag weight percentage is around 25%, and for the substrate
Figure 5. SERS intensity ratio between the modes b2 and a1 for all 4-ABT
(10-4-10-8 mol L-1) SERS spectra in the Raman mapping onto AuNP
AgNP/4-ABT/AuNP one Ag/Au ratio ca. 1 could be obtained (Figure S3 of the Supplementary Information). For the AuNP substrate the Au weight percentage is around 8%. However, for the substrate AuNP/4-ABT/AgNP the metal weight percentage is 23% for AgNP and 13% for AuNP, resulting in a Ag/Au ratio ca. 1.77 (Figure 3d of the Supplementary Information). Although the presence of AgNP was not detected by UV-Vis analysis, it was detected by EDS. Also, the EDS analyses confirm the presence of both metal on the aggregates structures.
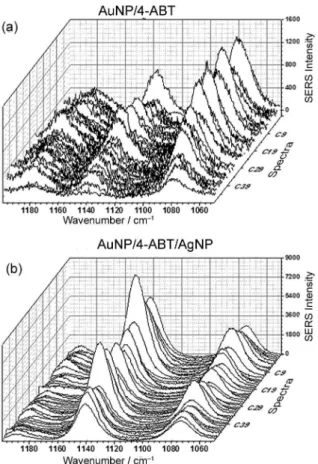
The spectral range of 1200-1050 cm-1 was chosen to
observe the behavior of the a1 and b2-type bands located
around 1074 and 1142 cm-1, respectively, for the samples
where 4-ABT molecules are intercalated between AgNP and AuNP. Raman mapping was performed in a region where is possible to focus on nanoparticles aggregates structure, obtaining 49 Raman spectra for an area of 30 µm × 30 µm. For the AgNP substrate all Raman spectra recorded show the same spectral pattern related to those bands observed and the respective position of them
(Figure 7a). In general, the SERS intensity of the b2 band
is higher than the SERS intensity of the a1 band, showing
that the SERS effect is more intense for the b2 band located
around 1142 cm-1. The same behavior is observed for
the substrate AgNP/4-ABT/AuNP, indicating that there
is no significant influence of the AuNP layer on the b2
band SERS intensity (Figure 7b). Unlike, for the AuNP
substrate the SERS intensities of the a1 band is higher than
the SERS intensities of the b2 band, indicating that when
4-ABT molecules are attached on AuNP the SERS effect is
more intense on the a1 band (Figure 8a). However, for the
substrate AuNP/4-ABT/AgNP the SERS effect is opposite of the AuNP substrate; there is an inversion in the SERS
intensities between the a1 and b2 bands (Figure 8b). These
results indicate that the AgNP layer exerts strong influence
on SERS intensity of the b2 band than the AuNP. The
large intensity effect of AgNP neighborhood on b2 band
is a strong evidence of the presence of CT mechanism, as
reported by Uetsuki et al.,24 which is operating together
with the EM mechanism.
For a better understanding the changes in the a1 and
b2 bands intensity as a function of the presence of AgNP
and/or AuNP, the intensity ratios between the modes b2
at 1142 cm-1 (enhanced through CT mechanism) and a
1
at 1074 cm-1 (enhanced through EM mechanism) were
calculated and are plotted in Figure 9. Figure 6. UV-visible absorption spectrum of (a) AgNP colloidal solution
and 10-3 mol L-1 4-ABT solution, and of the (b) AgNP and AuNP substrates.
Among 49 SERS spectra collected for the AgNP substrate 48 SERS intensity ratio are above 1. However, for the sample AgNP/4-ABT/AuNP is observed a decrease of intensity ration, resulting in intensity ratio values around 1, as can be observed in Figure 9. This result indicates that the presence of AuNP creates large localized electromagnetic field between the nanoparticles aggregates, where the 4-ABT
molecules are intercalated. Consequently, the EM effect is resulted of the contribution of both Ag and Au nanoparticles,
increasing the intensity of the a1 mode at 1074 cm-1. Also,
this result suggests that AuNP layer does not contribute to CT mechanism or this contribution should be very low. This conclusion appears to be true after the analysis of the intensity ratio for the AuNP substrate. As can be observed in Figure 9, all intensity ratio values for this substrate are below 1, showing the dominant effect of the EM mechanism. The CT effect is favored after adding AgNP on AuNP/4-ABT.
In other words, for the sample AuNP/4-ABT/AgNP the b2/a1
intensity ratios are above 1, indicating a strong contribution of the AgNP for the CT mechanism. As already know in SERS literature, the CE mechanism is much less intense than EM mechanism, and both are dependent on nanoparticles
size.41,42 Since the as-prepared AuNP are smaller than the
as-prepared AgNP, this explain the lowest contribution of the AuNP to CT mechanism when comparing with the contribution of the AgNP.
Conclusions
This work has provided two practical experiments for studying the effects of 4-ABT concentration and Ag or Au nanoparticles neighborhood on 4-ABT SERS response. One experiment consists of varying the 4-ABT solution concentration which is dropped on AuNP substrates, where was observed a trend between the 4-ABT concentration
and the intensities of the b2-type bands. Varying the 4-ABT
solution concentration from 10-4 to 10-8 mol L-1 leads to
a progressive decrease of the b2-type bands intensities,
showing a direct dependence of the quantity of 4-ABT molecules on CT mechanism. The dilution effect is less
evident on a1 modes, which are enhanced through the EM
mechanism. Another experiment consists of introducing 4-ABT molecules between AgNP and AuNP, where was possible to investigate the effect of the nanoparticles
neighborhood on a1 and b2-type bands intensities. The a1
mode located around 1074 cm-1 and the b
2 mode located
around 1142 cm-1 are strongly enhanced in the presence
of AgNP than in the presence of AuNP, which can be associated with the CT and EM mechanisms. However, in the intercalated samples the contribution of AuNP for CT mechanisms is very low or does not exist, observing
only a gain of intensity of the mode a1, which is enhanced
by the EM effect.
Supplementary Information
Supplementary information is available free of charge at http://jbcs.sbq.org.br as PDF file.
Figure 8. SERS spectra of the (a) AuNP/4-ABT substrate and of the (b) AuNP/4-ABT/AgNP substrate.
Figure 9. SERS intensity ratio between the modes b2 and a1 for the
Acknowledgments
The authors would like to thank the FAPESP, CAPES and CNPq for financial supports and FAPESP for a post-doc fellowship. Contributions from Multiuser Laboratory of Advanced Optical Spectroscopy (LMEOA/IQ/UNICAMP) for the Raman analysis and Brazilian Nanotechnology National Laboratory (LNNano, Campinas-SP, Brazil) for SEM and HRTEM analysis are also grateful. This is a contribution of the National Institute of Science and Technology in Complex Functional Materials (CNPq-MCT/FAPESP).
References
1. Jeanmaire, D. L.; Van Duyne, R. P.; J. Electroanal. Chem.1977,
84, 1.
2. Etchegoin, P. G.; Maher, R. C.; Cohen, L. F.; New J. Phys.2004,
6, 142.
3. Le Ru, E. C.; Etchegoin, P. G.; Principles of Surface-Enhanced Raman Spectroscopy, Elsevier: Oxford, 2009, vol. 1. 4. Wang, L.; Sun, Y.; Che, G.; Li, Z.; Appl. Surf. Sci.2011, 257,
7150.
5. Santos, E. B.; Sigoli, F. A.; Mazali, I. O.; Mater. Lett.2013,
108, 172.
6. Kim, K.; Choi, J-Y.; Lee, H. B.; Shin, K. S.; J. Chem. Phys.
2011, 135, 124705.
7. Yang, L.; Ruan, W.; Jiang, X.; Zhao, B.; Xu, W.; Lombardi, J. R.; J. Phys. Chem. C 2009, 113, 117.
8. Osawa, M.; Matsuda, N.; Yoshii, K.; Uchida, I.; J. Phys. Chem.
1994, 98, 12702.
9. Zheng, J.; Zhou, Y.; Li, X.; Ji, Y.; Lu, T.; Gu, R.; Langmuir
2003, 19, 632.
10. Moskovits, M.; Suh, J. S.; J. Phys. Chem.1984, 88, 5526.
11. Yang, L.; Jiang, X.; Ruan, W.; Zhao, B.; Xu, W.; Lombardi, J. R.; J. Phys. Chem. C2008, 112, 20095.
12. Lukkari, K.; Kleemola, K; Meretoja, M.; Ollonqvist, T.; Kankare, J.; Langmuir1998, 14, 1705.
13. Tian, X.; Chen, L.; Xu, H.; Sun, M.; RSC Adv.2012, 2, 8289. 14. Dendisova, M.; Havranek, L.; Oncak, M.; Matejka, P.; J. Phys.
Chem. C2013, 17, 21245.
15. Kim, K.; Kim, K. L.; Shin, D.; Choi, J-Y.; Shin, K. S.; J. Phys. Chem. C2012, 116, 4774.
16. Lombardi, J. R.; Birke, R. L.; J. Phys. Chem. C2008, 112, 5605.
17. Cao, L.; Diao, P.; Tong, L.; Zhu, T.; Liu, Z.; ChemPhysChem
2005, 6, 913.
18. Sun, M. T.; Xu, H. X.; ChemPhysChem2009, 10, 392. 19. Ikeda, K.; Suzuki, S.; Uosaki, K.; Nano Lett.2011, 11, 1716.
20. Huang, Y-F.; Wu, D-Y.; Zhu, H-P.; Zhao, L-B.; Liu, G-K.; Ren, B.; Tian, Z-Q.; Phys. Chem. Chem. Phys.2012, 14, 8485.
21. Zhao, L-B.; Huang, R.; Huang, Y-F.; Wu, D-Y.; Ren, B.; Tian, Z-Q.; J. Chem. Phys.2011, 135, 134707.
22. Huang, Y-F.; Zhang, M.; Zhao, L-B.; Feng, J-M.; Wu, D-Y.; Ren, B.; Tian, Z-Q.; Angew. Chem., Int. Ed. 2014, 53, 2353.
23. Delafosse, G.; Merlen, A.; Clair, S.; Patrone, L.; J. Chem. Phys.
2012, 136, 194704.
24. Uetsuki, K.; Verma, P.; Yano, T.; Saito, Y.; Ichimura, T.; Kawata, S.; J. Phys. Chem. C2010, 114, 7515.
25. Futamata, M.; Maruyama, Y.; Anal. Bioanal. Chem.2007, 388, 89.
26. Palonpon, A.; Ichimura, T.; Verma, P.; Inouye, Y.; Kawata, S.;
Appl. Phys. Express2008, 1, 092401.
27. Palonpon, A.; Ichimura, T.; Verma, P.; Inouye, Y.; Kawata, S.;
J. Raman Spectrosc.2009, 40, 119.
28. Santos, E. B.; Lima, E. C. N. L.; Oliveira, C. S.; Sigoli, F. A.; Mazali, I. O.; Anal. Methods2014, 6, 3564.
29. Santos, E. B.; Sigoli, F. A.; Mazali, I. O.; Vib. Spectrosc.2013,
68, 246.
30. Li, C.; Li, D.; Wan, G.; Xu, J.; Hou, W.; Nanoscale Res. Lett.
2011, 6, 440.
31. Wang, Y. Q.; Liang, W. S.; Geng, C. Y.; Nanoscale Res. Lett.
2009, 4, 684.
32. Wang, Y.; Ji, W.; Yu, Z.; Li, R.; Wang, X.; Song, W.; Ruan, W.; Zhao, B.; Ozaki, Y.; Phys. Chem. Chem. Phys.2014, 16, 3153.
33. Kim, K.; Yoon, J. K.; Lee, H. B.; Shin, D.; Shin, K. S.; Langmuir
2011, 27, 4526.
34. Fang, Y.; Li, Y.; Xu, H. X.; Sun, M. T.; Langmuir2010, 26, 7737.
35. Wang, Y.; Chem, H.; Dong, S.; Wang, E.; J. Chem. Phys.2006,
124, 074709.
36. Huang, Y. F.; Zhu, H. P.; Liu, G. K.; Wu, D. Y.; Ren, B.; Tian, Z. Q.; J. Am. Chem. Soc.2010, 132, 9244.
37. Kim, K.; Kim, K. L.; Shin, K. S.; Phys. Chem. Chem. Phys.
2013, 15, 9288.
38. Otto, A.; J. Raman Spectrosc.2005, 36, 497.
39. Howeler, U.; Chatterjee, P. S.; Klingensmith, K. A.; Waluk, J.; Michl, J.; Pure & Appl. Chem.1989, 61, 2117.
40. Jiang, M-M.; Chen, H-Y.; Li, B-H.; Liu, K-W.; Shan, C-X.; Shen, D-Z.; J. Mater. Chem. C2014, 2, 56.
41. Otto, A.; Mrozek, I.; Grabhorn, H.; Akermann, W.; J. Phys.: Condens. Matter1992, 4, 1143.
42. Zhao, L. B.; Huang, R.; Huang, Y. F.; Wu, D. Y.; Ren, B.; Tian, Z. Q.; J. Chem. Phys.2011, 135, 134707.
Submitted: September 25, 2014
Published online: March 13, 2015