Article
Printed in Brazil - ©2016 Sociedade Brasileira de Química 0103 - 5053 $6.00+0.00
A
*e-mail: [email protected]
Application of a New Strategy of Validation Based on “
β
,
γ
-Content Tolerance
Interval” for Checking the Chiral Chromatography Method for Quantification of
the Chiral Impurity of Levofloxacin
Houda Bouchafra,*,a,b Miloud El karbane,b,c Mohamed Azougagh,d Fayssal Jhilal,e Saad
Alawi Sosse,a EL Mestafa El hadrami,a Taoufiq Saffaja and Bouchaîb Ihssanea
aApplication Organic Chemistry Laboratory, Sciences and Techniques Faculty, Sidi Mohamed Ben
Abedallah University, BP 2202 route d’immouzer, 30000 Fès, Morocco
bPhysicochemical Service, Drugs Control National Laboratory, Direction of Drugs and Pharmacy,
Ministry of Health, 10000 Rabat, Morocco
cLaboratory of Pharmacology and Toxicology, Faculty of Medicine and Pharmacy,
Mohammed V University, Soussi, 10000 Rabat, Morocco
dSuperior Institution of Nursing Professions and Health Techniques,
Avenue Hassan II Km 4,5 Route de Casa, 10000 Rabat, Morocco
eLaboratory of Engineering Materials, Modeling and Environment, Faculty of Sciences Dhar El
Mahraz, University sidi Mohammed Ben Abdallah, BP 1796 Atlas, 30000 Fès, Morocco
A simple and accurate chiral high performance liquid chromatography (HPLC) method was developed for determination of Levofloxacin and its chiral impurity (R)-enantiomer. The chiral impurity Levofloxacin separation method was optimized by Box-Behnken design and validated by an innovative analytical approach recently developed in our laboratory. This last approach as well as uncertainty estimation consists of building a graphical decision-making tool, based on the
β,γ-content tolerance interval, called the uncertainty profile. The proposal approach applied to the optimized chiral separation method of Levofloxacin shows its fitness.
Keywords: Levofloxacin, experimental design, uncertainty profile, β,γ-content tolerance interval, measurement uncertainty
Introduction
Recently an original approach based on β,γ-content tolerance interval and uncertainty profile has been introduced. This approach has the advantages that it can facilitate the analytical validation by providing a decision tool based on the uncertainty profile, and allows a good estimate of measurement uncertainty using validation data without additional experiment. An enantiomeric separation using chiral chromatographic method for the determination and quantification of chiral impurity of Levofloxacin was used to illustrate the applicability and flexibility of this approach.
A large number of drugs containing an asymmetric center, which is called chiral drug, are used in the
pharmaceutical industry. Although it is well established that some enantiomers can have different biological and pharmacological activities, which in some cases can have side effects or even toxic effect,1 they are still administered
as racemic mixture. It is why in the recent years, many chiral separation methods were developed.1-8
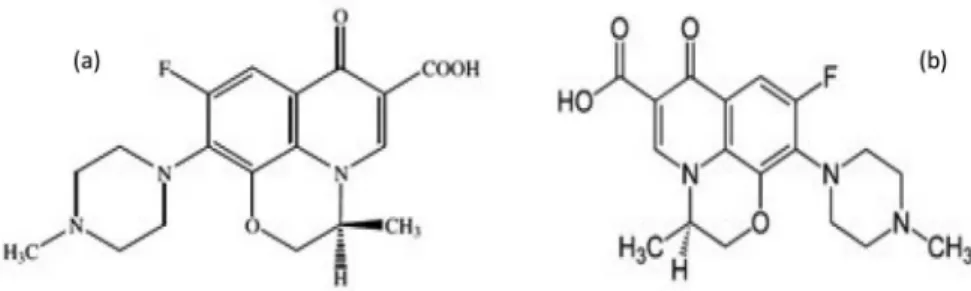
Levofloxacin (Figure 1a) is a chiral fluorinated carboxy quinolone a pure (−)-(S)-enantiomer of the racemic, drug substance ofloxacin. Its antibacterial activity is twofold stronger than that of the R-isomer ofloxacin (Figure 1b).2,9
As in all synthesis routes used to produce Levofloxacin may contain some quantity of its chiral impurity (R-isomer of ofloxacin), the establishment of substantial separation method for the two enantiomers to control the chiral purity of the drug would be mandatory.1-4
ofloxacin enantiomer determinations were reported.1-4 Chiral
capillary electrophoresis using various cyclodextrins as chiral selector was also reported.5-7 So far in our knowledge, only
one HPLC method has been reported using chiral column for the determination of ofloxacin enantiomers.8 However, none
one of the cited method has used an experimental design for method optimization.
The aim of this study was to develop and validate a simple chiral HPLC method for determination of Levofloxacin and its chiral impurity. The development and optimization was done by using three-factorial Box-Behnken design and the analytical validation was applied using an innovative approach, recently developed in our laboratory;10-13 the new
approach consists of building a graphical decision-making tool, called the uncertainty profile based on the β,γ-content tolerance interval. Further, the method will be applied in routine analysis for the quantification of chiral impurity of Levofloxacin and uncertainty evaluation.
Experimental
Chemicals and solvents
Ofloxacin (99.6%) and Levofloxacin (101.5%) standards were obtained from pharmaceutical industries like SANOFI (Casablanca, Morocco). Methanol, hexane, heptane, ethanol of HPLC grade were from Sigma Aldrich (Taufkirchen, Germany). Phosphoric acid (85%) and triethylamine were obtained from Scharlau (Barcelona, Spain).
Instrumentation and chromatographic conditions
The chromatography system consisted of Waters (Waters, Milford, MA, USA) 2695 pumps, auto sampler, automatic injection and Waters 2996 photodiode-array detector (PDA). Separation was carried on Chiralcel OD-H column (250 × 4.6 mm) packed with 5-µm silica gel coated by Cellulose tris-3,5-dimethylphenylcarbamate (Osaka, Japan) and maintained at 35 °C. The mixture of hexane solution and methanol plus ethanol solution in the ratio
of (74:26 v:v) containing 0.45% of phosphoric acid and 0.05% of triethylamine was used as the mobile phase at a flow rate of 1.2 mL min−1. The wavelength of detection
and the injection volume were set at 294 nm and 50 µL, respectively. Data were acquired and processed with Empower chromatography manager software.
Resolution solution for method optimization
A stock solution of ofloxacin standard containing Levofloxacin (0.05 mg mL−1) and chiral impurity of
Levofloxacin (0.05 mg mL−1) was prepared in methanol.
This solution was filtered through 0.45 µm Millipore filter (polyethylene, PE) before chromatographic analysis and it was used for an optimization study.
Standard solution for method validation
A stock solution containing 0.5 mg mL−1 of chiral
impurity of Levofloxacin was prepared in methanol. Further dilutions were performed to obtain five working calibration standards at concentration levels (0.0005, 0.00125, 0.0025, 0.005, 0.01 mg mL−1).
Validation standards were prepared by stock dilution to give the same concentration levels the calibration standards adding 0.5 mg mL−1 of active pharmaceutical ingredient of
Levofloxacin as a matrix.
Experimental design
Response surface methodology (RSM) is a collection of statistical and mathematical techniques useful for the improvement and optimization of complex processes. The main advantage of RSM is its ability to reduce number of experimental trials needed to evaluate multiple parameters and their interactions to provide sufficient information for statistically acceptable results. In addition, it is commonly used to find the optimum chromatographic conditions for separation of drug compounds.
Three classes of response surface designs can be used, central composite, Doehlert and Box-Behnken.
Box-Behnken design is preferable to the central composite and Doehlert designs not only because it requires fewer test runs but also because it is rotatable. Indeed, Box-Behnken designs do not contain any points at the extremes of the cubic region created by the two-level factorial.14
In this work, we have used a three-level and three-factorial Box-Behnken experimental design to estimate the effects of the selected independent variables on the responses, to optimize the separation between Levofloxacin and its chiral impurity in short time. This design is appropriate for exploration of quadratic response surface and for construction of second order polynomial models (equation 1).14-17
The statistical model used for this design is of the following form:
Y = b0 + b1X1 + b2X2 + b3X3 + b12X1X2 + b23X2X3 +
b13X1X3 + b11X12 + b22X22 + b33X32 + e (1)
where Y is the selected response, which calculated by the model, X1, X2 and X3 are the factor studied, b1, b2 and b3
are linear effects, b12, b13 and b23 are the interaction effects
and b11, b22 and b33 are quadratic effects, e is an error term.
Factors studied in the Box-Behnken experimental design were: mixture of methanol plus ethanol (X1) to achieve a
good chiral separation, temperature of the column oven (X2)
which can influence the viscosity of the mobile phase, thus affect the migration of the solute in the column and flow rate (X3) to perform a suitable retention time (Table 1).
The selected responses were: Rs (Y1) resolution between
Levofloxacin and chiral impurity and Rt (Y2) retention time
of the chiral impurity. Table 2 shows the levels combination for the factors studied in each experimental trial.
Method validation
Validation is a very important step in analytical method, it allows ensuring the results obtained in terms of reliability. For a long time, the classical validation that treats separately the two errors such as the bias and random error to make the decision was applied. However, statistical processing used by this approach presents some ambiguities, especially in decision-making and interpretation of results.
Selectivity
The selectivity of the method is a very important step that can be checked by, the existence or absence of any interference with the chiral impurity of Levofloxacin, and the matrix.
Response function
The relationship between the response and the analytical concentration was determined on the basis of the calibration standards. And it was characterized by a function called response function, which is a critical step in the analytical validation. Indeed, the series of calibration standards prepared using material reference help to generate many regression models for calibration, e.g., the linear regression through 0, the linear regression model, the weighted 1/X or 1/X2 linear models, the
quadratic regression model, the linear regression after square root transformation data, the linear regression after logarithm transformed data.18-28 We will then select the
most suitable model that allows a good inverse prediction. This inverse prediction performed, via the selected model,
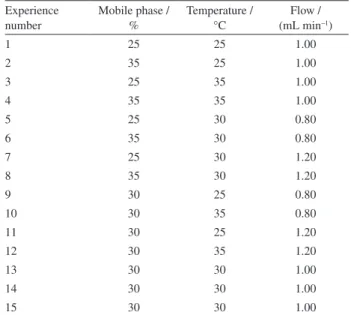
Table 2. Levels combination for the factors and retention time for each experimental trial
Experience number
Mobile phase / %
Temperature / °C
Flow / (mL min−1)
1 25 25 1.00
2 35 25 1.00
3 25 35 1.00
4 35 35 1.00
5 25 30 0.80
6 35 30 0.80
7 25 30 1.20
8 35 30 1.20
9 30 25 0.80
10 30 35 0.80
11 30 25 1.20
12 30 35 1.20
13 30 30 1.00
14 30 30 1.00
15 30 30 1.00
Table 1. Factors and its corresponding levels selected for the Box-Behenken design
Factor Unit Level (−) Medium Level (+)
Mixture of methanol plus ethanol, X1 % 25 30 35
Temperature of the column oven, X2 °C 25 30 35
Flow rate, X3 mL min−1 0.8 1.0 1.2
allowed giving the retrieved concentrations, the relative bias and the relative standard deviation (RSD) precision for each concentration level.
Estimation of precision
The precision of an analytical procedure is usually expressed as the variance, standard deviation or coefficient of variation of a series of measurements.18-28 In the
present study, the repeatability and intermediate precision can be evaluated at each level of concentration using one way analysis of variance. During the analytical method validations, the experimental design involves to make measurements at different days, with replicate determinations within each day. A statistical model to describe the measured values is given by equation 2:
Yij = µ + bi + eij; j = 1,2,…,n; i = 1,2,…,a (2)
where Yij denotes the jth replicate observation corresponding
to ith run, µ is an unknown general mean, b
i’s represent
random effects. and eij’s represent error terms. It is assumed
that bi’s and eij’s are all independent having the distributions
bi ca. N(0, σb2) and eij ca. N(0, σb2). Thus and σb2 and σe2
represent the two variance components in the model. We define:
(
)
(
)
a n n a
a n
2
2
ij i ij b i
e ij i
i 1 j 1 j 1 i 1
i 1 j 1
1 1
Y Y , Y Y , SS n Y Y
and SS Y Y
an = = n = =
= =
= = = −
= −
∑∑
∑
∑
∑∑
(3)
where Y is the mean of the back calculated concentration. – And Y–i is the mean of the back calculated concentration at
i level. SSb present square of standard deviation inter-series
and SSe present square of standard deviation intra-series.
Based on the model in equation 2, we can identify the expected mean squares (equation 4):
(
)
b e
b e
SS SS
MS and MS
a 1 a n 1
= =
− − (4)
where MSb and MSe are the mean square model and the
mean square error, respectively.
The ANOVA estimators of σb2 and σb2 are given by:
(
)
2 2
b b e e e
1
S MS MS and S MS
n
= − = (5)
where Sb and Se are standard deviation inter-series and
standard deviation intra-series, respectively.
If MSe < MSb, the repeatability and intermediate
precision will be, respectively (equation 6):
Sr2 = MSe and
2 2
FI e b
S = S +S (6)
If not, Sb2 = 0 and Se2 = ST2; where, ST2 was the total
variance of the set of measures.
Estimation of trueness
The trueness of an analytical procedure (or bias), at each concentration level, is obtained by calculating the difference between the introduced concentrations mean (ˆµm)
and the calculated concentrations mean (–xm). The bias can
be expressed in absolute or relative terms (equation 7) or in recovery terms (equation 8),18-28as follows:
(7)
(8)
Uncertainty profile
In this study, an innovative approach, recently developed by our laboratory,10-13 was used which allows at the same
time examination of the validity of analytical procedures as well as estimation of the uncertainty of chemical measurements without additional experiments. It consists of building a graphical decision-making tool, called the uncertainty profile. Our proposal allows a good assessment of measurement uncertainty through an innovative formula, based on the β,γ-content tolerance interval.
The validation strategy based on the uncertainty profile can be achieved through the following steps:
(i) choice of the appropriate acceptance limits taking into account the intended use of the method;
(ii) generate all possible calibration models using the calibration data;
(iii) calculation of the inverse predicted concentrations of all validation standards according to the selected calibration model;
(iv) compute the two-sided β-content γ-confidence tolerance intervals for each level, according to one of three approaches proposed below;
(v) determination of the uncertainty for each level using equation 9 below;
(vii) compare the interval of uncertainty (L, U) to the acceptance limits (−λ,λ);
(viii) if (L, U) falls totally within (−λ,λ), the method is
accepted; otherwise, the method is not valid.
The computation of the two sided β-content tolerance intervals for balanced one-way random effects models using Mee’s method was carried out according to the method described by Saffaj and Isshane10 And which its
applicability and its performance have been demonstrated to validate analytical and bioanalytical methods.29,30
The formula to assess the uncertainty at each level of concentration was demonstrated as follows:
In accordance with the LGC/VAM protocol28 and the
recommendations of the ISO/DTS 21748 guide, a basic model for the uncertainty of the measurand Y can be expressed by (equation 9):
u2(Y) = S
R2 + u2(ˆδ) + ΣCi2u2(xi) (9)
where SR is the reproducibility standard deviation, u(ˆδ)
is the uncertainty associated with the bias of the method, and ΣCi2u2(x
i) is the sum of all of the effects due to other
deviations.
The previous accuracy profile and validation data concept used by Feinberg23 to estimate the measurement
uncertainty, the third term of equation 9 was ignored. However, uncertainty can be expressed by the following equation (equation 10):
u2(Y) = S
R2 + u2(ˆδ) (10)
The accuracy profile can be built using the β-expectation tolerance interval, according to Mee’s method.31 This
interval is equal to equation 11:
–
Y ± t(ν)k ˆσM (11)
Thus, one can verify that equation 12:
u2(Y) = k2σˆ2
M (12)
And the mathematical model that brings the uncertainty and the tolerance interval is given by equation 13:
–
Y ± t(ν)u(Y) (13)
Note that: ˆσM = SR
By virtue of equation 13 we can write that equation 14:
U = Y + t(– ν)u(Y) (14)
and:
L = Y – t(– ν)u(Y) (15)
Finally, the uncertainty can be expressed as equation 16:
(16)
where U is the upper β-content tolerance interval, Lis the lower β-content tolerance interval, t(ν) is the (1 + γ)/2 quantile of Student’s t-distribution with ν degrees of freedom. For balanced data, ν can be estimated by the Satterthwaite formula.32
Finally, in order to build the uncertainty profile, we have used the following formula equation 17:
|Y ± ku(Y)| < – λ (17)
where k is a coverage factor. The choice of the factor k is based on the level of confidence desired. For an approximate level of confidence of 95%, k = 2. Y is – the estimate of the mean results, λ is the acceptance limits.
The uncertainty profile can also be expressed by equation 18:
|Bias ± ku(Y)| < λ (18)
Results and Discussion
ANOVA result and regression model with the aid of Box-Behenken design
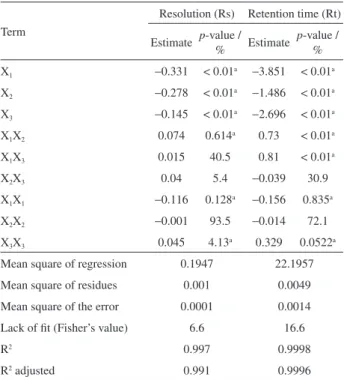
According to analysis of variance (ANOVA), the regression model is significant for the two response respectively resolution Rs and retention time Rt, this is evident from the Fisher’s p-value (6.6 and 16.6) and a low probability value (p < 0.05) for the two response.
The determination coefficient (99.7%) and (99.98%) for Rs and Rt respectively confirms the adequacy of model. The value suggests that the model could predict 95.6% of the variability in Rs and 99.8% for Rt.
The second-order polynomial equation illustrates the relationship of the three variables (equations 19 and 20).
Y1 = 2.44 – 0.33X1 – 0.27X2 – 0.14X3 – 0.11X12 +
0.04X32 + 0.07X1X2 (19)
Y1 = 12.88 – 3.85X1 – 1.48X2 – 2.69X3 – 0.15X12 +
An independent factor had effect on a given response when it had a p-value < 0.05, and non-significant terms were eliminated from the model postulated a priori (Table 3).
Only significant coefficients with p-value < 5% are included. From the results illustrated in Table 3, it was concluded that proportion mixture of methanol plus ethanol (X1), temperature of the column oven (X2) and flow rate
(X3) were important significant factors affecting the two
responses. Quadratic terms also created important effect, X12 and X32 present significant effect on investigated Rs and
Rt. Factor interaction X1X2 had significant effect on measured
responses (Rs and Rt), and X1X3 affect only Rt response.
Optimization of chromatographic conditions
ANOVA were verified before performing response surface methodology. Indeed, from the result presented in Table 3,sincethe variation of regression is greater than the variation of residues and the lack of fit is greater than the error, therefore the ANOVA is verified and the model is considered valid.
Response surface methodology (RSM) plays a very critical role in efficiently exploring the optimal values of explanatory variables. As a function of two factors, three dimensional response surfaces and their corresponding contour plots are more helpful in understanding both the main and the interaction effects of these two factors,
maintaining all other factors at fixed levels. They can be used to describe and examine the regression equations in a visualized way to reflect the effects of experimental variables on the required response.33
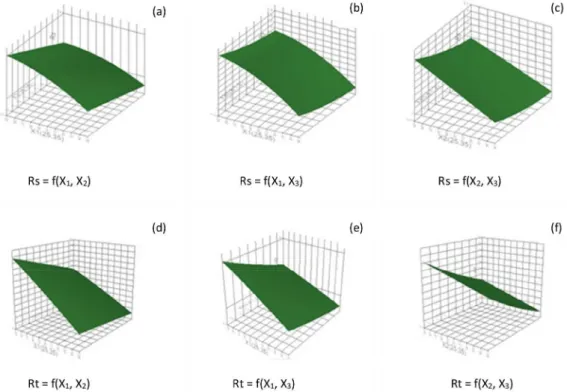
The variation of the response was correctly related to the variation of the factors. Three dimensional plots for the measured responses were performed, based on the model polynomial functions to assess the change of the response surface.
Figures 2a-2d show the effect of proportion mixture of methanol plus ethanol and temperature of the column oven on resolution and retention time at a constant flow rate of 1 mL min−1, it is apparent from the figure that
the resolution Rs and retention time Rt increased with decreasing the proportion of methanol plus ethanol and the temperature of the column oven. Figures 2b-2e show the effect of proportion mixture of methanol plus ethanol and flow rate on resolution and retention time at a constant temperature of column oven of 30 °C, like the last observation, the resolution Rs and retention time Rt increased with decreasing the proportion of methanol plus ethanol and the flow rate. Figures 2c-2f show the effect of temperature of column oven and flow rate at a constant proportion mixture of methanol plus ethanol of 30%, in that figure we remark that the resolution Rs and retention time Rt increased with decreasing the flow rate and the temperature of the column oven.
In a chromatographic method, the resolution and retention time are the most important parameters which characterize a chromatogram, the resolution indicate if the method is suitable to separate different analytes in a mixture solution, in our study we have to separate two enantiomers which present the same physicochemical characteristics, also their separation are not easy, that is is why this parameter was selected as an optimization criteria to ensure that the chosen method will be able to separate and quantify the Levofloxacin and its chiral impurity in the routine application. Afterwards, we try to have a short time for this chromatographic analysis, therefore we have chosen retention time of the chiral impurity like a second criteria of optimization.
Our objective in the optimization stage is to implement a chromatographic method that quantifies the chiral impurity of Levofloxacin in the active pharmaceutical ingredient, in a short time with a good separation between the peaks. Before continuing, it was important to identify some important criteria of optimization, indeed in the first hand minimum retention time of R-isomer (chiral impurity of Levofloxacin) in order to save acquisition time and the amount of solvents used in the mobile phase and in the other hand maximum resolution between the Levofloxacin and its R-isomer for the purpose of a good quantification of
Table 3. Factor effects and associated p-values results for Box-Behnken design
Term
Resolution (Rs) Retention time (Rt)
Estimate p-value / % Estimate
p-value / %
X1 −0.331 < 0.01a −3.851 < 0.01a
X2 −0.278 < 0.01a −1.486 < 0.01a
X3 −0.145 < 0.01a −2.696 < 0.01a
X1X2 0.074 0.614a 0.73 < 0.01a
X1X3 0.015 40.5 0.81 < 0.01a
X2X3 0.04 5.4 −0.039 30.9
X1X1 −0.116 0.128a −0.156 0.835a
X2X2 −0.001 93.5 −0.014 72.1
X3X3 0.045 4.13a 0.329 0.0522a
Mean square of regression 0.1947 22.1957
Mean square of residues 0.001 0.0049
Mean square of the error 0.0001 0.0014
Lack of fit (Fisher’s value) 6.6 16.6
R2 0.997 0.9998
R2 adjusted 0.991 0.9996
the chiral impurity in the active pharmaceutical ingredient. A graphical method was used for global optimization which are based on contour overlay plots (Figure S1 (in the Supplementary Information (SI) section). These plots depict the alteration of all selected responses against two independent factors, whilst keeping the rest at constant level. The optimum experimental conditions were defined by the intersection between resolution (red curve) and retention time (blue curve).
The acceptable retention time and resolution can be established as follows: Figure S1a (in the SI section) account for portion mixture of methanol plus ethanol to be in the range 26-27% and temperature of column oven to be in the range 25-27 °C (Figure S1b in the SI section), account for proportion mixture of methanol plus ethanol to be in the range 26-27% and flow rate to be in the range of 1.1-1.2 mL min−1 (Figure S1c in the SI section) account
for temperature of column oven to be in the range 25-26 °C and flow rate to be in the range of 1.1-1.2 mL min−1.
Eventually, the optimal conditions for the separation and identification of R-isomer (chiral impurity of Levofloxacin) using Box-Behnken design were obtained with fallowing mobile phase: hexane and mixture of methanol plus ethanol (74:26 v:v) with 1.2 mL min−1 of flow rate and temperature
of column oven of 25 °C. The chromatogram obtained from the above conditions is shown in Figure S2 (in the SI section). Under the described experimental conditions, the
values of retention time of R-isomer were 13.675 min and the resolution between Levofloxacin and R-isomer was 2.8. It is apparent that Box-Behnken statistical design was reliable and effective in determining the optimum conditions.
Method validation
After the optimization process, it is necessary to demonstrate that the analytical method provides accurate quantification results. This is carried out through a method validation. In this study the quantification of the chiral impurity of Levofloxacin was validated by applying the concept of uncertainty represented by an uncertainty profile.
Selectivity
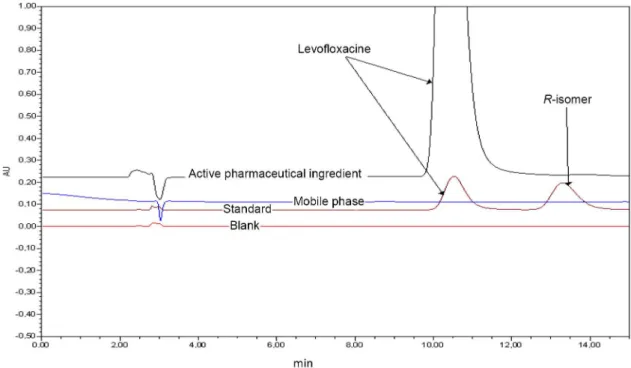
It was first thought necessary to verify the absence of any interference at the retention time of the chiral impurity of Levofloxacin. For this, the selectivity of the method was evaluated. The chromatographic method conferred good selectivity for the R-isomer contained in active pharmaceutical ingredient of Levofloxacin. Indeed, the chromatogram overlay of the mixture of the Levofloxacin and R-isomer standard, active pharmaceutical ingredient preparation, mobile phase solution and blank solution showed no endogenous peak interference (Figure 3). All the analytes were well resolved under the optimal conditions.
Figure 2. Responses surfaces related to proportion mixture of methanol plus ethanol (X1), temperature of the column even (X2) and flow rate (X3) on the
responses: resolution Rs and retention time Rt, using Box-Behenken design. (a,d) Show the effect of X1 and X2 on Rs and Rt; (b,e) show the effect of X1
Precision
The repeatability (relative standard deviation, %RSD) and intermediate precision (%RSD) performed by one way balanced ANOVA are shown in (Table 4). The %RSD values for repeatability and intermediate precision did not exceed 1.7%.
Trueness
The result of trueness expressed in bias (%) and recovery (%) as can be seen in (Table 4) were assessed from the validation standards in the matrix at five concentration levels.
The trueness of the proposed method was demonstrated of R-isomer since the relative bias did not exceed the value of 3.57%. These values are less than ±5%, limits for active substances and in particular to ±10% for impurities in
pharmaceutical formulations, which indicated a very low bias and the absence of matrix effect.
Measurement uncertainty and uncertainty profile
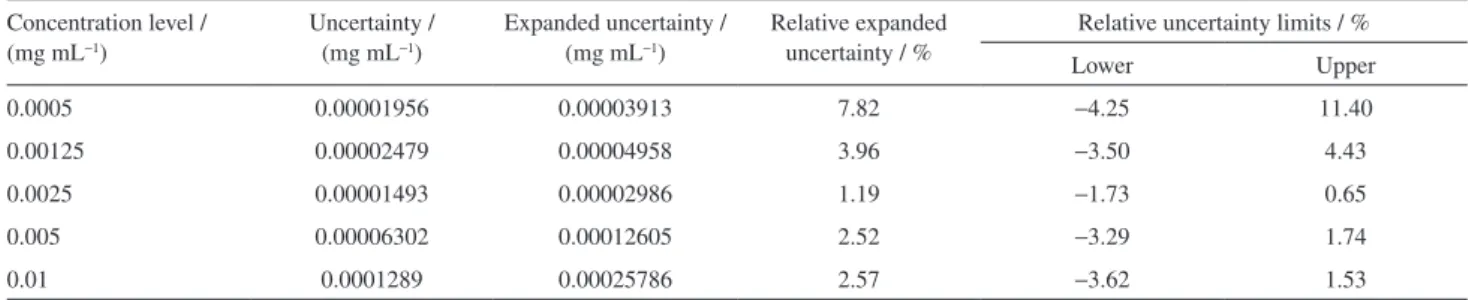
The upper and lower uncertainty limit were calculated using β = 90% (proportion of accepted measurements) and γ = 95% (confidence level). The result calculated is expressed in % and presented in Table 5 shows that the uncertainty limit within the acceptance limits for assay ±10% at every concentration level studied.
The upper and lower uncertainty limits expressed in relative value (%) are presented in Figure 4 as a function of the introduced concentrations. As can be seen from the results, the method was considered as accurate, since the uncertainty intervals are included in ±10% acceptance limits for the concentration levels tested except the lowest one. Furthermore, we conclude that the uncertainty
Figure 3. Chromatograms of the mixture of the Levofloxacin and R-isomer standard, active pharmaceutical ingredient preparation, mobile phase solution and blank solution for the selectivity criteria.
Table4. Validation results for R-isomer (chiral impurity of Levofloxacin) using linear regression model
Concentration level / (mg mL−1)
Trueness Precision Accuracy
Relative bias / % Recovery / % Repeatability / % Intermediate precision / %
Lower tolerance limit / %
Upper tolerance limit / %
0.0005 3.57 103.57 1.78 1.78 −5.511 12.657
0.00125 0.46 100.46 0.69 0.69 −4.604 5.534
0.0025 −0.54 99.46 0.35 0.35 −1.928 0.845
0.005 −0.78 99.22 0.19 0.58 −5.555 4.001
undoubtedly exceeds the acceptance limit for the low concentration.
The validation method based on uncertainty profile approach has several advantages compared to classical approaches. First of all, this approach provides a very simple method of visual and graphical interpretation (Figure 4) that does not bother a sensitive statistical test. Furthermore, it can minimize the risk of accepting a procedure that would not be sufficiently accurate or, conversely, rejecting a procedure that would be accurate. The most important in the application of the uncertainty profile is not only to simplify the validation approach of a procedure but also the estimation of measurement uncertainty based on validation data.
Limit of quantification (LOQ)
The lower limit of quantification (LOQ) is the smallest quantity of the targeted substance in a sample that can be determined in the prescribed experimental conditions with an accuracy defined.20,28 The LOQ was obtained by the
signal/noise (S/N) ratio, the value of LOQ calculated using an experimental method was 0.000073 mg mL−1.
Determination and quantification of chiral impurity in active pharmaceutical ingredient (API) of Levofloxacin
The Levofloxacin API sample was analyzed at the optimized separation conditions in order to identify and quantify the chiral impurity, and to ensure the applicability and the fitness of the optimized method. The amount of chiral impurity in the Levofloxacin API sample was calculated and the value obtained was 0.28% of the chiral impurity in the Levofloxacin API sample.
Conclusions
An analytical method for the separation and quantification of the chiral impurity of Levofloxacin was developed using an HPLC system with Chiralcel column. This method was optimised using the response surface methodology such as Box-Behnken design. Under optimised conditions, a suitable separation between Levofloxacin and its chiral impurity was observed with a resolution of 2.8 and the retention time of the chiral impurity of Levofloxacin was 13.6 min. Finally, this chiral chromatographic method was validated successfully using
Table 5. Point estimates of the relative expanded uncertainty and uncertainty limits obtained at each concentration level using the β-γ-content tolerance interval
Concentration level / (mg mL−1)
Uncertainty / (mg mL−1)
Expanded uncertainty / (mg mL−1)
Relative expanded uncertainty / %
Relative uncertainty limits / %
Lower Upper
0.0005 0.00001956 0.00003913 7.82 −4.25 11.40
0.00125 0.00002479 0.00004958 3.96 −3.50 4.43
0.0025 0.00001493 0.00002986 1.19 −1.73 0.65
0.005 0.00006302 0.00012605 2.52 −3.29 1.74
0.01 0.0001289 0.00025786 2.57 −3.62 1.53
uncertainty profile approach which allows us to control the risk of using the analytical method in routine and to have full information about its performance.
Supplementary Information
Supplementary data (overlay contour plot and HPLC-PDA chromatogram) are available free of charge at http://jbcs.sbq.org.br as PDF file.
Acknowledgements
The authors would like to thank the director and staff of the Drugs Control National Laboratory, Rabat, Morocco, for their fruitful assistance.
References
1. Shmid, M. G.; Gubitz, G.; Anal. Bioanal. Chem.2011, 400, 2305.
2. Yan, H.; Row, K. H.; Anal. Chim. Acta2006, 584, 160. 3. Shao, B.; Sun, X.; Zhang, J.; Hu, J.; Dong, H.; Yang, Y.;
J. Chromatogr. A 2008, 1182, 77.
4. Tian, M.; Row, H. S.; Row, K. H.; Monatsh. Chem. 2010, 141, 285.
5. Toth, G.; Mohacsi, R.; Racz, A.; J. Inclusion Phenom. Macrocyclic Chem. 2013, 77, 291.
6. Ward, T. J.; Ward, K. D.; Anal. Chem.2011, 84, 626. 7. Zhou, S.; Ouyang, J.; Baeyens, W. R. G.; Zhao, H.; Yang, Y.;
J. Chromatogr. A 2006, 1130, 296.
8. Sun, X.; Wu, D.; Shao, B.; Zhang, J.; Anal. Sci. 2009, 25, 931. 9. Morrissey, I.; Hoshine, K.; Sato, K.; Yoshida, A.; Hayakawa, I.;
Bures, M. G.; Shene, L. L.; Antimicrob. Agents Chemother. 1996, 40, 1775.
10. Saffaj, T.; Ihssane, B.; Talanta2011, 85, 1535. 11. Saffaj, T.; Ihssane, B.; Talanta2013, 106, 155.
12. Saffaj, T.; Ihssane, B.; Jhilal, F.; Bouchafra, H.; Laslami, S.; Sosse, S. A.; Analyst2013, 138, 4677.
13. Saffaj, T.; Ihssane, B.; Talanta2012a, 92, 15.
14. Ihssane, B.; Charrouf, M.; Abourriche, A.; Abboud, Y.; Bouabidi, A.; Bennamara, A.; Saffaj, T.; Acta Chromatogr. 2011, 23, 41.
15. Dejaegher, B.; Vander Hyden, Y.; J. Pharm. Biomed. Anal.2011, 56, 141.
16. Hibbert, D. B.; J. Chromatogr. B: Anal. Technol. Biomed. Life Sci. 2012, 910, 2.
17. Mason, R. L.; Gunst, R. F.; Hess, J. L.; Statistical Design and Analysis of Experiments, 2nd ed.; John Wiley & Sons: Dallas,
2003.
18. Hubert, Ph.; Nguyen-Huu, J.; Boulanger, B.; Chapuzet, E.; Chiap, P.; Cohen, V.; Compagnon, P.; Dewe, W.; Feinberg, M.; Lallier, M.; Laurentie, M.; Mercier, N.; Muzard, G.; Nivet, C.; Valat, L.; STP Pharma Prat. 2003, 13, 101.
19. Vander Heyden, Y.; Nijhuis, A.; Smeyers-Verbeke, J.; Vandeginste, B. G. M.; Massart, D. L.; J. Pharm. Biomed. Anal. 2001, 24, 723.
20. Bouabidi, A.; Rozet, E.; Fillet, M.; Ziemons, E.; Chapuzet, E.; Mertens, B.; Klinkenberg, R.; Ceccatof, A.; Talbi, M.; Streel, B.; Bouklouze, A.; Boulanger, B.; Hubert, Ph.; J. Chromatogr. A 2009, 1217, 3180.
21. Gonzalez, A. G.; Herrador, M. A.; Talanta2006, 1217, 896. 22. Boulanger, B.; Chiap, P.; Dewe, W.; Crommen, J.; Hubert, P.;
J. Pharm. Biomed. Anal.2003, 32, 753.
23. Feinberg, M.; Labo-Stat: Guide de Validation des Méthodes d’Analyse, Lavoisier, TEC &DOC: Paris, France, 2009.
24. Feinberg, M.; Validation des Méthodes d’Analyse Quantitatives au Moyen du Profil d‘Exactitude. Techniques de l’ingénieur,
T.I & Weka: France, 2010.
25. Zufia, L.; Aldaz, A.; Ibanez, N.; Viteri, C.; J. Pharm. Biomed. Anal. 2009, 49, 547.
26. Streel, B.; Cahay, B.; Klinkenberg, R.; J. Chromatogr. B: Anal. Technol. Biomed. Life Sci. 2009, 877, 2290.
27. Barwick, V. J.; Ellison, L. R.; VAMProject 3.2.1, Development and Harmonization of Measurement Uncertainty Principles.
Part D: Protocol Uncertainty for Evaluation from Validation
Data. Report No.:LGC/VAM/1998/088. Accelrys Corporate Headquarters: San Diego, USA, 2000.
28. Hubert, P.; Nguyen-Huu, J. J.; Boulanger, B.; Chapuzet, E.; Chiap, P.; Cohen, N.; Compagnon, P. A.; Dewé, W.; Feinberg, M.; Lallier, M.; J. Pharm. Biomed. Anal.2007, 45, 70.
29. Ihssane, B.; Sbai, M.; El hadrami, El.; Achour, S.; Saffaj, T.; Int. J. Pharm. Pharm. Sci.2014, 6, 413.
30. Tan, A.; Saffaj, T.; Musuku, A.; Awaiye, K.; Ihssane, B.; Jhilal, F.; Alaoui, S. S.; Trabelsi, F.; J. Chromatogr. B: Biomed. Sci. Appl.2015, 983, 68.
31. Mee, R.; Technometrics 1984, 26, 251. 32. Satterthwaite, F. E.; Biom. Bull.1946, 110.
33. Wu, L.; Yick , K. L.; Ng, S. P.; Yip, J.; Expert Sys. Appl.2012, 39, 8059.
Submitted: July 23, 2015