Article
0103 - 5053 $6.00+0.00A
*e-mail: [email protected]
Pressurized Flow Solubilization System Using Electromagnetic Induction Heating
Technique for Simultaneous Determination of Inorganic Elements (Ba, Ca, Cd,
Cu, Fe, Mg, Mn, Na, Pb, Sr, Zn) in Sonicate Slurries of Biological Materials by
Microwave Induced Plasma Optical Emission Spectrometry (MIP-OES)
Henryk Matusiewicz* and Mariusz Ślachciński
Faculty of Chemical Technology, Poznan University of Technology, 60-965 Poznań, Poland
A pressurized continuous flow system using electromagnetic induction heating technique has been developed for the determination of trace and minor element content in biological samples by microwave induced plasma-optical emission spectrometry (MIP-OES). The system allows the continuous solubilization of samples at an optimized temperature of 120 °C and pressure of 3.5 bar in 40 min. A system was used to perform off-line solubilization of slurried samples of biological tissues, non-fat milk powder and lichen (3% m/v). Recovery of trace and minor elements averaged 99.2 ± 0.1% was performed by MIP-OES using external calibration technique. The accuracy of the method was proved using certified reference materials from the National Research Council Canada (NRCC, Dogfish Liver, DOLT-2), National Institute of Standards and Technology (NIST, (Non-Fat Milk Powder, NIST 1549) and International Atomic Energy Agency (IAEA, Lichen, IAEA-336). Satisfied analytical results were also obtained in real sample analysis of milk powder, barley and cinnamon.
Keywords: pressurized electromagnetic induction heating, slurry sample, off-line solubilization,
elemental analysis, microwave induced plasma spectrometry
Introduction
Microwave induced plasma-optical emission spectrometry (MIP-OES) has been shown to be a promising technique for the determination of elements in view of its relatively low costs and easy usage.1 Some pre-treatment procedures, including sample digestion, pre-concentration, separation, etc., are necessary for the determination of elements in environmental samples. Among them, digestion of materials represents an important stage in the analysis, and several publications have been devoted to this subject.2-4
For the determination of major, minor and trace elements in either solid or liquid samples, containing an organic matrix, by atomic spectrometry, total digestion of the samples may be the most significant step. Hence, sample preparation is usually achieved by “complete” digestion using either conventional wet- or dry-ashing techniques followed by the appropriate chemical treatments. These decomposition procedures are often time consuming, requiring large volumes of aggressive and expensive reagents, and are prone to systematic error resulting from contamination and volatilization and adsorption losses.5 Many of the
disadvantages of sample digestion can be overcome by sample preparation in an enclosed system through the use of flow technology.6 Only liquid samples or slurries (suspension of ground solid samples in water or acid) can be digested by means of flow digestion. Solid samples are introduced as slurries and must sufficient homogeneous to be representative for the bulk material. By using flow digestion systems, it is possible to incorporate continuous-flow sample preparation with detection to avoid laborious sample pre-treatment.
A double flow injection (FI) manifold incorporating a resistively heated thermal oven was developed for the direct coupling of the digestion of solid samples, as slurried (10% HNO3), with the flame atomic absorption spectrometry (FAAS).7 The feasibility of on-line, high pressure (11 bar, 210 oC) decomposition of a slurry sample, the organic matrix of which is resistant to wet oxidation, has been demonstrated.
300 bar. Aqueous solutions of organic compounds, as well as slurries of different biological materials were digested.9-11
Recently, fast and easy controllable heating method based on electromagnetic induction heating has been proven to be an effective on-line pressurized (3.6 bar, 135 oC).12 Their system has been applied to digestion of different samples for atomic spectrometry determination of elements (Hg, Mn, Zn)13-16 and chemical oxygen demand (COD).17
This paper describes the design and evaluation of pressurized continuous flow solubilization system method, of high heating efficiency, by employing electromagnetic heating technique. The proposed method was successfully employed for the determination of minor and trace elements in environmental samples by microwave induced plasma spectrometry. Validation of this method was achieved using a well characterized certified reference materials.
Experimental
Instrumentation
A C a rl Ze is s E c he ll e sp e c t r o me t er (M o d e l PLASMAQUANT 100) using fiber-optical light-guides and photomultiplier tubes (PMT) and the TE101 microwave plasma cavity assembly was used and it was essentially the same as previously described.18
The MIP resonant cavity as an excitation source, specified previously,18 was used. The plasma is viewed axially with the axis of the plasma perpendicular to the plane of the entrance slit. Since the plasma torch, cavity, generator and gas flow have been described in detail in a previous paper.19 Instrument settings and operational parameters used for the experimental solubilization system with MIP-OES detection are summarized in Table 1.
Pressure electromagnetic induction heating flow solubilization system
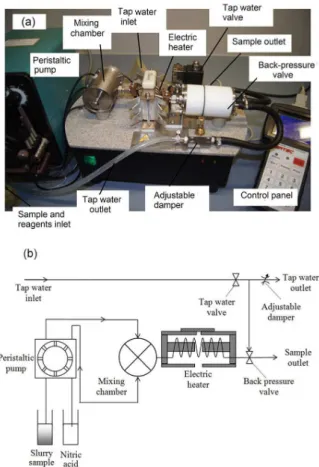
A laboratory-built pressure electromagnetic induction heating flow solubilization system (Ertec, Wroclaw, Poland) for certified reference materials and real samples decomposition was employed. The slurried samples and nitric acid were simultaneously pumped by peristaltic pump (Multisatic pump, HAAKE-BUCHLER INSTRUMENTS Inc., Collegeville, USA) to mixing chamber and preheated. Next the mixture was pumped to the section of electric heater having the form of a coil made of acid-resistant steel pipe wound on two halves of Ferroxcube EDT59-type ferrite core arranged with a 3.2 mm air gap. Inside the steel tube of the heater, the Teflon tubing was inserted. Finally, after solubilization, the sample was pumped to the outlet of the system. A photograph and a schematic diagram of the pressure electromagnetic induction heating flow solubilization system is shown in Figure 1.
Sample introduction system
Element determinations were accomplished in the continuous mode using a commercial ultrasonic nebulizer (model NOVA-DUO, Optolab, Warsaw, Poland) equipped with a glass cyclonic spray chamber (internal volume of 50 mL). Sample solution was delivered by PFA capillary (orifice of 0.4 mm) placed in almost direct contact with the quartz surface of the ultrasonic transducer. In this manner solution was pumped onto the surface of a quartz piezoelectric transducer (1.65 MHz resonant frequency, with a forward power of 80 W) at a flow rate of 9 µL min-1 using a peristaltic pump, where they were effectively dispersed into droplets of ca. 2.0-2.5 µm in mean droplet diameter (0.1-4.5 µm size distribution; a very fine aerosol is formed as a result of the interaction between ultrasonic waves and
Table 1. Optimum operating conditions for sample solubilization and the ultrasonic nebulization microwave induced plasma-optical emission spectrometry (USN-MIP-OES) measurementa of elements obtained by simplex and univariate methods
Parameter (variable) Boundary limits of
parameters, range Univariate method Simplex method Chosen values Sample solubilization parameter
HNO3 solution concentration / (mol L-1) 1-8 4 3.8 4
Solubilization temperature / °C 60-140 120 115 120
Solubilization pressure / bar 2-5 3.5 3.4 3.5
Sample and HNO3 (solubilization) solution flow rate/ (mL min-1) 0.10-0.40 0.25 0.25 0.25 USN-MIP-OES measurement parameter
Forward power / W 100-180 160 161 160
Helium gas flow rate / (mL min-1) 100-300 190 195 200
Argon gas flow rate / (mL min-1) 300-900 600 605 600
Sample (nebulizer) solution flow rate / (µL min-1) 5-40 9 9 9
the liquid film).20 To prevent the analyte (aerosol) from depositing on the plasma quartz torch, the spray chamber glass outlet (covered with a 15 cm wrapped heating wire) was electrically heated. The liquid samples were introduced through the nebulizers by means of a Perimax12 peristaltic pump (SPETEC, Erding, Germany). The gas flow rate was controlled by means of a mass flow controller (DHN, Warsaw, Poland) with a pressure regulator. Argon was used as the nebulizing-carrier gas and as the plasma gas; whereas helium was used as the plasma supporting gas.
Reagents, analytical solutions and gases
Compressed, pure argon and helium gases (N-50 purity, 99.999%) obtained from BOC GAZY (Poznań, Poland) were used as plasma gases. Standard solutions were prepared from 1000 mg L-1 ICP stock solution Multi-element Standard Solution IV CertiPUR (Merck, Darmstadt, Germany).
Working calibration solutions were freshly prepared daily by diluting appropriate aliquots of the stock solution in 1.5 mol L-1 HNO
3 prepared from a 69% high purity acid (Merck, Darmstadt, Germany) in pure water for elemental analyses.
Ultra-high purity HNO3 (Merck, Darmstadt, Germany) was used for pressure flow sample solubilization. Water was initially deionized (DEMIWA 5 ROSA, Watek, Czech Republic) and then doubly distilled in a quartz apparatus (Heraeus Bi18, Hanau, Germany).
Certified reference materials and real samples
Applicability of the method described in this work was assessed using three reference materials, which were chosen to represent solid sample matrices: DOLT-2 (Dogfish Liver) supplied by the National Research Council Canada (NRCC, Canada), NIST 1549 (Non-Fat Milk Powder) supplied by National Institute of Standards and Technology (NIST, USA) and IAEA-336 (Lichen) supplied by International Atomic Energy Agency (IAEA, Austria). The certified reference values are available for each of these elements for assessment of the method accuracy. All solid reference materials were used as bottled, without further grinding and sieving.
To check the applicability of the pressure electromagnetic induction heating flow solubilization system, the elements content (information concentrations of the elements) of some commercial, purchased from a local shop, milk powder, barley and cinnamon were analyzed. The samples were chosen for the flow induction solubilization and elements determination using MIP-OES detection. All solid samples were used directly from the package, without further grinding and sieving.
Slurry sample preparation
For sonication the slurries and sample homogenization, a Bandelin (Berlin, Germany) Model SONOPULS HD 70 (20 kHz, 70 W) ultrasonic homogenizer with a 2 mm high purity titanium probe (microtip) was used. This probe sonicator allows working with slurry volumes in the range of 1-10 mL. 25 mL beakers (vessels) were used and the probe was positioned about 5 mm from the bottom of the cell. The samples for slurry preparation were weighed using an M2P microanalytical balance (Sartorius, Göttingen, Germany) with a resolution of 1 µg (electronic weighing range up to 2 g).
Formation of the slurry and sonication procedure
In this work, the solid samples (fine powders) were used in their original particle size. An aliquot of 300 mg of each reference solid materials (DOLT-2, NIST 1549 and IAEA-336) was accurately weighed and placed in a quartz beaker, where 10 mL of 4 mol L-1 HNO
3 was added, to make up a 3% m/v slurry. Slurries were pretreated by Figure 1. A photograph in (a) and a schematic diagram in (b) of the
sonication at 60% of the ultrasonic probe power setting (ca. 40 W) for 5 min. No re-homogenization was needed before introduction to electromagnetic flow solubilization system. After solubilization the samples were transferred to the flask with volume of 25 mL volume. Blanks were processed through an identical procedure.
Simplex optimization procedure
A simplex optimization approach was undertaken to establish the best conditions for liquid nebulization, transport and excitation. The parameters optimized are listed in Table 1, along with the ranges over which optimization experiments were possible and conducted. In practice, the ranges were judiciously selected for each parameter in turn, taking into account the practical problems of maintaining a stable emission intensity signal. Simplex optimization experiments were performed using a software package (Multisimplex AB, Karlskrona, Sweden). The optimization was carried out using ultrasonic nebulizer in order to establish the “real” experimental conditions. Three measurements for each variable were conducted at the value of interest. Between each experiment, a blank corrective experiment was run to ensure stable and repeatable results.
Analytical procedure
The sample and the reagent were simultaneously pumped at 0.25 mL min-1 through high resistant tubings (o.d. 3.1 mm, i.d. 1.3 mm, length 40 cm. Viton, Elkay Laboratory Products, Hampshire, UK) to mixing chamber (volume ca. 1 mL) made of Teflon in stainless steel body. The chamber equipped with a Teflon membrane which works with the force sensor within the range of 200 N that allows for pressure measurements in the range up to 7 bar (useful range of 5 bar). In order to reach thermal equilibrium and to avoid eventually crystallization of liquid mixtures the reagents were preheated to 45 °C. Next the sample and nitric acid were pumped to the section of electric heater having the form of a coil made of acid-resistant steel pipe (6 mm o.d. and 4 mm i.d.) wound on two halves of Ferroxcube EDT59-type ferrite core arranged with a 3.2 mm air gap. Inside the steel tube of the heater the Teflon tubing (4 mm o.d. and 3 mm i.d.) was inserted. Heating of the tube was achieved due to the losses in the material of the steel coil having inductance of ca. 2 µH, which was a part of a resonant tank circuit known from the technique of inductive heating. Consequently, the mixture inside the tubing was heated and pressurized according to the program set.
The tank circuit with parallel-connected resonant capacitor of ca. 5.2 µF (actually a battery of 11 capacitors of 0.47 µF ea. was used) was excited via a series inductor from a 50 kHz frequency power generator of square shape waveform. The generator applied was a 200 W inverter for halogen lamps which feeds the tank circuit through the serial inductor having the inductance of ca. 22 µH. The tuning of the resonance in the circuit was achieved by adjusting the gap between the two halves of the ferrite cores. By applying these cores the magnetic field lines are trapped in both air gap and magnetic cores. The goodness of the actual circuit is ca. 9, which means that relatively small halogen lamp inverter with 50 kHz frequency is capable to generate a current in the inductor coil in excess of 100 A. Therefore, an electronically controlled intermittent operation of the inverter in the PWM (power width modulation) mode was applied. Both the inverter and the entire device were controlled by a built-in microprocessor. The inverter used was a typical half-bridge electronic transformer used for halogen lamps.
The Q-factor was estimated using tunable generator and an oscilloscope by measuring the width of the resonance curve. The drop of signal magnitude by 3 db was observed when the generator was detuned by band width (df) from resonant frequency (fo). The calculation according to the formula Q = fo / (2 df) gave Q = 9.
Back pressure valve was designed to maintain a predetermined pressure in the reactor, until reaching the required temperature. The valve is controlled by the pressure of the tap water which is consumed very little, because the flow is strongly suppressed by the adjustable attenuator. Sample valve opens after closing the water supply. Analytical conical valve made of Teflon is separated from the water using a Teflon membrane reinforced with rubber layer.
Validation
Samples and certified reference materials (CRMs) were used to evaluate the precision and accuracy of the proposed system and method. The content of some selected elements (Ba, Ca, Cd, Cu, Fe, Mg, Mn, Na Pb, Sr, Zn) in digested solutions was determined by ultrasonic nebulization microwave induced plasma-optical emission spectrometry (USN-MIP-OES) technique. The certified reference (or information) values were available for most of analytes under investigation for assessment of the method accuracy. Quantification of selected elements was made from linear calibration curves.
and the digested solutions were analyzed by MIP-OES to determine element concentrations. The obtained results were compared with the certified values (CRMs).
MIP-OES analysis
The plasma was ignited by momentarily inserting an isolated high-purity tantalum wire into the quartz discharge tube and was allowed to warm up for a period of about 15 min prior to analysis. Aerosols, produced from liquids by the ultrasonic nebulizer, were immediately carried out by the argon carrier gas through the spray chamber and into the MIP for excitation in the Ar-He gases. Net analyte emissions were calculated by taking the simultaneous difference of measured emission intensities on the top of the peak and background near the peak. Analytical blanks were also carried through the entire procedure outlined above, to correct for possible contaminants in the reagents used for sample preparation. Quantification of Ba, Ca, Cd, Cu, Fe, Mg, Mn, Na, Pb, Sr and Zn was made from linear calibration curves. The residual carbon content (RCC) was determined at the 247.856 nm in solubilized solutions by MIP-OES according to conditions described in Table 1. All limits of detection (LOD) were calculated for raw, unsmoothed data based on a 3σ criterion of the background
(blank) counts. The LOD, corresponding to a measurement level 3σ above the mean blank intensity, was obtained by
using procedural blank solutions.
Results and Discussion
Establishment of MIP-OES operating conditions
The optimization of wavelength was not carried out because the wavelengths used for the determination were pre-selected by the producer of the polychromator.
The MIP is normally operated at low power levels in the range 50-150 W. Between 100 and 180 W, the intensities of spectral lines showed such a dependence on the power that this would point to a pronounced optimum. In general, for all analytical lines of elements studied, intensities of signals usually tent to level off after the microwave power approaching 180 W. As a result of this consideration on the above influences, an optimized power of 160 W was selected as an acceptable value and a practical working range.
The effect of plasma (support) helium gas flow rate was also optimized in our experiments. The maximum signal intensities for elements studied was observed at plasma flow rate of 200 mL min−1.
To optimize the carrier (nebulizing) argon gas flow for elements determination, the optimum flow was estimated
in the total range of 300-900 mL min−1. It was observed that the carrier gas stream flow rate has a more significant influence on the emission than the plasma support gas flow rate.
In general, it was observed that when the flow rate was ranged between 300-900 mL min−1, the emission intensities reached maximum at 600 mL min−1, and with further increase of the flow rate above these values, the emission intensities decreased for elements studied. Therefore, in this study, a 600 mL min−1 carrier argon flow rate was chosen.
Optimization of the solubilization parameters
The pressure electromagnetic induction heating flow solubilization system allows temperature and pressure setting. Since the reagents were initially heated to 45 °C in the mixing chamber the solubilization temperature was optimized in the range of 60-140 °C. While solubilization pressure was optimized in the range of 2-5 bar. The pressure set was achieved by reagent introduction to the system using peristaltic pump at a time when the back-pressure valve was closed. The temperatures lower than 100 °C and pressure lower than 2 bar resulted in a low solubilization efficiency. On the other hand when the temperature was over 130 °C flow became irregular due to bubbles formation in the radiator which resulted in periodic vapor releasing from the sample outlet (the sample and nitric acid mixture reached the boiling point). In turn when the pressure was higher than 3.5 bar the solubilization time significantly increased without an increase in the efficiency of sample decomposition. Therefore, an optimized temperature of 120 °C and pressure of 3.5 bar were selected as an acceptable value allowing to perform the efficient sample solubilization in 40 min.
Various CRMs were selected for solubilization. Arbitrarily, a slurry content of 30 g L-1 (3% m/v) was chosen. Various concentrations of HNO3 were investigated as the oxidizing medium for acid solubilization (as checked the recovery of inorganic elements from CRMs), and a concentration of 4 mol L-1 was chosen for acid solubilization. At this concentration, a series of solubilization were carried out without any clogging; in general, the system is suitable for the solubilization of samples that contain particulate matter.
for relatively quick reagents introduction to the mixing chamber and achieve the required pressure and hence efficient sample solubilization.
Efficiency of oxidation
The residual carbon content of a digest provides a convenient quantitative measure of the efficiency of oxidation attack of the sample. Typically, 17-21% organic carbon remained in a sample after solubilization in the pressure electromagnetic induction heating flow system. The results indicate that no complete oxidation of the samples occur. However, the MIP-OES method is a robust technique, therefore, no interferences from RCC was observed during the determination of the elements.
Analytical performance and method validation
Analytical performances were studied for the target elements under the optimal experimental conditions. The limit of detection (LOD) was calculated using the IUPAC recommendation (based on a 3σblank criterion), determined
by 6 repetitive measurements of the blank involving the entire process, process. The LODs were obtained by use
of the compromise operating conditions and summarized in Table 2.
The precision values, expressed as relative standard deviation (RSD, %) of six replicate measurements, was in the range of approximately 6% (evaluated as peak height).
The proposed method was validated by analyzing three certified reference materials: DOLT-2 (dogfish liver), IAEA-336 (lichen) and NIST 1549 (non-fat milk). The results obtained for the analysis of reference materials by the USN-MIP-OES method using both the external calibration technique and the technique of standard additions, are summarized in Table 3. All experimental concentrations agreed fairly well with the certified interval element values. This fact has been confirmed after applying the Student’s t-test (95% confidence interval). The precision of replicate determinations was typically around 6%.
Analysis of certified reference materials and real samples
The utility of the proposed method was further demonstrated by the determination of these elements in different matrix samples under optimized conditions shown in Tables 1 and 2. The results are also summarized in Tables 3 and 4. In all cases, calibration was performed
Table 3. Determination of elements (concentrations in µg g-1 ± SD of three parallel determinations) in reference materials using the USN-MIP- OES method
Element
Dogfish liver DOLT-2
Lichen IAEA-336
Non-fat milk NIST 1549
Found value / (µg g-1)
Certified value / (µg g-1)
Recovery / %
Found value / (µg g-1)
Certified value / (µg g-1)
Recovery / %
Found value / (µg g-1)
Certified value / (µg g-1)
Recovery / %
Ba − − − 6.3 ± 0.8 6.4 ± 1.1 98 − − −
Ca − − − − − − 1.28 ± 0.08% 1.30 ± 0.05% 99
Cd 19.8 ± 1.1 20.8 ± 0.5 95 < DLa 0.117 ± 0.017b − < DLa 0.0005 ± 0.0002 − Cu 25.2 ± 1.3 25.8 ± 1.1 98 3.7 ± 0.4 3.6 ± 0.5 103 0.7 ± 0.1 0.7 ± 0.1 100 Fe 1089 ± 50 1103 ± 47 99 428 ± 31 430 ± 50 100 1.81 ± 0.14 1.78 ± 0.10 102
Mg − − − − − − 0.121 ± 0.005% 0.120 ± 0.003% 101
Mn 6.59 ± 0.6 6.88 ± 0.56 96 62 ± 4 63 ± 7 98 < DLa 0.26 ± 0.06 −
Na − − − 329 ± 25 320 ± 40 103 0.486 ± 0.151% 0.497 ± 0.100% 98
Pb < DLa 0.22 ± 0.02 − 5.1 ± 0.5 4.9 ± 0.6a 104 < DLa 0.019 ± 003 –
Sr − − − 9.4 ± 1.0 9.3 ± 1.1 101 − − −
Zn 83.2 ± 3.9 85.8 ± 2.5 97 29.5 ± 2.3 30.4 ± 3.4 97 44.2 ± 31 46.1 ± 2.2 96 aBelow detection limit; b information (uncertified) value.
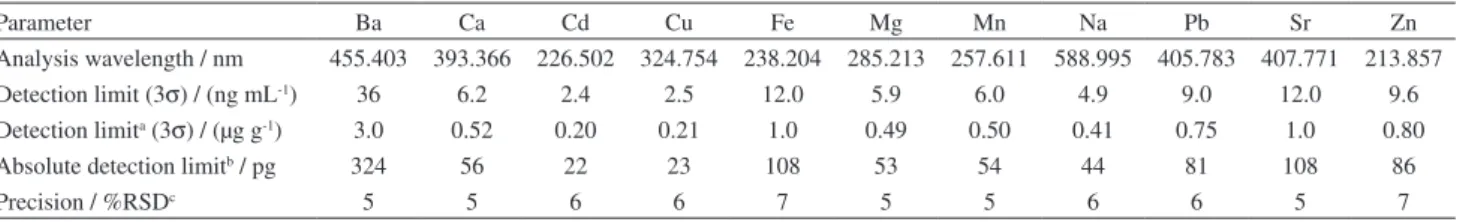
Table 2. Analytical figures of merit
Parameter Ba Ca Cd Cu Fe Mg Mn Na Pb Sr Zn
Analysis wavelength / nm 455.403 393.366 226.502 324.754 238.204 285.213 257.611 588.995 405.783 407.771 213.857 Detection limit (3σ) / (ng mL-1) 36 6.2 2.4 2.5 12.0 5.9 6.0 4.9 9.0 12.0 9.6 Detection limita (3σ) / (µg g-1) 3.0 0.52 0.20 0.21 1.0 0.49 0.50 0.41 0.75 1.0 0.80
Absolute detection limitb / pg 324 56 22 23 108 53 54 44 81 108 86
Precision / %RSDc 5 5 6 6 7 5 5 6 6 5 7
using external calibration methods. Precision of replicate determination was typically better than 6% RSD.
Conclusions
The use of pressurized flow solubilization system of various sample materials, as slurry samples, has been applied to the decomposition of elements from biological materials, hyphenated with the MIP-OES method, this technique was successfully applied to the determination of ng mL-1 levels of inorganic elements, in biological samples, with good accuracy and reproducibility. The setup was able to perform solubilization of slurries without clogging problems. Automation should be possible using an auto-sampler with ultrasonic stirring as commonly employed, for instance in electrothermal atomic absorption spectrometry (ETAAS), in order to inject representative (homogeneous) samples.
It may prove to be a useful new alternative to the conventional used off-line solubilization and microwave-assisted heating techniques.
Acknowledgements
Financial support by the National Science Centre (NCN) Poland (Grant No. UMO-2012/06/A/ST4/00382) is gratefully acknowledged.
References
1. Jankowski, K. J.; Reszke, E.; Microwave Induced Plasma Analytical Spectrometry; RSC Publishing: Cambridge, 2011. 2. Matusiewicz, H. In Sample Preparation for Trace Element
Analysis;Mester, Z.; Sturgeon, R., eds.; Elsevier: Amsterdam, 2003, ch. 6.
3. Kebbekus, B. B. In Sample Preparation Techniques in Analytical Chemistry;Mitra, S., ed.; John Wiley & Sons, Inc.: Hoboken, 2003, ch. 5.
4. Müller, E. I.; Mesko, M. F.; Moraes, D. P.; Korn, M. G. A.; Flores, E. M. M. In Microwave-Assisted Sample Preparation for Trace Element Determination; Moraes, E. M. F., ed.; Elsevier: Amsterdam, 2014, ch. 4.
5. Hoenig, M.; Talanta 2001, 54, 1021.
6. Zagatto, E. A. G.; Dias, A. C. B. In Trends in Sample Preparation;Arruda, M. A. Z., ed.; Nova Science Publishers, Inc.: New York, 2007, ch. 7.
7. Gluodenis, T. J.; Tyson Jr., J. F.; J.Anal. At. Spectrom. 1992, 7, 301.
8. Gräber, C.; Berndt, H.; J. Anal. At. Spectrom. 1999, 14,683. 9. Haiber, S.; Berndt, H.; Fresenius J. Anal. Chem. 2000, 368, 52. 10. Jacob, P.; Berndt, H.; J. Anal. At. Spectrom. 2002, 17,1615. 11. Bian, Q. Z.; Jacob, P.; Berndt, H.; Niemax, K. ; Anal. Chim.
Acta2005, 538,323.
12. Shao, L.; Gan, W.; Zhang, W.; Su, Q.; J. Anal. At. Spectrom. 2005,20,1296.
13. Han, S.; Gan, W.; Su, Q.; Talanta 2007,72,1481.
14. Shao, L.; Gan, W.; Su, Q.; Anal. Chim. Acta2006,562,128. 15. Han, S.; Gan, W.; Jiang, X.; Zi, H.; Su, Q.; J. Anal. At. Spectrom.
2008,23,773.
16. Xie, S.; Gan, W.; Huang, M.; Int. J. Environ. Anal. Chem.2014,
94, 1150.
17. Ha, S.; Gan, W.; Jiang, X.; Zi, H.; Su, Q.; Int. J. Environ. Anal. Chem. 2010,90,137.
18. Matusiewicz, H.; Fresenius J. Anal. Chem. 1996,355, 623. 19. Matusiewicz, H.; Golik, B.; Microchem. J.2004,76, 23. 20. Jin, Q.; Zhu, C.; Brushwyler, K.; Hieftje, G. M.; Appl. Spectrosc.
1990,44, 183.
Submitted: July 14, 2015 Published online: November 5, 2015
Table 4. Determination of elements (concentrations in µg g-1 ± SD of three parallel determinations) in real samples using the USN-MIP-OES method
Element Milk powder Barley Cinnamon
Found value / (µg g-1) Information value a / (µg g-1) Found value / (µg g-1) Found value / (µg g-1)
Ba < DLb − < DLb < DLb
Ca 5740 ± 245 5770 7540 ± 321 8968 ± 450
Cd < DLb − < DLb < DLb
Cu 3.4 ± 0.2 3.5 2.2 ± 0.3 9.2 ± 0.5
Fe 75.2 ± 4.0 78 21.6 ± 1.5 89.3 ± 5.9
Mg 516 ± 32 520 − 592 ± 33
Mn < DLb 0.77 7.45 ± 0.41 41.1 ± 3.2
Na 1870 ± 82 1900 19.1 ± 1.3 19.1 ± 1.3
Pb < DLb − < DLb 2.0 ± 0.3
Sr < DLb − < DLb < DLb
Zn 55.4 ± 3.1 57 15.1 ± 0.9 29.0 ± 1.5