BGD
9, 9637–9665, 2012Root growth ofLotus corniculatus B. Felderer et al.
Title Page
Abstract Introduction
Conclusions References
Tables Figures
◭ ◮
◭ ◮
Back Close
Full Screen / Esc
Printer-friendly Version
Interactive Discussion
Discussion
P
a
per
|
Dis
cussion
P
a
per
|
Discussion
P
a
per
|
Discussio
n
P
a
per
|
Biogeosciences Discuss., 9, 9637–9665, 2012 www.biogeosciences-discuss.net/9/9637/2012/ doi:10.5194/bgd-9-9637-2012
© Author(s) 2012. CC Attribution 3.0 License.
Biogeosciences Discussions
This discussion paper is/has been under review for the journal Biogeosciences (BG). Please refer to the corresponding final paper in BG if available.
Root growth of
Lotus corniculatus
interacts with P distribution in young
sandy soil
B. Felderer1, K. M. Boldt-Burisch2, B. U. Schneider3, R. F. J. H ¨uttl2, and R. Schulin1
1
Institute of Terrestrial Ecosystems, ETH, Z ¨urich, Switzerland
2
Soil Protection and Recultivation, Brandenburg University of Technology, Cottbus, Germany
3
Helmholtz Centre Potsdam – German GeoResearchCentre, Potsdam, Germany
Received: 18 June 2012 – Accepted: 20 June 2012 – Published: 31 July 2012
Correspondence to: B. Felderer ([email protected])
BGD
9, 9637–9665, 2012Root growth ofLotus corniculatus B. Felderer et al.
Title Page
Abstract Introduction
Conclusions References
Tables Figures
◭ ◮
◭ ◮
Back Close
Full Screen / Esc
Printer-friendly Version
Interactive Discussion
Discussion
P
a
per
|
Dis
cussion
P
a
per
|
Discussion
P
a
per
|
Discussio
n
P
a
per
|
Abstract
Large areas of land are restored with un-weathered soil substrates following mining activities in eastern Germany and elsewhere. In the initial stages of colonization of such land by vegetation, plant roots may become key agents in generating soil forma-tion patterns by introducing gradients in chemical and physical soil properties. On the
5
other hand, such patterns may be influenced by root growth responses to pre-existing substrate heterogeneities. In particular, the roots of many plants were found to pref-erentially proliferate into nutrient-rich patches. Phosphorus (P) is of primary interest in this respect because its availability is often low in unweathered soils, limiting especially the growth of leguminous plants. However, leguminous plants occur frequently among
10
the pioneer plant species on such soils as they only depend on atmospheric nitrogen (N) fixation as N source. In this study we investigated the relationship between root growth allocation of the legumeLotus corniculatus and soil P distribution on recently restored land. As test sites the experimental Chicken Creek Catchment (CCC) in east-ern Germany and a nearby experimental site (ES) with the same soil substrate were
15
used. We established two experiments with constructed heterogeneity, one in the field on the experimental site and the other in a climate chamber. In addition we conducted high-density samplings on undisturbed soil plots colonized by L. corniculatus on the ES and on the CCC. In the field experiment, we installed cylindrical ingrowth soil cores (4.5×10 cm) with and without P fertilization around single two-month-oldL. corniculatus
20
plants. Roots showed preferential growth into the P-fertilized ingrowth-cores. Preferen-tial root allocation was also found in the climate chamber experiment, where single
L. corniculatusplants were grown in containers filled with ES soil and where a lateral portion of the containers was additionally supplied with a range of different P concen-trations. In the high-density samplings, we excavated soil-cubes of 10×10×10 cm size
25
BGD
9, 9637–9665, 2012Root growth ofLotus corniculatus B. Felderer et al.
Title Page
Abstract Introduction
Conclusions References
Tables Figures
◭ ◮
◭ ◮
Back Close
Full Screen / Esc
Printer-friendly Version
Interactive Discussion
Discussion
P
a
per
|
Dis
cussion
P
a
per
|
Discussion
P
a
per
|
Discussio
n
P
a
per
|
remaining soil (root-distant soil). Root length density was negatively correlated with labile P (resin-extractable P) in the root-distant soil of the CCC plots and with water-soluble P in the root-distant soil of the ES plots. The results suggest that P depletion by root uptake during plant growth soon overrode the effect of preferential root allocation in the relationship between root density and plant-available soil P heterogeneity.
5
1 Introduction
Large areas of land are denuded of the original soil cover in the course of construction or mining projects and later restored, often using un-weathered soil substrates. The formation of spatial patterns in the physical and chemical properties of the developing soil during the initial stages of colonization by vegetation is an important aspect in the
10
restoration of such land. The development of root systems plays a particular role in these processes. Roots form pathways for water flow and solute transport and are a primary source of organic matter input into soil (Huetsch et al., 2002). Processes such as the release of organic compounds, protons and carbon dioxide, consumption of oxy-gen, uptake of nutrients and water can lead to steep gradients in chemical conditions
15
and biological activities around roots, a phenomenon well known as “rhizosphere effect” (Hinsinger et al., 2005). Such gradients can have a strong influence on the patterns of mineral weathering and transformation, formation of humus, and the development of physical soil structure. Equally strong influences may also occur in the opposite direc-tion, as pre-existing heterogeneities in soil properties can also shape the patterns of
20
root system development. For example, many plant species are known to respond to patchiness in the spatial distribution of growth-limiting nutrients by root proliferation in patches where these nutrients are enriched (Robinson, 1994).
Limitations in the availability of soil nitrogen (N) and phosphorus (P) are a particu-larly frequent condition during the early phases of ecosystem development (Vitousek
25
BGD
9, 9637–9665, 2012Root growth ofLotus corniculatus B. Felderer et al.
Title Page
Abstract Introduction
Conclusions References
Tables Figures
◭ ◮
◭ ◮
Back Close
Full Screen / Esc
Printer-friendly Version
Interactive Discussion
Discussion
P
a
per
|
Dis
cussion
P
a
per
|
Discussion
P
a
per
|
Discussio
n
P
a
per
|
the decomposition of organic matter. Many pioneer plants are legumes, which do not depend on soil N, as they live in symbiosis with N-fixing rhizobia in their roots. Most of them however have high requirements for P (Sprent et al., 1988).
Phosphorus is often distributed quite heterogeneously in soil on the scale of a root system (Farley and Fitter, 1999; Gallardo and Parama, 2007; Gross et al., 1995;
Jack-5
son and Caldwell, 1993). Laboratory and greenhouse experiments with constructed heterogeneities and/or split root systems have shown that localized P supply can in-duce preferential root proliferation in many plant species (Kume et al., 2006; Ma and Rengel, 2008; Ma et al., 2007; Robinson, 1994; Weligama et al., 2007). Some authors also studied preferential root growth in response to localized P fertilization in the field
10
(Eissenstat and Caldwell, 1988; Buman et al., 1994; Caldwell et al., 1996). In studies with artificially created heterogeneity the contrast in P concentrations between fertilized and non-fertilized soil patches was usually high. Little is known about the extent and relevance of preferential root growth in response to P patchiness under normal field conditions. Mou et al. (1995) analyzed three-dimensional root distributions in
monocul-15
tural Sweetgum Sprout and Loblolly pine plantations in relation to available soil P, K and N concentrations and found that the fine root densities of both tree species increased with P and K but not N concentrations in the topsoil.
In this study we had the opportunity to investigate the root allocation strategy of the legumeLotus corniculatus in the man-made 6-ha Chicken Creek Catchment (CCC),
20
which was established in 2005 in a Lusatian post-mininig landscape in Eastern Ger-many to study initial ecosystem development on freshly deposited non-weathered sub-strate on a catchment scale (Gerwin et al., 2009). Lotus corniculatus L. (bird’s foot trefoil) is a perennial herbaceous early-succession plant pioneering the colonization of post-mining landscapes in Lusatia.
25
BGD
9, 9637–9665, 2012Root growth ofLotus corniculatus B. Felderer et al.
Title Page
Abstract Introduction
Conclusions References
Tables Figures
◭ ◮
◭ ◮
Back Close
Full Screen / Esc
Printer-friendly Version
Interactive Discussion
Discussion
P
a
per
|
Dis
cussion
P
a
per
|
Discussion
P
a
per
|
Discussio
n
P
a
per
|
vegetation could also be experimentally manipulated. On this site we carried out the same mini-plot high-density sampling as on the CCC, but after growingL. corniculatus
in monoculture. In addition, we performed a factorial plot experiment on this site and a climate chamber experiment with constructed heterogeneities to test the response of
L. corniculatusto P-enriched soil also under more controlled conditions.
5
We expected that soil patches with elevated concentrations in P would induce pref-erential root allocation and that we would therefore find a positive correlation between root length density and soil P in the high-density samplings.
2 Materials and methods
2.1 Site description
10
The Chicken Creek Catchment (CCC) was constructed on a refilled open cast lignite mine about 30 km south of the city of Cottbus in the State of Brandenburg, Germany. After construction was finished in September 2005, the site was left to re-vegetate spontaneously. A detailed description of the establishment and initial development of the catchment was given by Gerwin et al. (2009). In order to enable also manipulative
15
and invasive field experiments with soil and plants under comparable conditions, the before-mentioned “Experimental Site” (ES) was established in 2009 in the vicinity of the CCC using substrate of the same origin.
The substrate deposited on the CCC and the ES as soil parent material was quar-ternary calcareous sand from Saale-time Pleistocene deposits of the Lusatian ridge
20
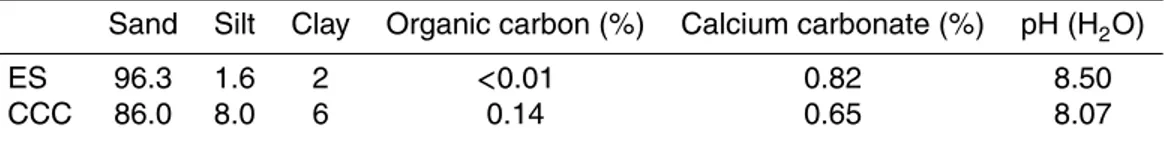
(in German: Lausitzer H ¨ohenr ¨ucken). The soil parameters of the substrate on the ES and the CCC are illustrated in Table 1. Soil parameters for the CCC derive from a soil sampling campaign conducted in 2005 (Gerwin et al., 2009) and are averaged values of sampling points proximate to the investigated plots, while soil parameters for the ES represent values taken from soil sampled at the investigated plots.
BGD
9, 9637–9665, 2012Root growth ofLotus corniculatus B. Felderer et al.
Title Page
Abstract Introduction
Conclusions References
Tables Figures
◭ ◮
◭ ◮
Back Close
Full Screen / Esc
Printer-friendly Version
Interactive Discussion
Discussion
P
a
per
|
Dis
cussion
P
a
per
|
Discussion
P
a
per
|
Discussio
n
P
a
per
|
The climate is temperate and slightly continental with high summer temperatures and pronounced drought periods during the growing season. The long-term average precipitation was given as 595 mm per year, and the mean air temperature as 9.3 °C (Gerwin et al., 2009). The main difference between the two sites was that the CCC was built as a large lysimeter with an impermeable clay liner at 2–3 m depth in order
5
to collect all water at the catchment outflow, while there was free drainage from the ES soil. Consequently, a water table developed in the subsurface of the CCC in contrast to the ES, and as the hydraulic conductivity of the deposited substrate was lower than predicted, the water table rose to higher levels than planned, and at times some water even influenced the lower parts of the root zone.
10
2.2 Climate chamber experiment
The climate chamber experiment was performed at ETH Z ¨urich. SingleL. cornicula-tus plantlets were grown in Al-containers of 27×27×1.2 cm internal volume (height ×width × depth) filled with soil from the experimental site. We established 6 homo-geneous soil treatments adding 5.7, 17, 34, 52, 85 or 102 mg P per pot (4, 12, 24,
15
37, 60 72 mg P kg−1 soil) and 8 heterogeneous soil treatments. In the latter we added
5.7, 11.3, 17, 34, 51, 68, 85 or 102 mg P pot−1, but only to a lateral third of the soil in
each container (12, 24, 36, 72, 109, 145, 182, 218 mg P kg−1soil in the P-enriched soil
area). Additionally, we established a control treatment with no P addition. All treatments were replicated three times, except for the highest heterogeneous treatment, which
20
was replicated only twice. Mono-calcium-phosphate (Ca(H2PO4)2·H20) was used as
fertilizer.
To fill the soil into the containers, we laid them down on one side and removed the upward looking lateral wall of the other side. Then the soil, which had been thoroughly mixed with respective amounts of fertilizer before, was filled in three vertical bands of
25
BGD
9, 9637–9665, 2012Root growth ofLotus corniculatus B. Felderer et al.
Title Page
Abstract Introduction
Conclusions References
Tables Figures
◭ ◮
◭ ◮
Back Close
Full Screen / Esc
Printer-friendly Version
Interactive Discussion
Discussion
P
a
per
|
Dis
cussion
P
a
per
|
Discussion
P
a
per
|
Discussio
n
P
a
per
|
position again. Care was taken to avoid pressing of the soil and to achieve a dry soil bulk density of approximately 1.6 g cm−3in all containers.
We planted a single pre-germinated seedling in the middle of each container, so that the distances to the left and the right compartment were the same. Plants were grown for 60 days in a climate chamber with a humidity of 60 %, a 16 : 8 h day : night cycle and
5
a respective 21/16 °C temperature cycle. During the day the photon flux was 250 µmol m−2s−1. We watered the container on a weight basis to 50 % water holding capacity
(approx. 100 hPa water suction).
At harvest, we cut the shoots close to the soil surface and dried them to constant weight at 60 °C. The roots were sampled separately from each third of the containers.
10
After thoroughly washing the soil from the roots, they were placed into a water bath and scanned with an Epson scanner (perfection V700, 400 dpi resolution). The scans were then analyzed for root length by means of WinRHIZO (Regent Instruments, Inc. Quebec Canada, version 2009a).
2.3 Ingrowth core experiment
15
We used the ingrowth core method for the factorial plot experiment with constructed P heterogeneities on the ES. SingleL. corniculatusplantlets were grown on 18 plots of 50×50 cm size, on which fertilized (as described below) and non-fertilized soil cores were installed in a regular grid at distances of 10, 22 and 33 cm from the plant stem in the center of each plot. Additionally, we established plots with homogeneous P
fertil-20
ization (applying the same P rate as to the soil of the fertilized cores in the other plots) of the entire topsoil and non-fertilized control plots in order to assess the potential P responsiveness ofL. corniculatuson the experimental site.
To prepare the plots for planting, we excavated and bulked the entire topsoil (0– 10 cm) of all plots, homogenized it thoroughly and divided it into two fractions. One
25
fraction was mixed with 27 mg P kg−1 soil, while the other fraction remained
BGD
9, 9637–9665, 2012Root growth ofLotus corniculatus B. Felderer et al.
Title Page
Abstract Introduction
Conclusions References
Tables Figures
◭ ◮
◭ ◮
Back Close
Full Screen / Esc
Printer-friendly Version
Interactive Discussion
Discussion
P
a
per
|
Dis
cussion
P
a
per
|
Discussion
P
a
per
|
Discussio
n
P
a
per
|
center of the plot was aligned with the center of the central square, his scheme re-sulted in 4, 8 and 4 ingrowth cores at 10, 22 and 33 cm distance from the center of the plot, respectively. Alternatively, half of the cylinders were filled with fertilized and unfertilized soil. After re-filling the space around the cylinders with unfertilized soil, the cylinders were carefully removed. Similarly, just without previous ingrowth core
instal-5
lation, homogenized soil with or without fertilization was filled back into the plots of the respective homogeneous treatments. Each treatment was replicated six times.
Two month before the experiment started, we sowedL. corniculatusseeds on the ES to establish a pool of candidate plantlets. From this pool we selected plantlets of similar size and habitus and transplanted them on 15 April 2009 to the experimental plots All
10
plots were weeded once weekly. On 1 October 2009, we harvested the shoots and sampled all ingrowth cores. After transfer to the laboratory, the roots were processed and analyzed in the same way as in the climate chamber experiment.
2.4 High density sampling on the Chicken Creek Catchment and the Experimental Site
15
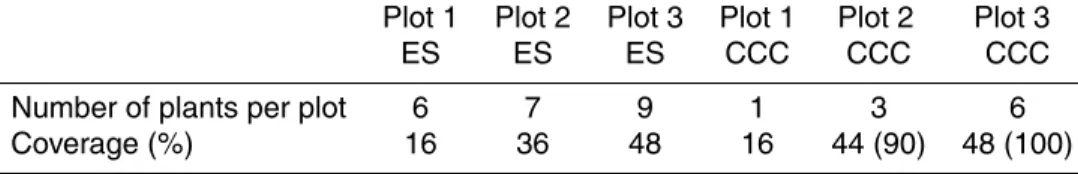
After manual removal of existing plants, three otherwise undisturbed 50×50 cm mini-plots were seeded withL. corniculatusin fall 2008 at low, medium and high density, as specified in Table 2. Keeping the plots clean from other plants also was the only manip-ulation of the plots during the growth of theL. corniculatusseedling. In spring 2009 the plants were harvested and the soil collected in 10×10×10 cm cubes. The same type of
20
sampling was performed on three mini-plots of the same size in May 2010 on the CCC, with the difference that in contrast to the ES plotsL. corniculatuswas present on these plots spontaneously. While plots were selected which were predominantly but sparsely populated withL. corniculatus, it was unavoidable that also other plants – exclusively grass species – were present as well.
25
BGD
9, 9637–9665, 2012Root growth ofLotus corniculatus B. Felderer et al.
Title Page
Abstract Introduction
Conclusions References
Tables Figures
◭ ◮
◭ ◮
Back Close
Full Screen / Esc
Printer-friendly Version
Interactive Discussion
Discussion
P
a
per
|
Dis
cussion
P
a
per
|
Discussion
P
a
per
|
Discussio
n
P
a
per
|
laboratory, where they were stored in a refrigerator at 4 °C, until they were further pro-cessed and analyzed within the following 1–4 weeks. Roots with adherent field-moist soil were separated from the remaining soil, in the following referred to asroot-distant soil, by means of a 4 mm sieve. Grass roots in the CCC samples were easily distin-guished and separated fromL. corniculatusroots. Grass roots and the soil attached to
5
these roots was excluded from soil or root analysis.The soil adhering to the roots, in the following referred to asroot-adjacent soil, was left to air-dry for 5 min and then gen-tly removed using a brush.Root-adjacent and root-distant soil samples were stored separately in small parchment paper bags for subsequent chemical analyses. After thorough washing, the roots the roots were analyzed in the same way as in the
experi-10
ments described before.
Water soluble P and calcium (Ca) concentrations and the pH of root-distant and root adjacent soil samples were analyzed in 1 : 2.5 soil-to-solution extracts, using bi-distilled water for extraction (Meiwes et al., 1984). After adding the water, the slurries were shaken for 1 h and then left to settle for 16 h at room temperature, centrifuged
15
for 5 min at 3000 rpm and filtered (512 ½ folding filter, Whatman; Dassel, Germany) following the method of Schlichting et al. (1995). The filtrates were analyzed for Ca and P by means of inductive coupled plasma spectrometry (iCAP 6000 series, Thermo scientific, Germany). The CCC samples were also analyzed for anion- and cation-resin extractable P using the method of Saggar et al. (1990). Phosphorus concentrations in
20
solution were determined photometrically (Van Veldhoven and Mannaerts, 1987). In the following we refer to the resin-extractable P as labile P.
2.5 Statistical analysis and calculations
We used normal quantile-quantile plots to check for deviations from normal distribution of random effects and residual errors. The labile P, water-soluble P and root length data
25
BGD
9, 9637–9665, 2012Root growth ofLotus corniculatus B. Felderer et al.
Title Page
Abstract Introduction
Conclusions References
Tables Figures
◭ ◮
◭ ◮
Back Close
Full Screen / Esc
Printer-friendly Version
Interactive Discussion
Discussion
P
a
per
|
Dis
cussion
P
a
per
|
Discussion
P
a
per
|
Discussio
n
P
a
per
|
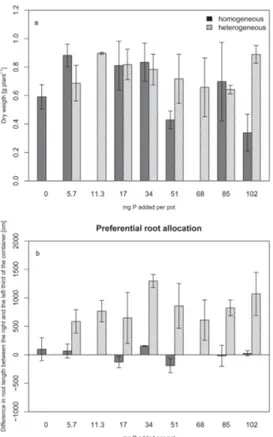
In the climate chamber experiment, we calculated root allocation as the difference of root length in the right third of the container (fertilized in the heterogeneous treatments) and the left third (unfertilized in the heterogeneous treatments). We used the protected Fisher LSD test for multiple comparisons. If the lower boundary of the 95 % confidence interval was greater than zero, root allocation was considered preferential.
5
The datasets of the high-density samplings were analyzed separately for the two sites. We standardized root length and soil parameters by plots to achieve mean values of 0 and variances of 1 for all parameters on each plot. Then we pooled the standard-ized data of the three plots of each site and calculated Pearson correlation coefficients of the soil parameters, distance from the stem and root length. Distance from the stem
10
of a sampled cube was calculated as the distance from the center of the cube con-taining the nearest plant and the center of the cube in question. Rhizosphere effects for labile P, water-soluble P, Ca and pH were determined as the difference between concentrations of the root-adjacent and root-distant soil in a cube sample.
3 Results
15
3.1 Climate chamber experiment
The growth habitus of the experimental plants showed considerable variation in the climate chamber experiment, indicating substantial genotypic variability among the seeds. As a result, neither heterogeneous nor homogeneous P fertilization showed a significant influence on shoot dry-weight production (ANOVA,p <0.05). At low P supply
20
shoot biomass tended to increase with increasing level of fertilization (Fig. 1a).
In the heterogeneous treatments, root length was always significantly higher in the P-fertilized part of the containers than in the unfertilized part (Fig. 1b). In the homoge-neous treatments, root length, as to be expected, did not significantly differ between the two sides of the containers. Despite the large variability in plant growth, the experiment
25
BGD
9, 9637–9665, 2012Root growth ofLotus corniculatus B. Felderer et al.
Title Page
Abstract Introduction
Conclusions References
Tables Figures
◭ ◮
◭ ◮
Back Close
Full Screen / Esc
Printer-friendly Version
Interactive Discussion
Discussion
P
a
per
|
Dis
cussion
P
a
per
|
Discussion
P
a
per
|
Discussio
n
P
a
per
|
3.2 Ingrowth core experiment
As we selected the plants according to their size, growth habitus and leaf shape for the ingrowth core field experiment, it can be assumed that they were genetically much more homogeneous than in the climate chamber experiment. Fresh-weight production of the shoot biomass was 2.5 times higher in the homogeneous P fertilization treatment
5
than in the ingrowth core and control treatments (Fig. 2a).
Root length was larger in the P fertilized ingrowth cores than in the unfertilized cores (2-way ANOVA, p <0.05) and decreased with increasing distance from the stems of
the plants (2-way ANOVA,p <0.05). As Fig. 2b shows, the effect of P on root length
production was strongest close to the plant stems and decreased with distance. The
10
gradient of decrease appeared to be larger for the P fertilized cores than the control cores, but the interaction between P fertilization and distance from the stem was not significant.
3.3 High density samplings
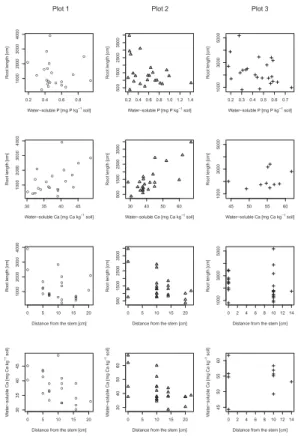
Root length density did not significantly change with distance from the stems on the
15
CCC plots (Table 4) , while it decreased with increasing distance from the stems on the ES plots (Table 3, Fig. 3). Root length density also decreased with increasing water-soluble P on the ES plots, while no correlation between these two variables was found on the CCC plots. A similar negative relationship as between water-soluble P and root length density on the ES was found between labile P and root length density on the
20
CCC (Fig. 4). In contrast to the finding that the relationships of root length density with stem distance and water-soluble P were both negative, water-soluble P was not affected by stem distance on the ES plots. But distance from the stem had a positive effect on labile P on the CCC, while it showed no influence on water-soluble P. Soil Ca concentration increased with root length density on the ES plots and decreased
25
BGD
9, 9637–9665, 2012Root growth ofLotus corniculatus B. Felderer et al.
Title Page
Abstract Introduction
Conclusions References
Tables Figures
◭ ◮
◭ ◮
Back Close
Full Screen / Esc
Printer-friendly Version
Interactive Discussion
Discussion
P
a
per
|
Dis
cussion
P
a
per
|
Discussion
P
a
per
|
Discussio
n
P
a
per
|
Water-soluble Ca was in average 28 mg kg−1higher in adjacent soil than in
root-distant soil on the ES (Fig. 5), while the pH of root adjacent soil was in average 0.4 units lower than the pH of root-distant soil. A similar but weaker rhizosphere effect on water-soluble Ca as in the ES soil was also found in the Chicken Creek samples, whereas no consistent effect on pH was detected. While we found no significant rhizosphere effect
5
on water-soluble P in ES soil, it tended to be higher in root-adjacent than in root-distant soil for all three plots. In contrast to this trend, water-soluble P concentrations tended to be slightly lower in root-adjacent than in root-distant Chicken Creek soil. On the other hand, labile P was higher in root-adjacent than in root-distant soil of the Chicken Creek plots, similarly to the rhizosphere effect on water-soluble P of the ES soil.
10
4 Discussion
The results of the fertilization experiment on the ES area clearly show that low soil P was limiting the growth ofL. corniculatusin the unfertilized soil and thatL. corniculatus
responds with root proliferation into P-enriched soil under these conditions. The climate chamber experiment, where all other heterogeneities had been evened out by soil
ho-15
mogenization, confirmed that preferential allocation of root growth is indeed a response ofL. corniculatusthat can be induced by heterogeneous P. distribution. The ability to respond to locally increased P availability with enhanced root proliferation has been shown also for many other plant species (Ma and Rengel, 2008; Ma et al., 2007; Kume et al., 2006; Robinson, 1994; Weligama et al., 2007) in climate chamber experiments,
20
but seldom in the field (Eissenstat and Caldwell, 1988; Buman et al., 1994).
The negative correlations of root length density with labile P and water-soluble P in the root-distant soil on the high-density sampling plots of the two field sites is in direct contrast to the results of the experiments with constructed heterogeneity. They suggest that plant-available soil P was quite rapidly depleted by root uptake and that
25
BGD
9, 9637–9665, 2012Root growth ofLotus corniculatus B. Felderer et al.
Title Page
Abstract Introduction
Conclusions References
Tables Figures
◭ ◮
◭ ◮
Back Close
Full Screen / Esc
Printer-friendly Version
Interactive Discussion
Discussion
P
a
per
|
Dis
cussion
P
a
per
|
Discussion
P
a
per
|
Discussio
n
P
a
per
|
Furthermore, it indicates that the influence of the roots extended into zones around the roots beyond our operationally defined root-adjacent soil. The negative correlation between root length and labile and water-soluble P is also in contrast to the results of Mou et al. (1995), who found a positive correlation between root length growth and soil P in Loblolly Pine and Sweetgum monocultures. However, in contrast to our sites, these
5
stands were already in in a stage of ecosystem development in which P recycling with root and shoot litter decomposition probably is a major process determining P distribu-tion in soil. Recycling of P by litter decomposidistribu-tion could result in high contrasts between P-rich and P-poor patches, as P is extracted from the entire volume of soil colonized by roots, but the relation with necromass decomposition would be concentrated according
10
to the mass of the decaying roots.
Comparing the results of the high-density samplings with those of the experiments with constructed heterogeneities, it must be considered that the variation in plant-available soil P was in average much smaller in the undisturbed field soil than the con-trasts between fertilized and non-fertilized soil in the latter experiments. Furthermore,
15
the plants sampled on the CCC had much more time to develop their root systems and extract soil P than in the ingrowth core and the climate chamber experiment. Thus, it is quite plausible that preferential root allocation into initially P-rich occurred, but was subsequently masked by the opposite effect of P depletion. It is also conceivable that P heterogeneity in the undisturbed field soils was too small to trigger preferential root
20
growth allocation in P-enriched soil zones. Several authors investigating root distribu-tions in relation to soil nutrient distribudistribu-tions suggested that P heterogeneity in their study soils was too low to become relevant for root allocation in herbaceous plants, but not for trees (Farley and Fitter, 1999; Gallardo and Parama, 2007; Gross et al., 1995).
In apparent contrast to the notion that P becomes depleted with time in the
rhizo-25
BGD
9, 9637–9665, 2012Root growth ofLotus corniculatus B. Felderer et al.
Title Page
Abstract Introduction
Conclusions References
Tables Figures
◭ ◮
◭ ◮
Back Close
Full Screen / Esc
Printer-friendly Version
Interactive Discussion
Discussion
P
a
per
|
Dis
cussion
P
a
per
|
Discussion
P
a
per
|
Discussio
n
P
a
per
|
al., 2011b). Given that P is a rather immobile nutrient element in soil, the direct influ-ence of roots on P concentrations only extends a few mm at most into the adjacent rhizosphere soil (Hinsinger et al., 2011b). By exudation of organic acids such as citric acid, which diffuse into the surrounding rhizosphere soil and mobilize phosphate from solid phases, plants can substantially increase the flux of soil P to their roots. Such
5
solubilization can result in higher average concentrations of labile or water-soluble P in the rhizosphere than in the bulk soil, even when the total P concentration is reduced and despite a concentration gradient in dissolved P towards the root surface. Support for this interpretation comes from findings of P depletion in the rhizosphere immediately adjacent to the root surface and P enrichment above bulk soil level in the outer zone
10
of the rhizosphere just a few mm farther (Hinsinger and Gilkes, 1996; Hinsinger et al., 2011b; Hubel and Beck, 1993).
Whether accumulation or depletion of P is found in the rhizosphere, thus, may also depend on the extent to which soil adjacent to the root surface is included in “rhizo-sphere” soil samples and explain why some authors found depletion of P and others
15
accumulation of P in the rhizosphere. (Hinsinger et al., 2011a) suggest that the inter-action of P uptake rate and P solubilization through exudates are responsible for P concentration pattern.
While lower water-soluble or labile P concentrations in distant than in the root-adjacent soil can be explained by P solubilization through root exudates, the
rhizo-20
sphere effect does not explain the negative correlation observed between root density and labile or water-soluble P in the root-distant soil. A likely candidate would be soil P extraction via arbuscular mycorrhizal fungi (AMF). Extraradical mycorrhizal hyphae can grow far beyond the zone directly influenced by the roots and extract P from soil up to 10 cm away from the root surface (Jansa et al., 2005). Mycorrhizal fungi can contribute
25
BGD
9, 9637–9665, 2012Root growth ofLotus corniculatus B. Felderer et al.
Title Page
Abstract Introduction
Conclusions References
Tables Figures
◭ ◮
◭ ◮
Back Close
Full Screen / Esc
Printer-friendly Version
Interactive Discussion
Discussion
P
a
per
|
Dis
cussion
P
a
per
|
Discussion
P
a
per
|
Discussio
n
P
a
per
|
explain that P depletion increased with root length density in the root-distant soil. In-deed we found that the roots of three randomly selectedL. corniculatusplantlets were colonized with AMF in the climate chamber experiment.
While the positive rhizosphere effect on labile P in the CCC plots was in line with the corresponding effect on water-soluble P in the ES plots, it was surprising that the
5
rhizosphere at the same time had the opposite effect on water-soluble P, a fraction closely related to labile P, in the CCC soil. This puzzling result may be explained by the different water regimes of the two sites and their effect on soil carbonate dynamics. The CCC was under the influence of a fluctuating groundwater table in the subsoil, in contrast to the ES. At times, the water table was high enough that through the capillary
10
fringe above the water table even topsoil roots could probably tap into this source dur-ing some periods. Thus, the vegetation on the CCC plots could consume much more water than on the ES, and this transpirational water stream could result in a substan-tial upward flow of calcium carbonate saturated solution from the groundwater table to the roots at certain times. Calcium supplied in excess of plant uptake (Hinsinger
15
et al., 2005). would have accumulated in the rhizosphere and eventually precipitated as CaCO3, in particular when the partial pressure of CO2 decreased during drying phases. Thus, the pH buffer capacity provided by CaCO3was periodically replenished
in the rhizosphere of the CCC plots, maintaining pH at similar or even higher levels as in the bulk soil and keeping water-soluble P at correspondingly low levels. In contrast, as
20
the buffer was gradually depleted, pH values decreased and water-soluble P concen-trations increased in the rhizosphere of the ES plots (Fig. 4). The fact that, unlike the concentration of water-soluble P, the concentration of resin-extractable P was higher in the rhizosphere than in the bulk soil of the CCC plots suggests that a comparatively large fraction of this P had been mobilized from less available P pools by root exudates
25
and bound in labile, but not water-soluble form, e.g. on ion-exchanging sites.
BGD
9, 9637–9665, 2012Root growth ofLotus corniculatus B. Felderer et al.
Title Page
Abstract Introduction
Conclusions References
Tables Figures
◭ ◮
◭ ◮
Back Close
Full Screen / Esc
Printer-friendly Version
Interactive Discussion
Discussion
P
a
per
|
Dis
cussion
P
a
per
|
Discussion
P
a
per
|
Discussio
n
P
a
per
|
from the stems with plant age. This could be a response to increasing nutrient depletion in soil around older parts of a root system, as long as zones farther away are still more abundant in nutrients and water. Indeed, we found a decrease of labile P in the root-distant soil with distance from stems on the CCC. Most authors investigating herbaceous plants or grasses found that root length density decreased with distance
5
from stem after one growing season (Buman et al., 1994; Majdi et al., 1992; Milchunas et al., 1992). But they did not study perennial growth. For trees, some authors found that within the sampled range the distance from the stem had no influence on root length density (Millikin and Bledsoe, 1999). In line with our observations, these findings suggest that an initial dependence of root density on stem distance disappears with
10
plant age.
5 Conclusions
The experiments with constructed heterogeneity clearly showed that L. corniculatus
preferentially allocated roots into P-enriched soil zones in the low P soils of this study. The results of the high-density samplings on the other hand indicate that P depletion
15
by roots and probably also mycorrhizal fungi had a more dominating influence on the spatial relationship between root length density and soil P concentrations in the field soil without constructed P heterogeneity. Assuming that also L. corniculatus plants grown on CCC and unfertilized ES soil preferentially allocated roots into P-enriched soil zones, this means that depletion of these regions by root P uptake subsequently
20
turned these soil areas into patches with decreased P availability compared to the surrounding. While the combined effect of preferential root growth and soil P depletion by roots is expected to reduce contrasts between soil patches of higher and lower P-availability during the initial stages of soil development, other processes may oppose this trend by the generation of new and even stronger heterogeneities, in particular
25
BGD
9, 9637–9665, 2012Root growth ofLotus corniculatus B. Felderer et al.
Title Page
Abstract Introduction
Conclusions References
Tables Figures
◭ ◮
◭ ◮
Back Close
Full Screen / Esc
Printer-friendly Version
Interactive Discussion
Discussion
P
a
per
|
Dis
cussion
P
a
per
|
Discussion
P
a
per
|
Discussio
n
P
a
per
|
Acknowledgements. The study is part of the Transregional Collaborative Research Centre 38 (SFB/TRR 38) which is financially supported by the Deutsche Forschungsgemeinschaft (DFG, Bonn) and the Brandenburg Ministry of Science, Research and Culture (MWFK, Potsdam). We thank Vattenfall Europe Mining AG for providing the research sites CCC and ES. We express our thanks also to Simone Fritsch for field work and Andreas Papritz for statistical assistance. 5
References
Buman, R. A., Schumacher, T. E., and Riedell, W. E.: A modified soil monolith technique for characterizing root systems, Crop Sci., 34, 296–299, 1994.
Caldwell, M. M., Manwaring, J. H., and Durham, S. L.: Species interactions at the level of fine roots in the field: Influence of soil nutrient heterogeneity and plant size, Oecologia, 106, 10
440–447, doi:10.1007/bf00329699, 1996.
Eissenstat, D. M. and Caldwell, M. M.: Seasonal timing of root-growth in favorable microsites, Ecology, 69, 870–873, doi:10.2307/1941037, 1988.
Farley, R. A. and Fitter, A. H.: Temporal and spatial variation in soil resources in a deciduous woodland, J. Ecol., 87, 688–696, doi:10.1046/j.1365-2745.1999.00390.x, 1999.
15
Gallardo, A. and Parama, R.: Spatial variability of soil elements in two plant communities of NW Spain, Geoderma, 139, 199–208, doi:10.1016/j.geoderma.2007.01.022, 2007.
Gerwin, W., Schaaf, W., Biemelt, D., Fischer, A., Winter, S., and Huettl, R. F.: The ar-tificial catchment ”Chicken Creek” (Lusatia, Germany)-a landscape laboratory for in-terdisciplinary studies of initial ecosystem development, Ecol. Eng., 35, 1786–1796, 20
doi:10.1016/j.ecoleng.2009.09.003, 2009.
Gross, K. L., Pregitzer, K. S., and Burton, A. J.: Spatial variation in nitrogen availability in 3 successional plant-communities, J. Ecol., 83, 357–367, doi:10.2307/2261590, 1995.
Hendriks, L., Claassen, N., and Jungk, A.: Phosphate-depletion at the soil-root interface and the phosphate-uptake of maize and rape, Z. Pflanzen. Bodenk., 144, 486–499, 25
doi:10.1002/jpln.19811440507, 1981.
BGD
9, 9637–9665, 2012Root growth ofLotus corniculatus B. Felderer et al.
Title Page
Abstract Introduction
Conclusions References
Tables Figures
◭ ◮
◭ ◮
Back Close
Full Screen / Esc
Printer-friendly Version
Interactive Discussion
Discussion
P
a
per
|
Dis
cussion
P
a
per
|
Discussion
P
a
per
|
Discussio
n
P
a
per
|
Hinsinger, P., Gobran, G. R., Gregory, P. J., and Wenzel, W. W.: Rhizosphere geometry and heterogeneity arising from root-mediated physical and chemical processes, New Phytol., 168, 293–303, doi:10.1111/j.1469-8137.2005.01512.x, 2005.
Hinsinger, P., Betencourt, E., Bernard, L., Brauman, A., Plassard, C., Shen, J. B., Tang, X. Y., and Zhang, F. S.: P for two, sharing a scarce resource: Soil phosphorus ac-5
quisition in the rhizosphere of intercropped species, Plant Physiol., 156, 1078–1086, doi:10.1104/pp.111.175331, 2011a.
Hinsinger, P., Brauman, A., Devau, N., Gerard, F., Jourdan, C., Laclau, J. P., Le Cadre, E., Jaillard, B., and Plassard, C.: Acquisition of phosphorus and other poorly mobile nutrients by roots. Where do plant nutrition models fail?, Plant Soil, 348, 29–61, doi:10.1007/s11104-10
011-0903-y, 2011b.
Hubel, F. and Beck, E.: In-situ determination of the P-relations around the primary root of maize with respect to inorganic and phytate-P, Plant Soil, 157, 1–9, 1993.
Huetsch, B. W., Augustin, J., and Merbach, W.: Plant rhizodeposition: An important source for carbon turnover in soils, Journal of Plant Nutrition and Soil Science, 165, 397–407, 2002. 15
Jackson, R. B. and Caldwell, M. M.: Geostatistical patterns of soil heterogeneity around indi-vidual perennial plants, J. Ecol., 81, 683–692, 1993.
Jansa, J., Mozafar, A., and Frossard, E.: Phosphorus acquisition strategies within arbus-cular mycorrhizal fungal community of a single field site, Plant Soil, 276, 163–176, doi:10.1007/s11104-005-4274-0, 2005.
20
Kume, T., Sekiya, N., and Yano, K.: Heterogeneity in spatial P-distribution and foraging capabil-ity byZea mays: Effects of patch size and barriers to restrict root proliferation within a patch, Ann. Bot., 98, 1271–1277, doi:10.1093/aob/mcl216, 2006.
Ma, Q. and Rengel, Z.: Phosphorus acquisition and wheat growth are influenced by shoot phosphorus status and soil phosphorus distribution in a split-root system, J. Plant Nutr. Soil 25
Sci.-Z. Pflanzenernahr. Bodenkd., 171, 266–271, doi:10.1002/jpln.200700183, 2008. Ma, Q. F., Rengel, Z., and Bowden, B.: Heterogeneous distribution of phosphorus and
potassium in soil influences wheat growth and nutrient uptake, Plant Soil, 291, 301–309, doi:10.1007/s11104-007-9197-5, 2007.
Majdi, H., Smucker, A. J. M., and Persson, H.: A comparison between minirhizotron and mono-30
BGD
9, 9637–9665, 2012Root growth ofLotus corniculatus B. Felderer et al.
Title Page
Abstract Introduction
Conclusions References
Tables Figures
◭ ◮
◭ ◮
Back Close
Full Screen / Esc
Printer-friendly Version
Interactive Discussion
Discussion
P
a
per
|
Dis
cussion
P
a
per
|
Discussion
P
a
per
|
Discussio
n
P
a
per
|
Meiwes, K. J., K ¨onig, N., Khanna, P. K., Pretzel, L., and Ulrich, B.: Chemische Unter-suchungsverfahren f ¨ur Mineralboden, Auflagehumus und Wurzeln, Ber. D. Forschungszen-trums, Wald ¨okosysteme, 7, 1984.
Milchunas, D. G., Lee, C. A., Lauenroth, W. K., and Coffin, D. P.: A comparison of C-14, Rb-86, and total excavation for determination of root distributions of individual plants, Plant Soil, 144, 5
125–132, doi:10.1007/bf00018853, 1992.
Millikin, C. S. and Bledsoe, C. S.: Biomass and distribution of fine and coarse roots from blue oak (Quercus douglasii) trees in the northern Sierra Nevada foothills of California, Plant Soil, 214, 27–38, 1999.
Mou, P., Jones, R. H., Mitchell, R. J., and Zutter, B.: Spatial-distribution of roots in sweetgum 10
and loblolly-pine monocultures and relations with aboveground biomass and soil nutrients, Funct. Ecol., 9, 689–699, doi:10.2307/2390162, 1995.
Robinson, D.: The responses of plants to nonuniform supplies of nutrients, New Phytol., 127, 635–674, 1994.
Saggar, S., Hedley, M. J., and White, R. E.: A simplified resin membrane technique for extracting 15
phosphorus from soils, Fertilizer Research, 24, 173–180, 1990.
Schlichting, E., Blume, H. P., and Stahr, K.: Bodenkundliches Praktikum. 2. Auflage, Blackwell, 1995.
Smith, S. E., Smith, F. A., and Jakobsen, I.: Functional diversity in arbuscular mycorrhizal (AM) symbioses: The contribution of the mycorrhizal P uptake pathway is not corre-20
lated with mycorrhizal responses in growth or total P uptake, New Phytol., 162, 511–524, doi:10.1111/j.1469-8137.2004.01039.x, 2004.
Sprent, J. I., Becana, M., and Sutherland, J. M.: Optimizing nitrogen fixation in legume crops and trees, Bothe, h., f. J. De Bruijn and w. E. Newton, 725–734, 1988.
Van Veldhoven, P. P. and Mannaerts, G. P.: Inorganic and organic phosphate measurements in 25
the nanomolar range, Anal. Biochem., 161, 45–48, 1987.
Vitousek, P. M., Porder, S., Houlton, B. Z., and Chadwick, O. A.: Terrestrial phosphorus limita-tion: Mechanisms, implications, and nitrogen-phosphorus interactions, Ecol. Appl., 20, 5–15, doi:10.1890/08-0127.1, 2010.
Wang, Z. Y., Kelly, J. M., and Kovar, J. L.: Depletion of macro-nutrients from rhizosphere soil 30
BGD
9, 9637–9665, 2012Root growth ofLotus corniculatus B. Felderer et al.
Title Page
Abstract Introduction
Conclusions References
Tables Figures
◭ ◮
◭ ◮
Back Close
Full Screen / Esc
Printer-friendly Version
Interactive Discussion
Discussion
P
a
per
|
Dis
cussion
P
a
per
|
Discussion
P
a
per
|
Discussio
n
P
a
per
|
Table 1.Soil parameters of the Experimental Site (ES) and the Chicken Creek Catchment
(CCC).
Sand Silt Clay Organic carbon (%) Calcium carbonate (%) pH (H2O)
ES 96.3 1.6 2 <0.01 0.82 8.50
BGD
9, 9637–9665, 2012Root growth ofLotus corniculatus B. Felderer et al.
Title Page
Abstract Introduction
Conclusions References
Tables Figures
◭ ◮
◭ ◮
Back Close
Full Screen / Esc
Printer-friendly Version
Interactive Discussion
Discussion
P
a
per
|
Dis
cussion
P
a
per
|
Discussion
P
a
per
|
Discussio
n
P
a
per
|
Table 2.Number ofL. corniculatusplants and coverage (%) per plot (50×50 cm) at the
exper-imental site (ES) and Chicken Creek Catchment (CCC) for low (plot 1), intermediate (plot 2) and high (plot 3) vegetation density. For the coverage of plot 2 and plot 3 on the CCC numbers in brackets refer to the coverage ofL. corniculatusplus the co-occurring grass species.
Plot 1 Plot 2 Plot 3 Plot 1 Plot 2 Plot 3
ES ES ES CCC CCC CCC
Number of plants per plot 6 7 9 1 3 6
BGD
9, 9637–9665, 2012Root growth ofLotus corniculatus B. Felderer et al.
Title Page
Abstract Introduction
Conclusions References
Tables Figures
◭ ◮
◭ ◮
Back Close
Full Screen / Esc
Printer-friendly Version
Interactive Discussion
Discussion
P
a
per
|
Dis
cussion
P
a
per
|
Discussion
P
a
per
|
Discussio
n
P
a
per
|
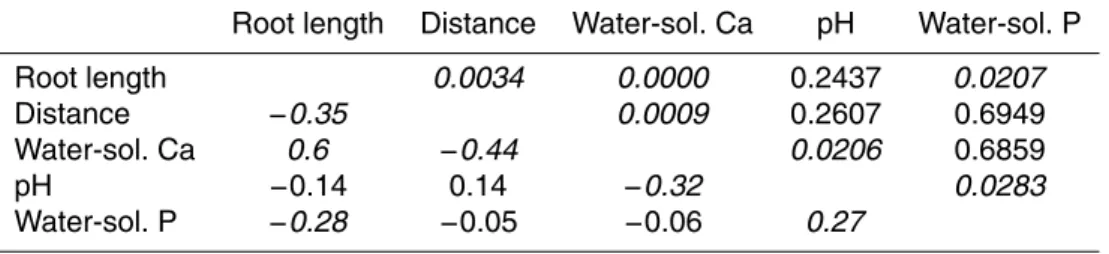
Table 3.Pearson correlation coefficients (lower part of the table) and p-values (upper part of
the table) for root length, distance from the stem, water-soluble Ca, pH and water-soluble P on the Experimental Site (ES). The numbers in italic indicate significant correlation between two variables (p <0.05).
Root length Distance Water-sol. Ca pH Water-sol. P
Root length 0.0034 0.0000 0.2437 0.0207
Distance −0.35 0.0009 0.2607 0.6949
Water-sol. Ca 0.6 −0.44 0.0206 0.6859
pH −0.14 0.14 −0.32 0.0283
BGD
9, 9637–9665, 2012Root growth ofLotus corniculatus B. Felderer et al.
Title Page
Abstract Introduction
Conclusions References
Tables Figures
◭ ◮
◭ ◮
Back Close
Full Screen / Esc
Printer-friendly Version
Interactive Discussion
Discussion
P
a
per
|
Dis
cussion
P
a
per
|
Discussion
P
a
per
|
Discussio
n
P
a
per
|
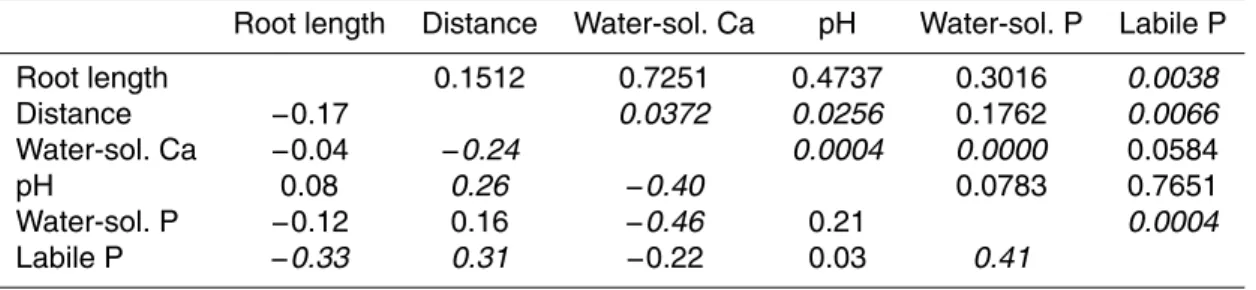
Table 4.Pearson correlation coefficients (lower part of the table) and p-values (upper part of
the table) for root length, distance from the stem, water-soluble Ca, pH and water-soluble P on the Chicken Creek Catchment (CCC). The numbers in italic indicate significant correlations between two variables (p <0.05).
Root length Distance Water-sol. Ca pH Water-sol. P Labile P
Root length 0.1512 0.7251 0.4737 0.3016 0.0038
Distance −0.17 0.0372 0.0256 0.1762 0.0066
Water-sol. Ca −0.04 −0.24 0.0004 0.0000 0.0584
pH 0.08 0.26 −0.40 0.0783 0.7651
Water-sol. P −0.12 0.16 −0.46 0.21 0.0004
BGD
9, 9637–9665, 2012Root growth ofLotus corniculatus B. Felderer et al.
Title Page
Abstract Introduction
Conclusions References
Tables Figures
◭ ◮
◭ ◮
Back Close
Full Screen / Esc
Printer-friendly Version
Interactive Discussion
Discussion
P
a
per
|
Dis
cussion
P
a
per
|
Discussion
P
a
per
|
Discussio
n
P
a
per
|
Fig. 1. (a)Shoot dryweight production ofL. corniculatusgrown in containers filled
BGD
9, 9637–9665, 2012Root growth ofLotus corniculatus B. Felderer et al.
Title Page
Abstract Introduction
Conclusions References
Tables Figures
◭ ◮
◭ ◮
Back Close
Full Screen / Esc
Printer-friendly Version
Interactive Discussion
Discussion
P
a
per
|
Dis
cussion
P
a
per
|
Discussion
P
a
per
|
Discussio
n
P
a
per
|
Fig. 2. (a)Shoot fresh weight production of single field-grownL. corniculatusplants grown on
BGD
9, 9637–9665, 2012Root growth ofLotus corniculatus B. Felderer et al.
Title Page Abstract Introduction Conclusions References Tables Figures ◭ ◮ ◭ ◮ Back Close
Full Screen / Esc
Printer-friendly Version Interactive Discussion Discussion P a per | Dis cussion P a per | Discussion P a per | Discussio n P a per | ● ● ●● ● ● ● ● ● ● ● ● ● ● ● ● ● ● ● ● ●
0.2 0.4 0.6 0.8
1000
2000
3000
4000
Water−soluble P [mg P kg−1 soil]
Root length [cm]
0.20.40.60.81.01.21.4
500
1500
2500
3500
Water−soluble P [mg P kg−1 soil]
Root length [cm]
0.20.30.40.50.60.7
1000
3000
5000
Water−soluble P [mg P kg−1 soil]
Root length [cm]
● ● ● ● ● ● ● ● ● ● ● ● ● ● ● ● ● ● ● ● ●
30 35 40 45
1000
2000
3000
4000
Water−soluble Ca [mg Ca kg−1
soil]
Root length [cm]
30 40 50 60
500
1500
2500
3500
Water−soluble Ca [mg Ca kg−1
soil]
Root length [cm]
45 50 55 60
1000
3000
5000
Water−soluble Ca [mg Ca kg−1
soil]
Root length [cm]
● ● ●● ● ● ● ● ● ● ● ● ● ● ● ● ● ● ● ● ● ● ●
0 5 10 15 20
1000
2000
3000
4000
Distance from the stem [cm]
Root length [cm]
0 5 10 15 20
500
1500
2500
3500
Distance from the stem [cm]
Root length [cm]
0 2 4 6 8 10 12 14
1000
3000
5000
Distance from the stem [cm]
Root length [cm]
● ● ● ● ● ● ● ● ● ● ● ● ● ● ● ● ● ● ● ● ●
0 5 10 15 20
30
35
40
45
Distance from the stem [cm]
Wa
te
r
−
solub
le Ca [mg Ca kg
−
1 soil]
0 5 10 15 20
30
40
50
60
Distance from the stem [cm]
Wa
te
r
−
solub
le Ca [mg Ca kg
−
1 soil]
0 2 4 6 8 10 12 14
45
50
55
60
Distance from the stem [cm]
Wa
te
r
−
solub
le Ca [mg Ca kg
−
1 soil]
Plot 1 Plot 2 Plot 3
Fig. 3.The relationship between root length and water-soluble P (first row) or water-soluble Ca
BGD
9, 9637–9665, 2012Root growth ofLotus corniculatus B. Felderer et al.
Title Page Abstract Introduction Conclusions References Tables Figures ◭ ◮ ◭ ◮ Back Close
Full Screen / Esc
Printer-friendly Version Interactive Discussion Discussion P a per | Dis cussion P a per | Discussion P a per | Discussio n P a per | ● ● ● ● ● ● ● ● ●● ● ● ● ● ● ● ● ● ●● ● ● ● ● ●
8.0 9.0 10.0 11.0
500
1500
2500
Labile P [mg P kg−1
soil]
Root length [cm]
8.0 8.59.09.5 10.0
500
1000
1500
Labile P [mg P kg−1
soil]
Root length [cm]
9 10 11 12 13
100
200
300
400
500
Labile P [mg P kg−1
soil]
Root length [cm]
● ● ● ● ● ● ● ● ● ● ● ● ● ● ● ● ● ● ● ● ● ● ●● ●
0 5 10 15 20 25
8.0
9.0
10.0
11.0
Distance from the stem [cm]
Labile P [mg P kg
−
1 soil]
0 5 10 15 20 25
8.0
9.0
10.0
Distance from the stem [cm]
Labile P [mg P kg
−
1 soil]
0 5 10 15 20 25
9 1 01 11 21 3
Distance from the stem [cm]
Labile P [mg P kg
−
1 soil]
● ● ● ● ● ● ● ● ● ● ● ● ● ● ● ● ● ● ● ● ● ● ● ● ●
0 5 10 15 20 25
30
35
40
45
Distance from the stem [cm]
Wa
te
r
−
solub
le Ca [mg Ca kg
−
1 soil]
0 5 10 15 20 25
30
35
40
Distance from the stem [cm]
Wa
te
r
−
solub
le Ca [mg Ca kg
−
1 soil]
0 5 10 15 20 25
36 38 40 42 44 46
Distance from the stem [cm]
Wa
te
r
−
solub
le Ca [mg Ca kg
−
1 soil]
● ● ● ● ● ● ● ● ● ● ● ● ● ● ● ● ● ● ● ● ● ● ● ● ●
0 5 10 15 20 25
7 .87 .98 .08 .18 .2
Distance from the stem [cm]
pH
0 5 10 15 20 25
7.95
8.05
8.15
Distance from the stem [cm]
pH
0 5 10 15 20 25
8.00
8.10
8.20
8.30
Distance from the stem [cm]
pH
Plot 1 Plot 2 Plot 3
Fig. 4.The relationship between root length and labile P (first row) as well as the the relationship
BGD
9, 9637–9665, 2012Root growth ofLotus corniculatus B. Felderer et al.
Title Page Abstract Introduction Conclusions References Tables Figures ◭ ◮ ◭ ◮ Back Close
Full Screen / Esc
Printer-friendly Version Interactive Discussion Discussion P a per | Dis cussion P a per | Discussion P a per | Discussio n P a per | ● ● ● ●
Rhizosphere effect on pH in the CCC plots
pH
●
Plot 1+2+3 Plot 1 Plot 2 Plot 3
− 1.0 − 0.6 − 0.2 0 .2 0.4 ●
Rhizosphere effect on pH in the ES plots
pH
● ●
Plot 1+2+3 Plot 1 Plot 2 Plot 3
− 1.0 − 0.6 − 0.2 0 .2 0.4 ● ● ● ●
Rhizosphere effect on water−soluble Ca in the CCC plots
mg Ca kg
−
1 soil
● ● ●
Plot 1+2+3 Plot 1 Plot 2 Plot 3
− 20 0 20 40 60
Rhizosphere effect on water−soluble Ca in the ES plots
mg Ca kg
−
1 soil
Plot 1+2+3 Plot 1 Plot 2 Plot 3
− 20 0 20 40 60 ● ● ● ●
Rhizosphere effect on water−soluble P in the CCC plots
mg w
a
ter
−
solub
le P kg
−
1 soil
● ●
● ●
Plot 1+2+3 Plot 1 Plot 2 Plot 3
− 0.5 0 .0 0.5 1 .0 ●
Rhizosphere effect on water−soluble P in the ES plots
mg w
a
ter
−
solub
le P kg
−
1 soil
Plot 1+2+3 Plot 1 Plot 2 Plot 3
− 0.5 0 .0 0.5 1 .0 ● ● ●
Rhizosphere effect on labile P in the CCC plots
mg labile P kg
−
1 soil
● ●
●
Plot 1+2+3 Plot 1 Plot 2 Plot 3
−
2
0
2468
Fig. 5.The rhizosphere effect for pH, water-soluble Ca, water-soluble P and labile P on the