REGIONAL DROUGHT IN THE SOUTHERN OF SOUTH AMERICA - PHYSICAL ASPECTS
JUAN LEONIDAS MINETTI
1, WALTER MARIO VARGAS
2, ARNOBIO GERMAN POBLETE
3AND
MARIA ELVIRA BOBBA
41
Laboratorio Climatológico Sudamericano - Fundación Caldenius (LCS), Consejo Nacional de Ciencia y
Técnica (CONICET) y Departamento de Geografía de la Universidad Nacional de Tucumán (UNT);
San Luis 183. 4000. San Miguel de Tucumán. Argentina.
2
LCS y CONICET; Buenos Aires. Argentina.
3
LCS, Departamento de Geografía e Instituto de Geografía Aplicada.
Universidad Nacional de San Juan (UNSJ). San Juan. Argentina.
4
LCS y Departamento de Geografía de la UNT. LCS. San Miguel de Tucumán. Argentina.
[email protected], [email protected], [email protected], [email protected]
Received November 2008 - Accepted August 2009
ABSTRACT
From the indices of monthly and annual climatic drought in six regions in southern South America and their associations with seventeen predictors, the probable physical causes of droughts are analyzed. These indices are used in operational climate monitoring and describe the atmospheric temperature and sea surface temperature (SST) near South America. Subtropical anticyclone activity over both coasts of South America is one of the main predictors, together with its interaction with the continental depression and SST at the coast of Brazil. The highest predictability concentrates in November-December-May and the lowest in March, June and August. In the sub regional scale, the main predictors respond to atmospheric pressure anomalies in the Atlantic Ocean for Argentinean Northwest (NOA), SST in the Brazilian coast for Argentinean Northeast (NEA), anticyclonic conditions over the Paciic and Atlantic for the Central West (CO), the latter and their interaction with the continental depression for Humid Pampa (PH), anticyclonic activity over the Paciic for the Patagonia (PAT) and trans cordillera circulation for Central Chile and Comahue (CHI).
RESUMO: SECA REGIONAL NO SUL DA AMÉRICA DO SUL - ASPECTOS FÍSICOS
As causas físicas prováveis das secas em seis regiões no sul da América do Sul são analisadas, através de índices da seca climática mensal e em suas associações com dezessete preditores. Esses indices são usados no monitoramento operacional do clima, e descrevem a temperatura atmosférica e a temperatura de superfície do mar (TSM) perto de América do Sul. A atividade do anticiclone subtropical sobre ambas as costas de América do Sul é um dos preditores principais, junto com sua interação com a depressão continental e a SST na costa do Brasil. A previsibilidade mais elevada concentra-se nos meses Novembro–Dezembro-Maio e a mais baixa, em março, junho e agosto. Na escala regional secundária, os principais preditores respondem às anomalias da pressão atmosférica sobre o Oceano Atlântico para Noroeste Argentino (NOA), TSM na costa do Brasil para condições do Nordeste Argentino (NEA), actividade anticiclónica no Pacíico e Atlântico para o Oeste Central (CO), os últimos e sua interação com a depressão continental para o Pampa Húmido (PH), a actividade anticiclónica sobre o Pacíico para o Patagonia (PAT) e a circulação através da Cordilheira para o Chile Central e Comahue (CHI).
1. INTRODUCTION
Atmospheric droughts were studied in the past mostly as regional phenomena by Jagsich (1929, 36), Maher (1973), Caviedes (1973), Gil Olcina and Olcina Cantos (1997), among others. Other authors addressed this subject from the impact perspective, e.g., Marshall (1973) and Hill (1973), in relation to land use and erosion, Whalley (1973), natural vegetation, Michajlikov et al. (1954), Minetti et al. (2007) impacts on crop, and James (1973) economic policy, among others. The application of synoptic atmospheric knowledge to describe drought generating perturbations was presented by De Alessandro and Lichtenstein (1996), Bobba and Minetti (2005), while the impact of SST on the perturbations was studied in Argentina by Lucero and Rodriguez (1991), among others.
Such climate adversities have the greatest impact on regional and national economies because of their geographical extension, intensity and persistence. Improved knowledge about these perturbations, whether it is from the physical or probabilistic points of view, will improve decision making related to ecosystem management, productive systems, technology applications and others. Based on regional drought indices developed by Minetti (1999) over six regions in southern South America, drought events were identiied. Their persistence, seasonality, trends and other aspects such as the impacts on regional crop productivity (e.g., maize in the Humid Pampa, by Minetti et al., 2007) were analyzed. The drought inventory presented by Minetti et al. (2001-04) made it possible to gain insight into the causes of regional droughts in Northwest Argentina (Bobba, 2006), North Argentina (Costa, 1999) and the Humid Pampa (Minetti et al., 2007) among others, by means of a systematic analysis leading to an integral understanding of how these phenomena are related to large scale perturbations and some SST conditions in the ocean surrounding South America.
In the past a great number of indices of atmospheric circulation and SST were deined, and these are currently used in the operations of some Climate Forecast Centers as diagnosis or predictor variables of a given condition. Some of these indices are presented in this paper, as well as their relation to the regional drought indices proposed for simultaneous estimates (diagnosis) in order to detect the causes of droughts. Those indices -not necessarily the only ones- have the advantage of synthesizing descriptions on the monthly scale. All the indices used, from drought indices to predictor variables, were validated with information from NOAA Reanalysis I (Kistler et al., 2001).
2. DATA AND METHODOLOGY
The inventory of regional climatic droughts (Minetti et al., 2001-04) was made for six regions selected by means of monthly drought indices (Minetti et al., 2007) on the basis of the
properties of climate variability and regional interests related to cattle ranching, agriculture and hydropower generation. Rainfall records from rain gauge stations in those regions (Northwest Argentina-NOA; Northeast Argentina-NEA; Humid Pampa-PH; Center-West-CO; Patagonia-PAT; and Central Chile-Comahue-CHI) cover a period of 103 years (1903-2006) with a variable number of rain gauge stations providing series not shorter than 50 years. The monthly medians were calculated for each rainfall series and site and the number of sites with rainfall below the median was estimated on a monthly basis from the ratio between the number of dry stations and the total number of stations. The index thus achieved ranges from 0 to 1. The annual index is obtained from the summation of the monthly indices, as described by Minetti (1999) and Minetti et al. (2007). These indices and their respective trends are calculated monthly for operational climate monitoring and are available at www.labclisud.com.ar. Other advantages of these monthly indices are that their frequency distributions in the drier years, in contrast to precipitation, are symmetric, even in the months with minimum seasonal rainfall. This favors their application in bi- and multivariate relations with the predictors that will be used, such as Pearson’s correlation coeficient (Conrad and Pollak, 1950). The diagnosis climatic variables to be tested in this analysis are presented below:
a-Monthly average atmospheric pressure at sea surface over the center of the South Atlantic Ocean in the intersection nodes 20-30ºS and 0-20ºW, PA.
b-Difference between mean monthly sea level pressure, in the south Atlantic and the south Paciic. For the Paciic Ocean the averages were calculated at the intersections between 30-40ºS and 80-100ºW, DAP. This variable is obviously related to the previous one.
c-Trans cordilleran index or difference between mean monthly atmospheric pressure anomalies at the level of Santiago de Chile and Cordoba stations, at both sides of the Andes, IT. d-Index of monthly easterly advection, calculated as the difference between sea level pressure in Buenos Aires (coast) and Santiago del Estero (continent), BUSD.
e-Westerly zonal low speed index, calculated as the difference between monthly sea level pressure between Valdivia (central Chile) and Punta Arenas (south of Chile), ICZA.
f-Difference between mean monthly pressure between the Paciic Ocean (20-30ºS, 80-100ºW) and the Atlantic Ocean (40-50ºS, 40-60ºW ) sectors, DPAS.
g-Monthly average of sea level pressure, over the Atlantic Ocean (40-50ºS, 40-60ºW), PAS. This variable is obviously related to the previous one.
i-Index of SST in the central coast of Brazil, obtained as mean temperature in Rio de Janeiro, TRIO.
j-Index of SST in the coast of Peru, obtained as the mean temperature in Lima, TLIM.
k-Index of SST in southern South America obtained as the mean temperature in Rio Gallegos, TGAL.
l-Monthly index of anticyclonic activity in central Chile obtained as the monthly thermal amplitude in Santiago de Chile, ATSGO.
m-Monthly index of anticyclonic activity in the Plata River obtained as the maximum mean monthly temperature in Buenos Aires, TXBUE.
n-Southern Oscillation Index, of Troup’s SOI. ñ-Index of subtropical baroclinicity obtained as the difference between temperature anomalies in Rio de Janeiro and Buenos Aires, RB.
o-Index of ocean-continent baroclinicity obtained as the difference between temperature anomalies in Rio de Janeiro and Tucuman, RT
p-Index of humidity advection from the north, obtained from the difference between sea level pressure in Rio de Janeiro and Cordoba, DRICB. This variable is obviously associated to IT.
These indices represent physical processes known in synoptic meteorology-climatology and their correlation with drought indices suggests a causal relationship in terms of averages or most frequent synoptic situations. These processes will be described in the next section, when addressing the genesis of regional droughts. Monthly predictor indices were calculated at the South American Climatology Laboratory (LCS), and they cover an extensive period; only the most relevant will be discussed here. Some of the offshore indices were obtained from Harnack and Harnack (1984) for the period 1956-80 and were subjected to consistency tests with Reanalysis I data, like the other indices. In the same way, the annual drought index was checked with the Reanalysis I data (Kistler et al., 2001) for six analyzed regions.
3. RESULTS AND DISCUSSION
Figure 1 (left panel) shows the six regions with the rain gauge for which monthly and annual drought indices were obtained using the proposed methodology. On the right, it can be seen those localities mentioned in this paper.
A) Physical Consistence of Annual Drought Index
Figure 2 shows the isocorrelations between drought indices and annual rainfall in South America from Reanalysis I (Kistler et al., 2001). This analysis makes information from both sources consistent (signiicant negative correlations in the above-mentioned regions). It also shows that homogeneous regions expand over large areas, e.g.:
1) Drought indices in NOA have a large geographic extension over southern NOA in the Center-West (CO), east of Argentina, Uruguay, southern Brazil, Amazonia, Peru and
Ecuador. Despite this marked homogeneity, NOA appears to be a peripheral or transitional region with respect to the south, in Patagonia, with an inverse correlation (drought-rain and vice versa).
2) Droughts in CO have a similar behavior to those of NOA, though correlations with Amazonia and eastern Argentina are weaker, and the inverse correlation with Patagonia appears displaced southward.
3) Droughts in PAT do not seem to be so geographically
extensive, and they display great correlation variability in the north and south. In addition, they are correlated with the extreme north of the river coast, meaning that they do not cover the entire NEA. Correlation with the Amazon region has the same sign.
4) Great spatial homogeneity is observed for droughts in NEA and southern Brazil, Uruguay and NOA. The latter conirms the weak relationship NOA-NEA. It is also directly correlated with part of Amazonia and inversely correlated with northeaster Patagonia.
5) Droughts in CHI also expand over large regions in PAT, CW and the south of the PH. An inverse correlation is observed with part of NEA and a quite marked correlation with Amazonia, mainly with the Equatorial line. This could possibly be related to a Hadley cell circulation.
6) Droughts in PH are signiicantly correlated with those in the NEA. However, correlations between the indices are low, signiicant at the 10% level. Other regions homogeneous with the irst one are western Uruguay, PAT, part of the Amazon and CHI.
B) Predictors Indices Proposed from the Synoptic Climatology Perspective
IT, ICZA, BUSD and DRICB indices represent pressure gradients that directly affect the speed of the wind to cross the cordillera, zonal westerlies-easterlies and meridional wind (northerlies-southerlies), as was described by Minetti and Vargas (1983-90), Minetti et al. (1990), Minetti (1999), Vargas et al. (1995). IT was a useful diagnosis index for windward-leeward circulation in the Andes and it is related to the Zonda wind processes (Föhen effect) and rainfall in the windward and upper areas of the Andes Range (Minetti et al., 2005; Poblete and Minetti, 2003). The index is also connecting to drying processes and leeward adiabatic warming, associated with cloud dissipation and droughts. These processes are obviously enhanced by the deepening of the continental depression in South America (Lichtenstein, 1975-76, 1983; Minetti et al., 2005), the strengthening of the South Paciic anticyclonic over the coast of South America or both. In the irst case, the deepening of the continental depression also causes the strengthening of the DRICB pressure gradient which favors moisture advection from the north, which in turn favors rainfall processes over the east of the continent. From the synoptic scale perspective, this gradient would be related tothe evolution in diurnal scale of the South American low-level jet (SALLJ) described by Paegle and Mo (1997), Berry and Inzunza (1993), Douglas et al. (1999). Moreover, Minetti et al. (2005) have shown that an excessive deepening of the continental depression below 1004 hPa (MSLP) in Tucumán does no longer favor heavy rainfall in NOA and becomes a rainfall suppression mechanism because of the overturn of dry air between the South Paciic and the
continental depression.
ICZA is a long used index of the westerly zonal circulation over PAT, which was used by Schwerdtfeger and Vasino (1954) in the irst papers aimed at explaining possible long-term climate changes in Argentina. The presence of a major coastal trough in PAT and the direction of lows with northerly or southerly components depend on the strengthening or weakening of westerly circulation in the region (Minetti et al., 1990). Equally important are the contributions by anticyclogenesis/cyclogenesis occurring windward/leeward the Andes and their dynamic role in the continental depression and the trans cordillera circulation.
The BUSD index describes the strength of easterly zonal low on the Argentine plain and the east slopes of the hills in the west of the continent. This maritime air advection is relevant in some rainfall processes, mainly during fall and early winter in NOA and Cuyo (Minetti et al., 2005).
The droughts and loods occurred in December 1970/77 in NOA revealed the relevance of offshore atmospheric pressure in the Atlantic and the Paciic (Bobba and Minetti, 2005) and its connection with the variable in Rio de Janeiro and the Plata River, which was later analyzed by Minetti and Vargas (1998). Some of the results in that paper made it possible to infer that coastal information is representative of offshore ocean processes only in some months. For this reason, a group of new offshore ocean variables was introduced such as PA, DAP, DASP and PAS, which in principle were inferred from climate maps (Harnack and Harnack, 1984) for the period 1956-80. Those values were then checked with reanalysis information (NOAA, Kistler et al., 2001) from objective methods for model initialization. PA describes the changes in mean sea level atmospheric pressure in a grid covering the average location area of the South Atlantic anticyclone according to Taljaard et al. (1969). Changes in the intensity of the South Paciic anticyclone were calculated likewise. The difference between both subtropical anticyclones are relected in the DAP index. Also based on the drought/lood in December 1970/77 in NOA, changes in pressure over the South Atlantic appeared to be important factors, and therefore PAS and its difference with the Paciic Ocean DPAS were added to the analysis.
conditions over the Atlantic coast, which is closely related to the subsidence variations of the anticyclonic ridge over the coast.
Three baroclinicity indices are proposed in this paper, BA1, RB and RT. The irst two represent thermal or density gradients between Buenos Aires and Rio Gallegos (southern), Rio de Janeiro and Buenos Aires (subtropical) and Rio de Janeiro and Tucumán (ocean-continent). The irst two have been intensively used at LCS to explain violent meso scale convection processes (MCCs) (Minetti et al., 2005) as front precursors in an essentially barotropic atmosphere within the tropical air mass, but highly baroclinic on the large scale. They were also used to study heavy rain processes because of the important convergence factors of tropical and cold air respectively, such as those generating major loods (Minetti et al., 2005). The third one (RT) describes the contrast ocean-continent, which strengthens during intense anticyclonic ridge situations over the coast, with warm temperatures over the coast, favoring moisture transport towards the continent, cloud formation and temperature drops inland along with a strong RT gradient. In the past, these conditions have been associated with rain processes at mid distance between the sea and the continent. The three indices are connected with and triggered by dynamic processes (energy transformation), since they act as the potential energy of the system.
Finally, TRIO, TLIM and TGAL represent SST anomalies in adjacent seas; the irst two were described by Aceituno (1988) and Minetti et al. (2003), and the third by Minetti and Bobba (2006). Consistency tests were applied on all these indices with reanalysis data in order to facilitate the construction of a database of sea temperature onthe coast of South America. Troup’s SOI (1965) has been included despite its relationship with SST on the coast of South America and with TLIM (Rasmusson and Carpenter, 1982; Minetti et al., 2003). This was in such way due to the fact that the index relates ocean and atmospheric information; ENSO event phases being better represented alternately by one index or the other. One of
these connections is associate to the location of the atmospheric pressure maximum over the coast of Chile on the east side of the South Paciic subtropical anticyclone (Minetti et al., 2007) –not shown.
The direct application of upper-level climate data from Reanalysis I for a better description of drought generation interrelations was not examined because of the low number of atmospheric radiosonde observations available in the Southern Hemisphere and the scale of this study (monthly-annual).
C) Homogeneity Analysis with Monthly and Annual Drought Index
Spatial and temporal homogeneity levels of the drought indices were studied, subsequently an analysis of the large-scale predictors was made with those indices. Therefore, the spatial-temporal homogeneity analysis was applied as in Lund (1969) (Table 1 and Figures 3-4). Double circles indicate the group head region, double line indicates the main association (highest correlation), squares indicate indirect correlations with one of the regions in the group other than the group head; rhombuses indicate regions not related to the main group. In addition, thick arrows in these igures represent the main relationship existing between a group head and any diagnosis index.
The Table 1 shows that during seven months of the year the drought index in the PH is a group head covering a larger number of sub regions, followed by PAT. The fact that droughts in the PH expand over more regions in Argentina is an indicator of the hazards for agriculture in the region of highest productivity (Minetti et al., 2007). In addition, this happens in an extremely important period –end of winter, spring and early summer- such as the beginning and development of the large grain campaign. Figure 3 also shows that the location of droughts in the irst semester is highly irregular in extension and that the variability regime of CHI is only connected with the PH and PAT in January, with PAT in July, with the PH in September, with the PH and NEA in October and with NEA in November. Due tothe
Figure 3 - Spatial and temporal associations between monthly regional drought indices and the identiication of the main diagnosis index with impact on the index of the group head regions. Group head regions are indicated with double circles. Sites directly connected with the group head are indicated with single circles; rectangles indicate indirect connections and rhombuses indicate no connection.
seasonal character of precipitation in CHI, the most important connections are observed in July and September. Regarding the most relevant predictors associated with sub region heads, the variables that better explain the temporal variability of the indices in December and April respond to anticyclonic activity, be it the Atlantic coast (TXBUE), atmospheric pressure over the Atlantic (PA), atmospheric pressure difference between the Paciic and the South Atlantic (DPAS) or the anticyclonic activity over the coast of Chile (ATSGO). From May to July, SST on the coast of Brazil (TRIO) dominates the inluence, followed, in the next quarter (ASO), by the northerly moisture lux generated by the variations in the pressure gradient from the Atlantic coast to the continental depression (DRICB). Finally, in November the remote inluence of ENSO shown by (TLIM) appears in the climate scenario. The exclusion of Central Chile-Comahue from this system is clearly explained by the most important variable in that region, i.e., the trans cordillera gradient (IT) during nine months of the year. Figure 4 shows the spatial and temporal homogeneity of annual drought indices. It can be seen that the PH regime has the greatest number of connections with most of the remaining regions (three sub
regions: PAT, CO and NOA, and CHI indirectly through PAT). The (annual) spatial and temporal variability regimes of the other regions are connected as follows: NOA with CO and a weak connection with NEA; weak connection between NEA and NOA; PAT with PH and CHI; CHI with PAT; and CO with NOA and PH. Connections are shown by the correlations which are signiicant at more than 5%.When the connection is weaker, as in the case of NOA-NEA, correlation signiicance is 10%.
D) Association Between the Monthly Drought Indices and Physical Predictors.
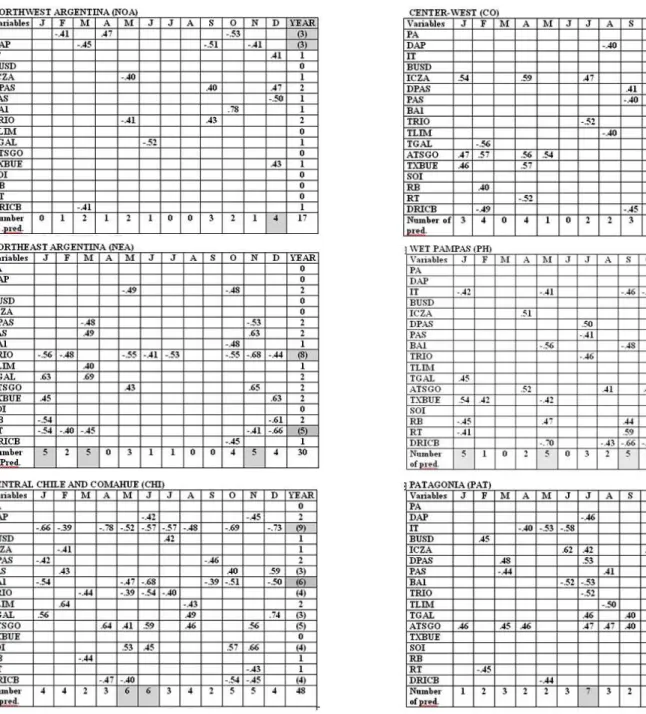
Correlations matrices were built taking into account the described variables and the predictor variables in simultaneous months (diagnosis) in the six regions indicated. The results are shown in Table 2.
indices are ATSGO and IT, which synthesize the anticyclonic activity on the western coast of the continent, whether as intrinsic activity of the South Paciic anticyclone (ATSGO) or its connection with the continental depression (IT), accounting for 57% of the total. The temperature in Rio de Janeiro (TRIO) seems to be the best indicator of the coastal sea inluence on climate variability, than on temperature in the southern ocean (TGAL) and the equatorial ocean (TLIM). In this case, both the SST in the NW coast of South America that contains information on El Niño/La Niña and the SOI are second order diagnosis indices in respect of the Atlantic inluence (TRIO). SST in the southern seas (TGAL) and mid-latitude temperature (Buenos Aires) are used to estimate southern baroclinicity (BA1), which is an important diagnosis index –the fourth in importance. The ifth diagnosis index explains the intensity of warm advection from the north (DRICB), which is moist in general and frequently acts together with subsidence conditions in the Atlantic anticyclonic ridge, represented here by the departures from the maximum temperatures in Buenos Aires, parameterized by means of (TXBUE), sixth order.
Diagnosis indices DPAS and PAS are also of the same order, but they represent the pressure anomalies in the southern Atlantic Ocean. The remaining predictors are smaller in importance. However, it is not excluded that ENSO conditions are related with and represented by for example ATSGO. In this case, ATSGO also represents other ENSO related processes, though it is mainly associated with rainfall in this area of South America. The most important diagnosis variables per region are:
for NOA the variables representing atmospheric pressure over the center of the South Atlantic Ocean (PA) and the differences in pressure between the Atlantic and the Paciic Oceans (DAP); for NEA, sea surface temperature on the Atlantic coast (TRIO) and its difference with the temperature over the continent (RT); for the PH, ive variables involving the conditions caused by the subtropical anticyclone over the coast of the Paciic Ocean (ATSGO), the Atlantic (TXBUE), the relationship with the continental low (IT) and (DRICB), as well as subtropical baroclinicity (RB); for the CO, subtropical anticyclonic conditions (ATSGO and TXBUE); for PAT, the Pacific subtropical anticyclone (ATSGO) and the velocity of westerly zonal circulation (ICZA); for CHI, the subtropical anticyclone conditions over the Paciic coast (ATSGO), their relationship with the continental low (IT) and southern baroclinicity (BA1). ATSGO, which describes the anticyclonic activity onthe coast of Chile, is a irst order diagnosis variable involved in the deinition of rainfall variability in four regions out of six (67%) in this area of South America.
The diagnosis variables of the changes in the drought indices also have an important seasonal cycle that can be seen in Figure 5, which presents a 5th degree polynomial adjustment to ilter out high frequency changes (intra-annual) in each region. In NOA, predictability increases towards December, with a secondary peak in March. In NEA, predictability also peaks in spring-summer and troughs in winter. This also occurs in the PH, though the minimum is displaced towards February. The Center-West has a clear peak in December-January and a minimum that
Table 2 - Signiicant correlations between circulation variables and drought indices in different regions of Argentina and Chile (rc =0.40 at 5%) - n=25 or 24 years (1956-80). Values in ( ) indicate relevance in a quarter of the year or more. Grey in the last column indicates predictors explaining the drought index during a larger number of months (1st and 2nd order), and the last line indicates the months with the greatest number of available predictors.
extends from May to October. A peak is observed in PAT in June-August and two minima in January and October-November. In CHI two maxima of association are observed, one in April-June and the other in November-January. The number of predictors per month in all the sub regions shows that there are three minima in June, August, and March-April with 11-12 predictors and one maximum in D-N with twice as many predictors (22-24). This was observed when trying to evaluate the ENSO signal by comparing El Niño and La Niña events and their impact on mean rainfall (Minetti et al., 2006). December and November have the greatest deinition and spatial homogeneity.
The total diagnosis indices of each region show that NOA is the region with the least possibility of explaining hydric conditions using large-scale variables (17 predictors), followed by the CO (28), NEA (30), PAT (32), PH (34) and CHI (48), the two latter with more than twice the number of NOA. This shows the importance of mesoscale processes orographic in rainfall generation in NOA. Two moist regions located in the subtropical edges of South America where large-scale processes act, i.e., the PH and CHI.
The main diagnosis indices per region are: a) For NOA, the atmospheric pressure conditions in the Atlantic Ocean (PA) and the difference with pressure in the Paciic Ocean (DAP); b) for NEA, SST on the coast of Brazil (TRIO); d) for CO, subsidence conditions in the edges of the anticyclone in Central Chile and the Plata River (ATSGO-TXBUE); e) for PH, subtropical anticyclonic conditions (ATSGO-TXBUE), the trans cordillera pressure gradient (IT), sea-continent temperature gradient (RT) and the speed of the northerly low (DRICB); f) for PAT, subtropical anticyclonic conditions in the Southern Paciic Ocean (ATSGO); and g) for CHI, the trans cordillera index (IT). It can be seen that almost all regions have one or two well-deined predictors, though PH has a variety of indices equal in importance.
E) A Monthly Analysis of Regional Drought Indices and Their Predictors.
January: The lowest predictabilityof drought conditions in the NOA occurs during this month (Bobba, 2006). This is
probably because mesoscale orographic storms interfere with the relationship of any large-scale atmospheric-oceanic index. Evidence of this is the fact that this region has the lowest predictability in the set with 17 diagnosis indices (minimum) compared with the maximum of 48 in CHI. Bobba (2006) found that atmospheric pressure over the center of the Atlantic Ocean (PA) might affect the drought index in NOA. A more sophisticated methodology might rediscover other predictors, however, from the perspective of practical application (forecast) this is not feasible. In PAT, a weak deinition is given by only one predictor (ATSGO), and one of the months with the lowest regional deinition. The greatest deinition with a large number of predictors is found in the east of Argentina, and to a lower degree in the Central region (CO and CHI). Dominating diagnosis variables of drought indices in the region are the subsidence conditions over the Atlantic coast (TXBUE) which act over NEA, PH and CO. In addition, TXBUE is the main predictor of the subgroup head (PH) and it is probably related with PA. Another important predictor in this month is TGAL in NEA, PH and CHI. In this case, warm conditions in the southern ocean cause drops in the southern baroclinicity and in the dynamic instability of the atmospheric systems; associated with this, is the absence or decreased frequency of mesoscale storm systems in the Argentine plain. According to Smagorinsky (1963), a southward displacement of the subtropical anticyclone due to this effect would contribute to the absence of precipitation in central Chile (CHI). Other lower in importance indicators are IT, RB and RT, which are involved in the baroclinic deinition North-South, East-West and the trans cordilleran low. During this month, the connection existing between drought indices in PH and CHI at the same latitudes and the lack of relationship between NEA and the other regions is observed;
February: This month has a large number of predictors spread among the regions, with the greatest concentration in CO and CHI (four), though less than in January. In the north of Argentina (NOA-NEA) situations are determined by the conditions in the Atlantic Ocean, i.e., atmospheric pressure over the Atlantic (PA) for NOA, and coastal sea temperature in Brazil (TRIO) for NEA. In both cases, negative values do not enhance rain generating moisture luxes. The lowest deinition is found in PH with only one predictor, followed by PAT with two. The greatest deinition observed in CO and CHI shows that isolated important are anticyclonic conditions over the Paciic (ATSGO), their interaction with the continental depression (IT) and its connection with the ENSO cycle (TLIM). The main predictability in PAT is given by the pressure gradient (BUSD) which enhances easterly circulation in the north of Argentina, but blocks westerly circulation over PAT, favoring drought occurrence. Only in this month, NOA is the head of the subgroups of drought index variability.
March: This is one of the months with low predictability and greatest spatial heterogeneity among the drought indices of the sub regions (three unconnected areas: NOA, NEA and CHI). The less predictable regions are CO and PH in Argentina. The lowest predictability of ENSO observed in March and April for the following months may be affecting the present result (Minetti et al., 1993, 2003). The greatest number of predictors is found in NEA and the main predictor variables are pressure conditions over the south of the South Atlantic (PAS) and the difference between pressure in the Paciic and the South Atlantic (DPAS). High pressure over the South Atlantic favors weak moisture luxes from the southeast with low vertical vapor transport in NEA, which favors coastal droughts. A moisture lux with easterly component over the Patagonian plateau and the continent favors rainfall occurrence, opposite to the normal drier circulation. In this case, DPAS is the most important predictor with the drought index in PAT. In March-April, the drought index in Patagonia is in the lead of the sub regions and April having more connections.
April: In this month again, the shortage of predictors dominates the north of Argentina where there is an inversion of the correlation with the Patagonian drought index. There are no predictors in NEA and there is only one in NOA that explains the importance of low pressure over the Atlantic reducing vapor luxes and precipitation in the regions. The region with the greatest predictability is (CO), where subsidence caused by the anticyclones located over both coasts of the continent (ATSGO-TXBUE) dominates droughts together with a strong westerly zonal low. Intense subtropical anticyclonic activity over the Paciic may affect rainfall in 67% of the regions and it is the variable with greatest impact on the head of the group (PAT).
June: Like in March, the overall predictability decreases in the region, particularly in CO and PH. Predictability in northern Argentina is also low, where low sea surface temperature in the coast of Brazil determines drought occurrence in NEA, which is head of the group for the second consecutive month. Cold water in the southern sea also determines drought occurrence in NOA. Without a dominating predictor, this month has two predictors with some incidence. They are the trans cordilleran low (IT) and southern baroclinicity (BA1). When these indices are weak, they favor drought occurrence in CHI and PAT. Low temperatures in the Atlantic coast (TRIO) have the same order of importance for NEA and CHI, though the latter is more dificult to determine. For second consecutive month, SOI appears forecasting droughts in CHI during the cold ENSO phase.
July: Predictability in this month is greater, with greater spatial priority for PAT, where 41% of the predictors indicates drought occurrence. On the other hand, in the north of Argentina (NOA-NEA) predictability is low. The main predictor in this month is SST in Brazil (TRIO), which in negative anomaly situations causes droughts in all the coastal area from NEA, through PH up to PAT. The drought index in CO is head of the group and droughts are deined by cold TRIO.
August: The lack of predictability increases during this month in the north of Argentina (NOA-NEA) which has no indicator. The PH is the head of the group and will remain during a long seasonal period, until January of the following year. By the end of winter, the moisture lux from the north (DRICB) begins to play an important role in the predictability of rainfall with interactions betweenthe Atlantic anticyclone and the continental depression. However, the greatest predictability is observed in CHI where ENSO conditions dominate and TLIM appears as an indicator of the SOI. Under cold temperatures in the Equatorial Paciic, droughts also reach PAT and CO, with no relation among drought indices. Droughts in the PH may be favored by anticyclonic activity in the Paciic, mostly associated with cold water temperatures.
September: The increasing warming of the continent and the NOA depression favor moisture advection processes from the Atlantic Ocean (DRICB). The next relevant variables describing related processes are DAP, TRIO, DPAS and IT. The region with the greatest predictability is PH where the advection
from the north (DRICB) and the advection favored by a strong wind to cross the cordilleran (IT) indicatethe presence of deep continental depressions favoring the precipitation. The opposite favors droughts. In the case of NOA, the greater pressure over the Paciic, rather than the one over the Atlantic, also favors droughts. Warm SST may introduce a greater cloud cover over the mountainous region inhibiting convection, which is not favorable for precipitation during this season. The main predictor in this month is DPAS, which indicates the presence of a deep anticyclone over the Paciic Ocean. The anticyclone induces subsidence and droughts in NOA, CO and Chile. In this month, PH remains as group head and a connection is established with the index of Central Chile that will persist during the next month.
October: During this month predictability is low in CO and PAT, and high in CHI which is connected with PH. In CHI, the SOI shows the persistent action of ENSO over the region. At the same time a long-term inluence develops of SST in the Atlantic (TRIO) in NEA, which will last until February. The main predictors - IT, BA1 and DRICB- reveal the importance of continental warming and the generation of circulation between subtropical anticyclones and the NOA depression (DRICB). This indicates that when northerly low is weak, droughts occur in PH, and withweak trans cordilleran low (IT), droughts occur in NEA and CHI due to the weak humidity lux in the Cordillera, which explains the connection between drought indices in CHI and NEA. Low pressure over the Atlantic also indicates the same problem in NOA, favorable to drought. PH remains the head of the group.
November: Predictability increases in this month with the maturing of several processes, such as the presence of major depressions in the NOA and associated circulation which interacts with remote ENSO signals. PH remains ahead of the group and for the irst time sea surface temperature in the Equatorial Paciic (TLIM) is the main predictor for this region. This also explains the expansion of predictability to equally cover three regions, NEA, PH and CHI. The activity of the continental depression and its interaction with the Atlantic Ocean as a source of water vapor are relected in DAP, PAS, TRIO, while ENSO conditions are seen in the SOI and the TLIM. Even though, the lower predictability in NOA (one predictor) indicates the growing signiicance of random
mesoscale phenomena which introduce noise that cannot be correlated with the predictors for this warmer month over the continent. In this month and in December, drought indices for NOA are not connected with the rest. The main predictor, i.e., anticyclonic activity over the Paciic Ocean (ATSGO) highlights the importance of ENSO and its inluence on the Ocean through the SOI as an inductor of droughts in NEA, PH and CHI under positive anomaly conditions (cold water in the Equatorial Paciic). The SOI appears in PH and ATSGO, in NEA.
December: The greatest predictability moves to the continent (NOA-CO) although PH maintains its inluence over the rest as group head. CO has a series of predictors which are connect to ENSO through the SOI. Anomalous atmospheric pressure in the south of the South Atlantic is associated with blocking action that disturb the mean monthly ields (Rex, 1950; Grandoso & Nuñez, 1955; Trenberth, 1985), and major subsidence in the area of the Plata River (TXBUE). This is the main predictor, which covers NOA, NEA, PH and CO. With positive SOI and TXBUE, droughts cover all of Argentina, given that PAT is affected by TLIM, an ENSO-related predictor. This can be seen in the changes in mean rainfall caused by the ENSO in Argentina (Minetti et al., 2006). In this month, other predictors in merit order are SOI and PAS.
It is worth mentioning that since rainfall genesis in central Chile is different from that in the PH, in the group analysis the main predictors are different from those indicated in Table 3. The main predictors in that table are ATSGO and IT. However, in the group analysis where PH is the group head, the main predictors are DRICB and TRIO, which describe the intensity of moist advection and the thermal state of the vapor source respectively.
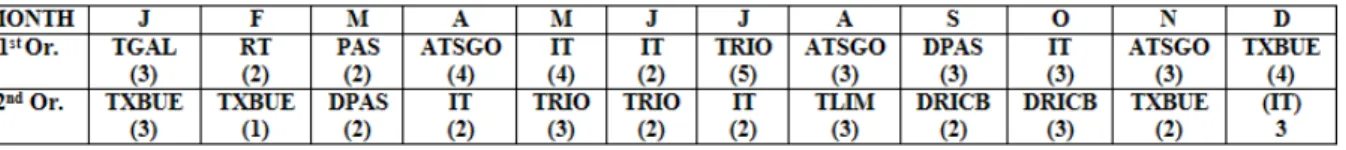
Finally, Table 4 synthesizes the main diagnosis variables for monthly drought indices highlighting their monthly relevance.
4. CONCLUSIONS
The proposed drought indices and information from Reanalysis I were applied to study the climate on the monthly and annual scales. The indices show that Patagonia has the lowest spatial homogeneity for both methodologies (data-Reanalysis I). Major spatial and temporal associations were found between drought/rain variability and the predictors, covering large geographic areas.
The analysis shows that predictability (diagnosis) of drought indices follows a seasonal cycle with peaks in November-December and May and minima in March-June-August. The main predictor indices are related to atmospheric pressure anomalies in the Atlantic Ocean for Argentinean Northwest, coastal sea surface temperature in Brazil for
Argentinean Northeast, and anticyclonic activity over the coast for Central West. The latter along with the continental depression are important in Humid Pampa, anticyclonic activity in the Paciic Ocean in Patagonia and the trans cordilleran low in Chile-Comahue. On the other hand, the relevance of the ENSO cycle is inferred from the development of predictability during fall-winter and its interaction with the evolution of the continental depression during spring, reaching maximum predictability in November-December. The Humid Pampa is the head of the regional drought index group in six consecutive months (August – January), a period of great seasonal importance for large grain crop in the country. The importance of indices such as ATSGO, IT, DRICB and TRIO in climate predictions is also observable.
5. ACKNOWLEDGEMENTS
The authors thank CONICET for the support through project PID 2157/2001 on Droughts in Argentina, SECYT for the support through project PICTR 00186/2003 on “The impact of climate change on the Andes” Project.
6. REFERENCES
ACEITUNO, P. On the functioning of the Southern Oscillation in the South American Sector, Part I, Surface Climate. Monthly Weather Review. v. 116, p.505-524, 1988. BERRY, G.; INZUNZA J.B. The effect of the low-level jet
during the warm season of 1993. Monthly Weather Review 9, p. 2176-2192. 1993.
BOBBA, M.E.; MINETTI, J.L. Relación entre la presión atmosférica y las sequías en la región del Noroeste Argentino. Revista de Geograia. Año VIII, Nº 9, p. 38-48. UNSJ. San Juan, 2005.
BOBBA, M.E. La sequía en la región del Noroeste Argentino: Sus causas.2006. 354 p. Tesis (Doctorado en Geograia). Facultad de Filosoia y Letras. Dpto. de Geografía, UNT... S.M. de Tucumán, 2006.
CAVIEDES, C.N. Secas and El Niño: Two simultaneous climatically hazards in South America. Proceeding Association of American Geographers, v. 5, p.19-73, 1973. CONRAD, V.; L.W. POLLAK. Methods in Climatology.
Harvard University Press, 439 p. 1950.
COSTA, M.C. Las sequías en el Noreste Argentino. Contribuciones Cientíicas GAEA p.159-164. San Juan,1999.
at Santa Cruz, Bolivia during January-March 1999. Piloto balloon observations and model comparisons. Preprints Tenth Symposium on Global Change. Dallas, Texas, p.223-226. 1999.
GRANDOSO, H.N.; NUÑEZ, J.E. Análisis de una situación de bloqueo en la parte austral de América del Sur. Meteoros, v.1,2, p.35-54. SMN. Bs.As., 1995.
GIL OLCINA, A.; OLCINA CANTOS, J. Climatología General. Ed. Ariel, 579 p. Barcelona, 1997.
HARNACK, J.; R.P. HARNACK. A Southern Hemisphere sea level pressure data set for use in climate studies. Journal of Climatology. Vol. 4, p. 187-204, 1984.
HILL, M.K. Farm management for drought mitigation. The environmental economic and social signiicance of drought. Edited by J.V.Lovett, p. 195-219. Australia, 1973.
JAGSICH, J. La sequía reinante y su probable duración. La Prensa 30 de Mayo. Bs.As. ,1929.
JAGSICH, J. Las causas de la gran sequía de 1935. Sección 3ra. La Prensa, 13 de Marzo. Bs.As. ,1936.
JAMES, P.G. Economic policy of drought. The environmental economic and social signiicance of drought. Edited by J.V. Lovett, p. 245-262. Australia, 1973.
KISTLER, R.; E. KALNAY; W. COLLINS, S. SAHA, G. WHITE, J. WOOLLEN, M. CHELLIAN, W. EDISUZAKI, M. KANAMITSO, V. KOUSKY, H. VAN DEN DOOL, R. JENNE; M. FIORINO. The ENCEP-NCAR 50 year’s reanalysis. Bulletin of the American Meteorological Society, v. 82, p. 247-267, 2001.
LICHTENSTEIN, E.R. Variabilidad de la presión en el entorno de la depresión del Noroeste Argentino. Meteorológica v. VI-VII, p. 293-305. CAM. Bs.As. ,1975-76.
LICHTENSTEIN, E.R. Sobre el mecanismo de la depresión del Noroeste Argentino. Meteorológica v. XIV, Nº 1-2, p. 569-580. CAM. Bs.As. ,1983.
LUCERO, O.; N. RODRIGUEZ. Relación estadística entre la ocurrencia de sequías severas en Argentina y la temperatura de la supericie del Océano Pacíico Tropical. 5º Reunión Nacional de la Asociación Argentina de Agrometeorología y 1ras. Jornadas Multisectoriales sobre sequías del INCYTH, p. 223-235. Cordoba, 1991.
LUND, I.A. Map classiication by statistical methods. Journal of Applied Meteorology, v.2, p. 56-65, 1969.
MAHER, J.V. Meteorological aspects of drought. The environmental, economic and social signiicance of drought. Edited by J.V. Lovett, p. 17-40. Australia.,1973.
MARSHALL, J.K. Drought, land use and soil erosion. The environmental, economic and social signiicance of drought. Editad by J.V. Lovett, p. 55-80. Australia, 1973.
MICHAJLIKOV, A.; G. JUÁREZ, G.; L.A. ALVAREZ HERLEIN. El temple del trigo contra la sequía aplicado al gran cultivo.
Meteoros, año IV, Nº 3. p. 215-229. SMN. Bs.As.,1954. MINETTI, J.L.; S.M. RADICELLA; M.I. MENEGAZZO; J.C.
SAL PAZ. La actividad anticiclónica y las precipitaciones en Chile y en la zona cordillerana Central Andina. Revista de Geofísica 16, IPGH-OEA, p. 145-157. México, 1982. MINETTI, J.L.; W.M. VARGAS. Comportamiento del
borde anticiclónico subtropical en Sudamérica. I Parte. Meteorológica, vol. XIV, Nº 1-2, p. 645-656. CAM. Bs.As. ,1983. MINETTI, J.L.; W.M. VARGAS; A.G. POBLETE, La
perturbación de la circulación zonal que originaría el sub continente Sudamericano. Revista de Geofísica 33, Jul-Dic., p.161-190. IPGH-OEA. México, 1990.
MINETTI, J.L.; W.M. VARGAS. Comportamiento del borde anticiclónico subtropical en Sudamérica. II Parte. Revista de Geofísica v.33, p.179-190. IPGH-OEA. México,1990. MINETTI, J.L.; W.M. VARGAS; A.G. POBLETE.
Comportamiento intraestacional e interanual del borde oriental del anticiclón del Pacíico Sur. Revista de Geofísica v.38, p. 79-89. IPGH-OEA. México, 1993.
MINETTI, J.L.; W.M. VARGAS. Pressure behavior of the subtropical Atlantic anticyclone and its inluenced region over South America. Australian Meteorogical Magazine. v.48, p. 69-77, 1998.
MINETTI, J.L. Las sequías en la Argentina. Contribuciones Cientíicas GAEA, San Juan, 1999.
MINETTI, J.L.; W.M. VARGAS; L.R. DE LA ZERDA; G. CASAGRANDE; L.R. ACUÑA; J.J. NIEVAS; F.L. FRASSETTO. Inventario de las sequías regionales en Argentina y Chile. Informe Técnico del Laboratorio Climatológico Sudamericano. 1ra. Edición. Fundación Caldenius Sede NOAA y CONICET. S.M. de Tucuman, 2001. MINETTI, J.L.; W.M. VARGAS; A.G. POBLETE. Eastern equatorial paciic SST variability related with the temperature of Lima (Perú). Transworld Research Network 37/661. Fort P.O., Trivandrum, 695023., p. 1-19. Kerala, India, 2003. MINETTI, J.L.; W.M. VARGAS; L.R. DE LA ZERDA;
A.G. POBLETE; G.A. CASAGRANDE; L.R. ACUÑA; I.J. NIEVA; F.L. FRASSETTO; G.E. OSTERTAG; L.R. MINETTI ; E.A. MENDOZA. Inventario de las sequías regionales en Argentina y Chile. 2da. Edición. Informe Técnico del Laboratorio Climatológico Sudamericano. Fundación Caldenius Sede NOAA y CONICET. S.M. de Tucuman, 2004. MINETTI, J.L.; W.M. VARGAS; C.M. HERNÁNDEZ; E. LÓPEZ. El Clima del Noroeste Argentino-Cap. 3: La circulación regional estacional en Sudamérica-Su incidencia en el clima del NOA; Cap. 4: La circulación regional en el Noroeste Argentino y condiciones del tiempo asociadas. Ed. Magna, 449 p., 2005.
relacionados con el ENSO. Análisis de mesoescala en el Noroeste Argentino. Revista de Geografía, año IX, Nº 10, p. 31-40. UNSJ. San Juan, 2006.
MINETTI, J.L.; W.M. VARGAS; A.G. POBLETE ; E.A. MENDOZA. Posición latitudinal del anticiclón del Pacíico Sur (“L”) y su impacto en cambios de larga escala del derrame anual de ríos en Argentina. Congreso Nacional del Agua (CONAGUA 2007). S.M. de Tucuman, 2007. MINETTI, J.L., W.M. VARGAS; B. VEGA; M.C. COSTA.Las
sequías en la Pampa Húmeda: Impacto en la productividad del maíz. Revista Brasileira de Meteorologia. V 22, Nº 2, p. 218-232, 2007.
PAEGLE, J.N.; K.C. MO. Alternating wet and dry conditions over South America during summer. Monthly Weather Review. 3, p. 279-291, 1997.
POBLETE, A.G.; J.L. MINETTI. Asociación entre cuantificadores del ENSO e índices de circulación atmosférica regional con el derrame del Río San Juan. Revista de Geografía, año VI, Nº 7, p.27-34. UNSJ. San Juan, 2003. RASMUSSON, E.M.; T.H. CARPENTER. Variation in tropical
sea surface temperature and surface wind ields associated with the Southern Oscillation/El Niño. Monthly Weather Review. v.110, p. 354-383, 1982.
REX, D.F. Blocking action in the middle troposphere and its effects upon regional climate. Tellus 2, Nº 3, 1950.
SCHWERDTFEGER, W.; C.J. VASINO. La variación secular de las precipitaciones en el Este y Centro de la República Argentina. Meteoros, año IV, Nº 3, p.174-193. SMN. Bs.As, 1954.
SMAGORINSKY, J. General circulation experiment with primitive equation. Monthly Weather Review v. 91, p. 99-164, 1963.
TALJAARD, J.L., H. VAN LOON; H.L. CRUTCHER; R.L. JENNE. Climate of the upper air. Part I, Southern Hemisphere, Vol. I. Temperatures Dew Point and Heigths at selected pressure levels, NAVAIR 50, AC 55, Chief Naval Operations, p. 135. Washington D.C., 1969.
TRENBERTH, K.E. Blocking in the Southern Hemisphere. MontlhyWeatherReview. 113, 3-21.
TROUP, A.J., The Southern Oscillation. Quotherly Journal Research Meteorology Society. v.91, p. 290-506, 1985, 1965. VARGAS, W.M.; J.L. MINETTI; A.G. POBLETE. Statistical
study of climatic jump in the regional zonal circulation over South America. Journal of the Meteorology Society Japan, v. 73, Nº 5, p. 849-856, 1995.