Article
J. Braz. Chem. Soc., Vol. 25, No. 3, 532-539, 2014. Printed in Brazil - ©2014 Sociedade Brasileira de Química 0103 - 5053 $6.00+0.00
A
*e-mail: [email protected]
On the Use of the Power-Law Model for Interpreting
Constant-Phase-Element Parameters
Mark E. Orazem,*,a Bernard Tribollet,b Vincent Vivier,b Douglas P. Riemer,c
Erick Whited and Annette Bunged
aDepartment of Chemical Engineering, University of Florida, Gainesville, FL, 32611, USA
bLISE, UPR 15 du CNRS, Université P. et M. Curie, CP 133, 4 Place Jussieu, 75252 Paris, France
cHutchinson Technology, Inc., 40 West Highland Park Dr. NE, Hutchinson, MN 55350, USA
dDepartment of Chemical and Biological Engineering, Colorado School of Mines,
Golden, CO 80401, USA
Elementos de fase constante (CPE) são frequentemente usados para modelar dados de impedância oriundos de uma gama variada de sistemas experimentais. O modelo de lei de potências comprovou ser uma ferramenta poderosa na interpretação de parâmetros de CPE resultantes de uma distribuição axial ou normal das constantes de tempo. Este trabalho trata das dificuldades na aplicação deste modelo quando um de seus parâmetros possui valor incerto. São apresentados métodos que delimitam o valor do parâmetro, de calibração e de análise comparativa, na qual o parâmetro desconhecido pode ser eliminado. Os métodos são demonstrados por dados sobre óxidos em aços e sobre pele humana, retirados da literatura.
Constant-phase elements (CPE) are often used to fit impedance data arising from a broad range of experimental systems. The power-law model has proven to be a powerful tool for interpretation of CPE parameters resulting from an axial or normal distribution of time constants. This paper addresses difficulties in applying this model associated with uncertain values for one of the model parameters. Methods are presented for bounding the value of the parameter, for calibration, and for comparative analysis in which the unknown parameter may be eliminated. The methods are illustrated by data taken from the literature for oxides on steels and for human skin.
Keywords: electrochemistry, electro-analytical, voltammetry/amperometry/spectrophotometry/ potentiometry analysis
Introduction
In 2010, Hirschorn et al.1,2 identified a relationship
between constant-phase element (CPE) parameters and physical properties of films by regressing a measurement
model3,4 to synthetic CPE data. Following the procedure
described by Agarwal et al.,3,4 sequential Voigt elements
were added to the model until the addition of an element did not improve the fit and one or more model parameters
included zero within their 95.4 percent 2σ confidence
interval.
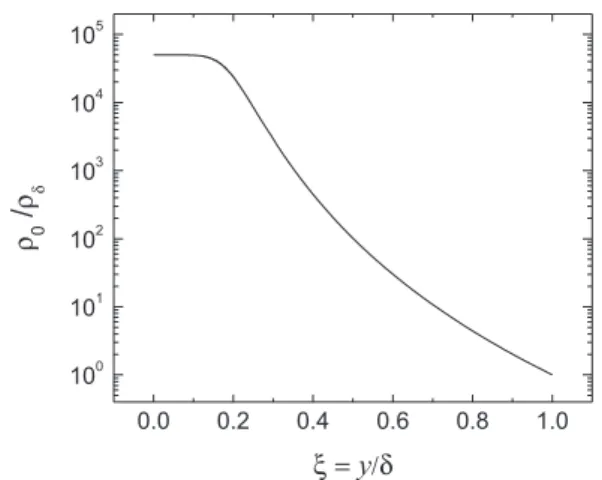
Their concept was to identify the distribution of resistivity that, under the assumption that the dielectric constant is independent of position, would result in CPE behavior. The development is presented in detail in reference 1. The authors proposed a distribution of resistivity to be
(1)
where ρ0 and ρδ are the boundary values of resistivity at
the interfaces. A graphical representation of the resistivity distribution associated with equation 1 is presented in
Figure 1, where ρδ is the resistivity at y = δ or ξ = 1, and
chosen for this representation to be 5 × 10⁴ ρ
δ, but often ρ0
is too large to be seen in the impedance response.
Under the conditions that ρ0 > ρδ and f < (2πρδεε0)-1,
the impedance of the film was given as
(2)
where g is a function of γ. Equation 2 was shown to be in
the form of a CPE, i.e.,
(3)
for f < (2πρ0εε0)-1. Examination of equation 3 and the
high-frequency limit of equation 2 yielded 1/γ = 1 – α
where γ≥ 2 for 0.5 ≤α≤ 1 . Numerical integration was
used to develop the interpolation formula
g = 1 + 2.88(1 – α)2.375 (4)
A relationship among the CPE parameters Q and α and
the dielectric constant ε, resistivity ρδ, and film thickness
δ was found to be
(5)
where resistivity ρδ is the lower bound for the resistivity
given in equation 1 and ε0 is the permittivity of vacuum
with a value of ε0 = 8.8542 × 10⁻¹⁴ F cm-1.
Orazem et al.5 recently provided a summary of methods
used to extract system properties from CPE parameters.
Following the concepts described by Jorcin et al.,6 CPE
behaviors were described as resulting from surface or normal (axial) distributions of time constants. If the CPE results from a dielectric response of the material, i.e., a normal distribution of time constants, it allows determination of an effective capacitance expressed in terms
of dielectric constant ε and film thickness δ as
(6)
If the CPE response is instead associated with a surface distribution of time constants, a double-layer capacitance may be identified, and the associated value may be used to assess the electrochemically active area.
Equations 5 and 6 yield an expression for the effective capacitance as
(7)
In addition to the CPE parameters Q and α, Ceff,PL depends
on the dielectric constant ε and the smaller value of the
resistivity ρδ. A special feature of equation 7 is that it
depends only on the high-frequency data without need for the resistance obtained at low frequency.
The assumption of a uniform dielectric constant is not critical to the development summarized above. Musiani
et al.7 have shown that equation 5 applies, even when the
assumption of a uniform dielectric constant is relaxed by
allowing variation of ε in the region of low resistivity.
The power-law model has been demonstrated to provide a suitable approach for interpreting the CPE behavior
associated with the dielectric response of a film.2,5 Indeed,
the model has been adapted successfully to explore the role
of water uptake in coatings.8 While the power-law model
provides a better interpretation of CPE parameters than does the formula derived from the characteristic frequency of the impedance, i.e.,
(8)
which is equivalent to equation 3 in the work of Hsu and
Mansfeld,9 it requires a parameter ρ
δ that has well-defined
physical meaning but is generally unknown.
In previous work,2 the experimental frequency range was
coupled with physical insight to establish a range of values
for ρδ. The authors also used independent measurements
of film thickness to allow determination of a value for ρδ,
but this approach may be criticized if the uncertainty in the film-thickness measurement is very large. The object of this work is to explore the propagation of errors from
the film-thickness measurement to determination of ρδ and,
Figure 1. Graphical representation of the resistivity distribution associated with equation 1 where ρδ is the resistivity at y = δ or ξ = 1, and ρ0 is
the resistivity at y = 0 or ξ = 0. The value of ρ0 was chosen for this
representation to be 5 × 10⁴ρ
δ, but often ρ0 is too large to be seen in the
ultimately, to the estimation of film thickness for other systems. An alternative approach is also explored in which
determination of ρδ may be avoided. This work is intended
to demonstrate how the power-law model may be applied to interpretation of CPE behavior.
Experimental
The experimental results discussed in the present work come from the literature.
Impedance of free-machining steel
Steel samples were masked using a vinyl tape, 0.132 mm thick, (3M 471) in which a precision 3 mm hole was cut. The coupon with applied mask was then sandwiched into a cell where 1 mL of electrolyte was used to fill the cell. The cell was attached to a PAR 2273 Potentiostat/FRA and impedance measurements were conducted at the measured open-circuit potential using a 10 mV perturbation.
Impedance data were collected in an electrolyte
consisting of 22 g L-1 boric acid with NaOH added, about
6 g L-1, to bring the pH to 7.2. The samples included steel
in as-received condition and after a proprietary treatment to increase the chromium content of the oxide film. Additional information is provided in reference 5.
Impedance of human skin
The impedance data reported in the present work came from a larger study intended to correlate changes in the
flux of p-chloronitrobenzene (PCNB) and 4-cyanophenol
in response to physical and chemical damage.10-12
Split-thickness human cadaver skin (300-400 µm thick) from the back or abdomen was purchased from the National Disease Research Interchange (NDRI, Philadelphia, PA). The skin was collected within 24 h post mortem, frozen immediately, and stored at temperatures less than –60 °C
until used. The protocol described by White et al.10 was
used to ensure that the skin resistance was greater than
20 kΩ cm2, a value considered to indicate that samples
have sufficient integrity for meaningful measurements of in-vitro chemical permeability.
The impedance was measured in a four-electrode configuration, in which two Ag/AgCl (In Vivo Metric, Healdsburg, CA) reference electrodes were used to sense the potential drop across the skin, and two Ag/ AgCl working electrodes were used to drive the current. Ag/AgCl electrodes are commonly used for biological systems because the electrolytes typically contain chloride ions and the associated electrochemical reactions do not
change the electrolyte pH. The skin was exposed on both sides for roughly eight hours to a phosphate buffered saline
solution (PBS) (0.01 mol L-1, pH 7.4, Sigma P-3813)
prepared in deionized water.
Mechanical damage
The impedance measurements reported here were collected with a 10 mV potential perturbation after two permeation experiments (for 7 and 6 h, respectively) in which4-cyanophenol-saturated PBS was placed in the donor chamber and PBS was placed in the receptor chamber. After the first 4-cyanophenol permeation experiment, the frame holding the skin was removed from the diffusion cell, the skin was pierced by a 26 gauge needle (with a 464 µm outside diameter), the cell was reassembled, and the donor and receptor chambers refilled with fresh 4-cyanophenol-saturated PBS and PBS, respectively, for the second permeation experiment. Typical results show that the characteristic frequency before the puncture was substantially smaller than the characteristic frequency after the puncture.
Because the diameter of the needle used to puncture the skin was small compared to the total skin area, the pinhole was expected to have little effect on the impedance properties of the remaining skin. Control experiments were used to show that the electrical properties of skin were unaffected by other skin handling steps. Therefore, the skin resistance and the dielectric constant for the skin were assumed to be the same before and after the skin was pierced by the needle. Additional experimental detail can be found in reference 11.
Chemical damage
The dimethyl sulfoxide (DMSO) experiments consisted of simultaneous measurements of impedance and PCNB flux through skin before and after 1 h treatments with 100% DMSO or with PBS, which acted as the control. The entire experiment was repeated three times. Before the measurements, skin was allowed to equilibrate by immersion in PBS for an eight to twelve hour period.
0.25 h and then for 1 h in about 1 L of PBS. The diffusion cells were rinsed thoroughly and then reassembled and filled with PBS solution for another 8-h equilibration period with hourly impedance scans. Impedance results reported for before and after DMSO treatment were derived from the last spectrum collected during the equilibration periods. Additional experimental detail can be found in reference 12.
Results and Discussion
Values for Q and α are obtained from impedance
measurements. If the dielectric constant is known, equation
5 may be used to extract δρδ(1–α). To obtain the film thickness
δ, a value for ρδ is required. If δ is known, equation 5 yields
a value for εα/ρ
δ
(1–α). To obtain the dielectric constant ε,
a value for ρδ is required. The principal difficulty in the
application of the power-law model is that values for the
parameter ρδ are unknown. Several methods are proposed
to address this difficulty. The frequency range over which CPE behavior is observed may be used to establish an
upper bound for the value of ρδ. If the film thickness δ and
dielectric constant ε are known for a material similar to that
under investigation, the value of ρδ may be obtained through
calibration. If calibration is not possible, the power-law model may be used to guide comparative studies.
Establishing bounds
Hirschorn et al.1 demonstrated the method by which
bounds on the value of ρδ may be established through
high-frequency limit of the impedance response. The impedance response of the power law model exhibits capacitive behavior above a characteristic frequency
(9)
Under conditions that the value of ρδ is unknown for data
showing high-frequency CPE behavior, an upper bound on its value can be defined because the characteristic frequency
fδ must be larger than the largest measured frequency fmax.
Thus, a maximum value of ρδ can be obtained
(10)
Hirschorn et al.2 applied this approach for data that
were presented by Frateur et al.13 for the impedance
response of a Fe17Cr disk (polarized in the passive domain for 1 h at –0.1 V measured with respect to a
mercury/mercurous sulfate electrode in saturated K2SO4)
in deaerated pH 4, 0.05 mol L-1 Na
2SO4 electrolyte. A
value of 12 was assumed for ε, which corresponds to the
dielectric constant for Fe2O3 and Cr2O3. For this experiment,
with a maximum measurement frequency of 100 kHz,
ρδ,max = 1.5 × 10⁶Ω cm. A lower bound for ρ
δ may also be
estimated on physical grounds. For an oxide, for example,
ρδ is not expected to be smaller than minimum resistivity
value expected for semiconductors, i.e., 1 × 10⁻³Ω cm.
Using equation 5, this conservative range of ρδ yields an
estimated layer thickness of δ = 1.2 to 12.6 nm, which
encompasses the value of 3 nm obtained from X-ray
photoelectron spectroscopy (XPS).13 While it is satisfying
that a physically reasonable range of film thickness can be
identified by the methods discussed by Hirschorn et al.,2
more precise values are desired.
For the impedance data associated with human skin in PBS, the thickness of the stratum corneum may be assumed to be around 15 µm, but the dielectric constant is not known. In this case, equations 5 and 10 must be solved simultaneously. Using an iterative technique, the maximum
measured frequency yielded ρδ = 1.59 × 10⁵ Ω cm,
corresponding to a dielectric constant of 122. The lowest
value for ρδ was selected on the grounds that the resistivity
of the skin should approach that of the electrolyte in which
it is immersed; i.e., ρδ = 55 Ω cm, corresponding to a
dielectric constant of 22. In this case, the range of values obtained is too large to be meaningful, and, again, a more precise approach is desired.
Calibration
From XPS analysis, Frateur et al.13 showed that
the passive film developed on Fe17Cr consisted of an
inner layer of Fe2O3 and Cr2O3 covered by an outer
layer of Cr(OH)3 and that the thickness was about 3 nm.
Graphical analysis of the impedance yielded α = 0.89 and
Q = 3.7 × 10⁻⁵ F cm-2 s-0.11. Equation 5 was used to obtain
ρδ = 450 Ω cm. Under the assumption that other oxides on
steel will have similar values for ρδ, this value of ρδ was
used in subsequent analysis of the impedance response free-machining 18/8 stainless steel (18 Cr-8 Ni), also known
as 303 stainless steel, and martensitic stainless steel.5 The
power-law model yielded good agreement to independent
values of film thickness measured by use of ex-situ XPS.
Assessment of film thickness by XPS, however, is imprecise, and uncertainties in the measurement used for
calibration should propagate to the value of ρδ. Monte
Carlo simulations were performed to illustrate the manner in which uncertainty in the measurement of the film
thickness causes uncertainty in the resulting ρδ. Under the
of film thickness by XPS is 10% of the measured value and that the errors are normally distributed, the assessment of film thickness can be expressed as shown in Figure 2.
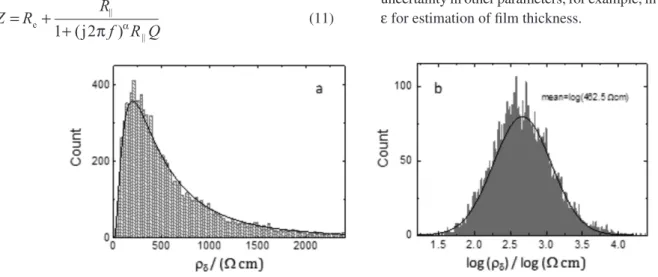
Under the additional assumption that the dielectric
constant of the oxide was ε = 12, the resulting value of ρδ,
obtained from equation 5, was found to be log-normally distributed, as shown in Figure 3a. The corresponding
distribution of the logarithm of ρδ is shown in Figure 3b. The
10% uncertainty of the film thickness used to calibrate the
power-law model results in an uncertainty of ρδ that extends
over two orders of magnitude. The large uncertainty in ρδ
shown in Figure 3 can be attributed to the observation that,
in equation 5, ρδ appears raised to the 1–α power. When α
is close to unity, equation 5 is relatively insensitive to ρδ.
The calibration from the data of Frateur et al.13 was
used by Orazem et al.5 to estimate the thickness of films
on a free-machining 18/8 stainless steel (18 Cr-8 Ni). They regressed the data with the equation
(11)
where R|| is the parallel resistance. The results are
presented in Table 1. The film thickness obtained by
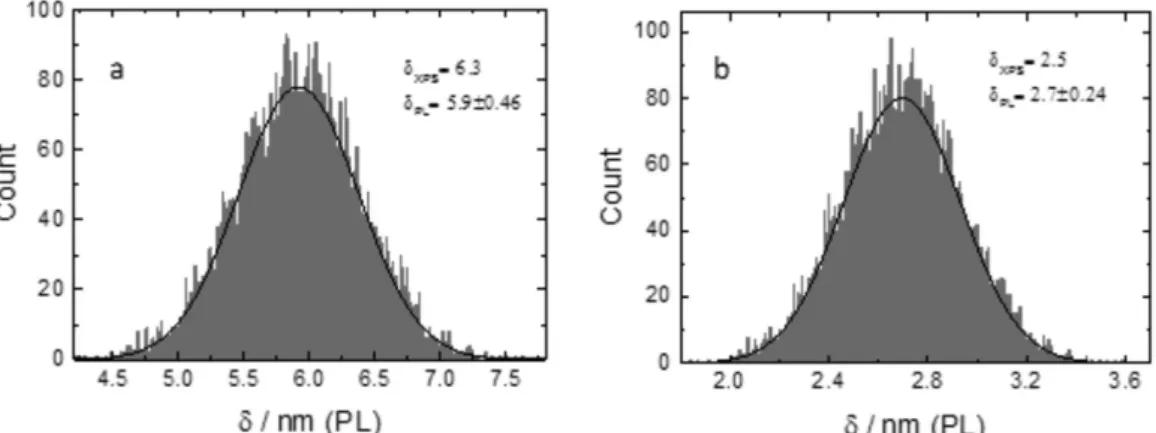
ex-situ XPS measurements are also reported. The dielectric
constant was assumed to have a value ε = 12. As shown
in Figure 4, the uncertainty in ρδ illustrated in Figure 3 is
propagated to the estimate of film thickness, as reported
in Table 1. The insensitivity of equation 5 to ρδ, which
resulted in a large uncertainty shown in Figure 3, also explains the small standard deviation revealed in Figure 4. The mean value of the film thickness obtained by the power-law model is in good agreement with the value
obtained by ex-situ XPS, and the uncertainty in the
estimated value is of the order of the uncertainty in the original XPS measurement.
While the emphasis in the present work was on the
effect of uncertainty in the value of ρδ on assessment of film
thickness, a similar Monte Carlo analysis could be applied for estimation of dielectric constant when film thickness is known. A Monte Carlo analysis may also be used to address
uncertainty in other parameters, for example, in both ρδ and
ε for estimation of film thickness.
Table 1. Regression results for free-machining 18/8 stainless steel in an electrolyte consisting of 22 g L-1 boric acid with NaOH added to bring
the pH to 7.2.5
As received After proprietary treatment
Re / (Ω cm2) 15.3 13.3
R|| / (MΩ cm2) 2.33 16.8
α 0.91 0.91
Q / (µF s-(1-α) cm-2) 11 30.5
δXPS / nm 6.3 2.5
δPL / nm 5.9 ± 0.5 2.7 ± 0.2
Figure 2. Histogram of the oxide film thickness measured by XPS and used to calibrate the power-law model. The standard deviation of the measurement was assigned a value of 10%, and the errors were assumed normally distributed.
Figure 3. The distributed value of ρδ obtained from the thickness values shown in Figure 1 through equation 5 under the assumption that ε = 12:
Comparative analysis
When a reliable value for ρδ is unavailable, useful
information may still be obtained by taking ratios. For example, the ratio of film thickness may be obtained from equation 5 to be
(12)
If film properties ε and ρδ may, respectively, be assumed
equal for the two samples,
(13)
If α1 = α2, then g1 = g2, and values for ε and ρδ are not
required. Thus,
(14)
From Table 1, α1 = α2. Under the assumptions that the
surface treatment did not change the dielectric constant of
the film and that the value of ρδ is the same for the two films,
equation 14. For the data presented in Table 1, Q2/Q1 = 28 ,
which is in good agreement with the ratio of corresponding film thickness measured by XPS of 6.3/2.5 = 2.5. This work shows that film thickness is inversely proportional
to the value of Q.
A similar approach is available when the dielectric constant is the desired quantity. The ratio of values of dielectric constant can be expressed through equation 5 as
(15)
or, if the thickness and ρδ are unchanged between
measurements,
(16)
Under the assumption that α, δ, and ρδ are unaffected
by the different exposures,
(17)
Equation 16 is very sensitive to differences in α because Q
and α are highly correlated in the regression analysis. Thus,
equation 17 should not be used when α1≠α2.
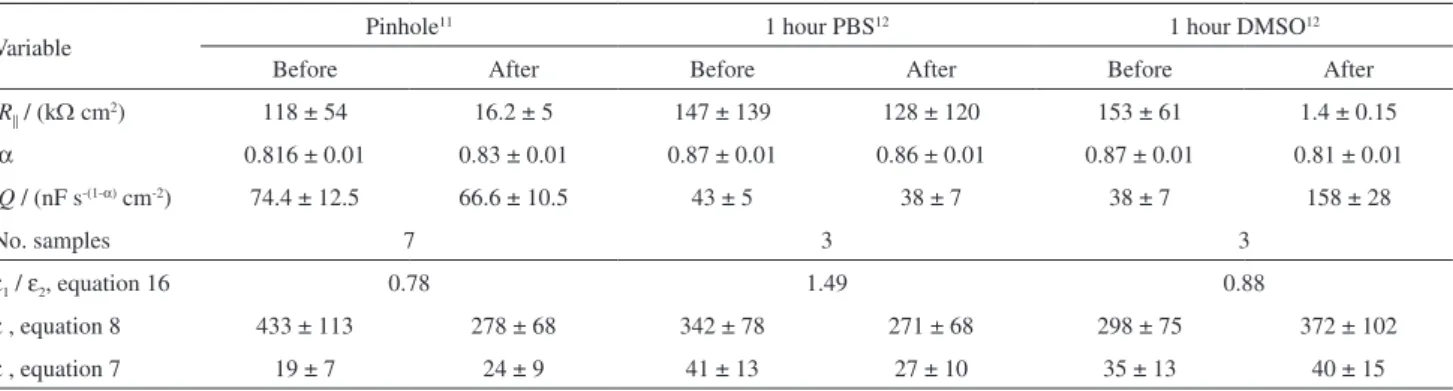
The implications of equation 15 can be explored through analysis of recently reported impedance data on human skin. Results are presented in Table 2 for regression of equation 11 to the impedance of skin before and after
a) being pierced by a needle;11 b) exposure to phosphate
buffered saline solution (PBS) for a 1 h period;12 and
c) exposure to dimethyl sulfoxide (DMSO) for a 1 h
period.12 Values are the mean and one standard deviation
of the parameter value for all exposed skin samples.
Under the assumption that ρδ = 55 Ω cm, the
dielectric constant for skin obtained by use of the power-law model (equation 7) ranged between 19 and 41, as reported in Table 2. These values are in good agreement with values between 29 and 44 reported in the literature that were obtained by reflection of 300 MHz
electromagnetic radiation.14,15 The value of dielectric
constant obtained by use of equation 8, however, yielded physically unreasonable values ranging from 271 to 434. The standard deviations reported in Table 2 were obtained assuming a linear propagation of error with an assumed 10% uncertainty for the thickness of the stratum corneum.
Figure 4. Histogram of film thickness estimated by use of equation 5 under the assumptions that ε = 12 and that ρδ is given as shown in Figure 2: a) steel
As the average value of α was not constant between exposures, equation 17 could not be used to assess the ratio of dielectric constants before and after the treatments specified in Table 2. The ratios obtained by equation 16 are in good agreement with the values of dielectric constant calculated from equation 7.
Conclusions
The power-law model given as equation 7 is a powerful tool for interpretation of CPE parameters for cases where the CPE response is due to an axial or normal distribution of time constants within a film. While equation 8 should in principle apply for a normal distribution of time constants, the formula provides incorrect results. Equation 8 has the advantage of being unambiguous, as every parameter required for the analysis can be obtained from regression of a CPE model to the data, but, as discussed above, it gives incorrect results for a CPE resulting from a normal distribution of time constants. For these cases, the power-law model provides correct results, but is ambiguous
because the parameter ρδ is unknown.
Three approaches were used in the present work to resolve issues caused by the unknown parameter
ρδ. The highest measured frequency that shows CPE
behavior may be used to calculate an upper bound for
the value of ρδ, and physical insight into the experimental
system may be used to estimate a lower limit. As film
thickness is weakly dependent on ρδ, identification of
a range for ρδ may be useful. A conservative estimate
for the range of ρδ associated with the data presented by
Frateur et al.13 yielded an estimated layer thickness of
δ = 1.2 to 12.6 nm, which encompasses the value of 3 nm
obtained from XPS. In other cases, the estimated range
of ρδ is too large. If an independent assessment of film
properties is possible, calibration may be used to obtain a value of ρδ.
The third approach is to calculate ratios that allow cancellation of the unknown quantities. In the present work, the ratio of film thicknesses was found to be in good
agreement with ex-situ XPS measurements, and a ratio of
dielectric constants was ascertained for skin to be in good agreement with expected values.
Acknowledgements
The authors gratefully acknowledge the support of the National Institute of Occupational Safety and Health Award No. R01 OH007493 (Bunge, White, and Orazem) and Hutchinson Technology, USA (Riemer).
References
1. Hirschorn, B.; Orazem, M. E.; Tribollet, B.; Vivier, V.; Frateur, I.; Musiani, M.; J. Electrochem. Soc.2010, 157, C452. 2. Hirschorn, B.; Orazem, M. E.; Tribollet, B.; Vivier, V.;
Frateur, I.; Musiani, M.; J. Electrochem. Soc.2010, 157, C458. 3. Agarwal, P.; Orazem, M. E.; García-Rubio, L. H.; J. Electrochem.
Soc.1992, 139, 1917.
4. Agarwal, P.; Crisalle, O. D.; Orazem, M. E.; García-Rubio, L. H.; J. Electrochem. Soc.1995, 142, 4149.
5. Orazem, M. E.; Tribollet, B.; Vivier, V.; Marcelin, S.; Pébère, N.; Bunge, A. L.; White, E. A.; Riemer, D. P.; Frateur, I.; Musiani, M.; J. Electrochem. Soc.2013, 160, C215. 6. Jorcin, J.-B.; Orazem, M. E.; Pébère, N.; Tribollet, B.;
Electrochim. Acta2006, 51, 1473.
7. Musiani, M.; Orazem, M. E.; Pébère, N.; Tribollet, B.; Vivier, V.;
J. Electrochem. Soc.,2011, 158, C424.
8. Amand, S.; Musiani, M.; Orazem, M. E.; Pébère, N.; Tribollet, B.; Vivier, V.; Electrochim. Acta2013, 87, 693.
Table 2. Results for regression of equation 11 to the impedance of human skin before and after a) being pierced by a needle (pinhole);11 b) exposure to
phosphate buffered saline solution (PBS) for a period of 1 hour;12 and c) exposure to 100% dimethyl sulfoxide (DMSO) for a period of 1 hour.12 Values are
the mean and one standard deviation of the parameter value for all exposed skin samples. The standard deviations reported for the calculation of dielectric constant from equations 7 and 8 were obtained assuming a linear propagation of error with an assumed 10% uncertainty for the thickness of the stratum corneum
Variable Pinhole
11 1 hour PBS12 1 hour DMSO12
Before After Before After Before After
R|| / (kΩ cm2) 118 ± 54 16.2 ± 5 147 ± 139 128 ± 120 153 ± 61 1.4 ± 0.15
α 0.816 ± 0.01 0.83 ± 0.01 0.87 ± 0.01 0.86 ± 0.01 0.87 ± 0.01 0.81 ± 0.01
Q / (nF s-(1-α) cm-2) 74.4 ± 12.5 66.6 ± 10.5 43 ± 5 38 ± 7 38 ± 7 158 ± 28
No. samples 7 3 3
ε1 / ε2, equation 16 0.78 1.49 0.88
ε , equation 8 433 ± 113 278 ± 68 342 ± 78 271 ± 68 298 ± 75 372 ± 102
9. Hsu, C. H.; Mansfeld, F.; Corrosion2001, 57, 747.
10. White, E. A.; Orazem, M. E.; Bunge, A. L.; J. Electrochem. Soc.2012, 159, G161.
11. White, E. A.; Orazem, M. E.; Bunge, A. L.; Pharm. Res.2013,
30, 2036.
12. White, E. A.; Orazem, M. E.; Bunge, A. L.; Pharm. Res.2013,
30, 2607.
13. Frateur, I.; Lartundo-Rojas, L.; Méthivier, C.; Galtayries, A.; Marcus, P.; Electrochim. Acta2006, 51, 1550.
14. Petäajä, L.; Nuutinen, J.; Uusaro, A.; Lahtinen, T.; Ruokonen, E.;
Physiol. Meas.2003, 24, 383.
15. Jensen, M. R.; Birkballe, S.; Nφrregaard, S.; Karlsmark, T.;
Clin. Physiol. Funct. Imaging2012, 32, 317.