www.atmos-chem-phys.net/13/2779/2013/ doi:10.5194/acp-13-2779-2013
© Author(s) 2013. CC Attribution 3.0 License.
Atmospheric
Chemistry
and Physics
Geoscientiic
Geoscientiic
Geoscientiic
Geoscientiic
Observation-based assessment of stratospheric fractional
release, lifetimes, and ozone depletion potentials of ten
important source gases
J. C. Laube1, A. Keil2, H. B¨onisch2, A. Engel2, T. R¨ockmann3, C. M. Volk4, and W. T. Sturges1
1School of Environmental Sciences, University of East Anglia, Norwich, UK
2Institute for Atmospheric and Environmental Sciences, University of Frankfurt, Frankfurt (Main), Germany 3Institute for Marine and Atmospheric Research, Utrecht University, Utrecht, the Netherlands
4Department of Physics, University of Wuppertal, Wuppertal, Germany
Correspondence to:J. C. Laube (j.laube@uea.ac.uk)
Received: 9 October 2012 – Published in Atmos. Chem. Phys. Discuss.: 30 October 2012 Revised: 14 February 2013 – Accepted: 15 February 2013 – Published: 8 March 2013
Abstract. Estimates of the recovery time of stratospheric ozone heavily rely on the exact knowledge of the processes that lead to the decomposition of the relevant halogenated source gases. Crucial parameters in this context are frac-tional release factors (FRFs) as well as stratospheric lifetimes and ozone depletion potentials (ODPs). We here present data from the analysis of air samples collected between 2009 and 2011 on board research aircraft flying in the mid- and high-latitude stratosphere and infer the above-mentioned param-eters for ten major source gases: CFCl3 (CFC-11), CF2Cl2 (CFC-12), CF2ClCFCl2 (CFC-113), CCl4 (carbon tetra-chloride), CH3CCl3(methyl chloroform), CHF2Cl (HCFC-22), CH3CFCl2 (HCFC-141b), CH3CF2Cl (HCFC-142b), CF2ClBr (H-1211), and CF3Br (H-1301). The inferred cor-relations of their FRFs with mean ages of air reveal less de-composition as compared to previous studies for most com-pounds. When using the calculated set of FRFs to infer equiv-alent stratospheric chlorine, we find a reduction of more than 20 % as compared to the values inferred in the most recent Scientific Assessment of Ozone Depletion by the World Me-teorological Organisation (WMO, 2011). We also note that FRFs and their correlations with mean age are not gener-ally time-independent as often assumed. The stratospheric lifetimes were calculated relative to that of CFC-11. Within our uncertainties the ratios between stratospheric lifetimes inferred here agree with the values in recent WMO reports except for CFC-11, CFC-12 and CH3CCl3. Finally, we calcu-late lower ODPs than recommended by WMO for six out of
ten compounds, with changes most pronounced for the three HCFCs. Collectively these newly calculated values may have important implications for the severity and recovery time of stratospheric ozone loss.
1 Introduction
The stratospheric lifetimes of these ODSs are equally im-portant in this context as the recovery time of the ozone layer will depend on these quantities. This is especially true in the case of the chlorofluorocarbons, where the stratospheric life-times are equivalent to the overall atmospheric lifelife-times. One of the most important observation-based studies of strato-spheric lifetimes is that of Volk et al. (1997), who used and further developed the theoretical framework of Plumb and Ko (1992) and Plumb (1996) to infer steady-state life-times of six important ozone-depleting halocarbons: CFCl3 (CFC-11), CF2Cl2(CFC-12), CF2ClCFCl2(CFC-113), CCl4 (carbon tetrachloride), CH3CCl3 (methyl chloroform), and CF2ClBr (H-1211). For this purpose they utilised the com-pact correlations that long-lived trace gases form with each other and also with the mean ages of air (i.e. the mean stratospheric transit times). We here use a similar method and measurements on air samples collected in the mid- and high-latitude stratosphere to evaluate the stratospheric life-times of ten important ODSs: CFC-11, CFC-12, CFC-113, CCl4, CH3CCl3, CHF2Cl (HCFC-22), CH3CFCl2 (HCFC-141b), CH3CF2Cl (HCFC-142b), H-1211, and CF3Br (H-1301). Moreover, the calculation of the FRFs and their re-lation to mean ages of air enables us to derive observation-based semi-empirical ozone depletion potentials (ODPs) for these compounds.
2 Sample collection, measurements and data analysis
The air samples were collected using whole-air samplers op-erated on board the M55 Geophysica high altitude aircraft (see Kaiser et al., 2006, and Laube et al., 2010a, for details on the sampling systems and Cairo et al., 2010, for a description of a typical Geophysica campaign and payload). Two Geo-physica flights departed from Oberpfaffenhofen, Germany, on 30 October and 4 November 2009 (covered altitude, lat-itude and longlat-itude ranges: 10–20 km, 48–54◦N, 7–12◦E) and nine from Kiruna, Sweden, between 20 January and 2 February 2010, and on 11 and 16 December 2011 (9–19 km, 62–77◦N, 1◦W–29◦E, RECONCILE and ESSENCE cam-paigns). The samples were then analysed via gas chromatog-raphy with mass spectrometric detection (GC-MS): 138 sam-ples at the University of East Anglia (UEA, see Laube et al., 2010b, for analysis details) and 72 at the University of Frankfurt (UFra). All samples analysed in Frankfurt were measured using a system similar to the one at UEA except that the detector is a quadrupole mass spectrometer (Agilent 5975 MSD). In addition to the compounds mentioned above, we used measurements of SF6 to infer stratospheric mean ages of air.
All data underwent a thorough quality check as is ex-plained in the following. Some of the measurements car-ried out at UFra showed significantly worse analytical preci-sion than the UEA measurements. These data were excluded based on the following procedure: first we calculated the
av-erage 2σ precision (in %) of all samples analysed at UEA. In order to represent the range of precisions observed at UEA, we then derived the 2σ standard deviation of this average precision. UFra measurements with relative precisions larger than this range were excluded (11: 6 samples, CFC-113: 13, HCFC-141b: 13, H-1301: all, H1211: 35, CH3CCl3: 26) In addition, most samples from the 2010 and 2011 cam-paigns were contaminated with several parts per trillion (ppt) of HCFC-142b and were consequently excluded. For CCl4 we excluded the 2010 data as these samples were analysed several months after collection and CCl4is not stable in the stainless steel canisters over such extended periods (see also Laube et al., 2008). Finally, SF6data from all UFra samples and also from the 2011 Geophysica campaign (the latter was analysed exclusively at UEA) could not be used for the cal-culation of mean ages of air due to limited instrument preci-sions at the time.
Table 1 shows the calibration scales used and the average measurement precisions of the remaining data set. Also dis-played is a comparison of mixing ratios observed close to the tropopause with northern hemispheric (NH) monthly mean mixing ratios as reported by the ground-based NOAA-ESRL network. The latter were obtained from http://www.esrl.noaa. gov/gmd/ (see Montzka et al., 1999, and Hall et al., 2011, for details; GC-MS data from flasks were used except for SF6, CFC-11 and CFC-12, where combined data were available, and CCl4, where in situ data were preferred for the above mentioned reasons), with the exception of H-1301 where no long-term global trend was available at the time. Thus the H-1301 time series was obtained from archived samples col-lected at Cape Grim, Tasmania (41◦S, 145◦E, Newland et al., 2012). This time series was shifted by one year to ac-count for interhemispheric transport times (Levin and Hes-shaimer, 1996) and showed very good agreement with the H-1301 mixing ratios observed close to the tropopause in this study.
We also compared long-term time trends as observed by both laboratories (NOAA and UEA) at the ground-based station at Cape Grim. Agreement within measurement un-certainties was observed for eight compounds. However, we found small but consistent offsets for three compounds: CFC-113 (+2 %, UEA-NOAA), HCFC-142b (−2 %) and
CH3CCl3 (+4 %) (see Supplement). After correcting for
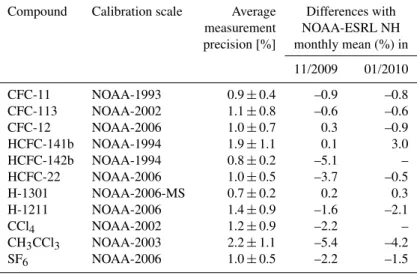
Table 1.Overview of reported compounds, calibration scales, average measurement precisions (including the 1σstandard deviation of that average), and the percentage difference between mixing ratios observed close to the tropopause and northern hemispheric monthly mean mixing ratios as reported by the ground-based NOAA-ESRL network (except for H-1301; see text).
Compound Calibration scale Average Differences with measurement NOAA-ESRL NH precision [%] monthly mean (%) in
11/2009 01/2010
CFC-11 NOAA-1993 0.9±0.4 –0.9 –0.8
CFC-113 NOAA-2002 1.1±0.8 –0.6 –0.6
CFC-12 NOAA-2006 1.0±0.7 0.3 –0.9
HCFC-141b NOAA-1994 1.9±1.1 0.1 3.0
HCFC-142b NOAA-1994 0.8±0.2 –5.1 –
HCFC-22 NOAA-2006 1.0±0.5 –3.7 –0.5
H-1301 NOAA-2006-MS 0.7±0.2 0.2 0.3
H-1211 NOAA-2006 1.4±0.9 –1.6 –2.1
CCl4 NOAA-2002 1.2±0.9 –2.2 –
CH3CCl3 NOAA-2003 2.2±1.1 –5.4 –4.2
SF6 NOAA-2006 1.0±0.5 –2.2 –1.5
lived of the compounds reported here and has dominant tro-pospheric sinks which could explain these differences be-tween ground-based stations and the upper troposphere. Nev-ertheless, we consider the maximum difference as an addi-tional uncertainty for the calculation of the stratospheric life-times of CH3CCl3 and HCFC-142b (Sect. 4.2). The 2011 data set could not be compared as the lowest altitude samples from these flights were collected deeper in the stratosphere and already showed significant decomposition.
Finally, we compared our SF6and CFC-11 mixing ratios during the seven 2010 Geophysica flights with in situ GC-ECD (Electron Capture Detector) measurements obtained by the High Altitude Gas Analyzer (HAGAR; see Werner et al., 2010, for details) with average 1σ precisions of 1.3 % for SF6and 1.9 % for CFC-11. Both data sets from the Geophys-ica flights are reported on the same NOAA calibration scales and showed very good agreement within their 1σ measure-ment uncertainties.
3 Methodology
3.1 Fractional release and mean age of air
Fractional release factors were calculated using the method described in Laube et al. (2010a), which is comparable to the one used in Schauffler et al. (2003) and Newman et al. (2006). To correct for the underlying tropospheric trend, we firstly infer the mean ages of air which can be described as average stratospheric transit times. Similar to a variety of other studies (e.g. Harnisch et al., 1996; Volk et al., 1997; Engel et al., 2009; B¨onisch et al., 2009), we use measure-ments of SF6 for this purpose. For those flights with insuf-ficient SF6precision (exclusively high latitudes, see above),
we used the 2010 high-latitude correlation between SF6and CFC-12 mixing ratios (χ )to infer mean ages (Ŵ)via Eq. (1).
Ŵ=9.78−0.0287·χCFC−12+6.884·10−5·(χCFC−12)2
−9.19923·10−8·(χCFC−12)3 (1) This methodology is similar to the one in Laube et al. (2010a). The validity range of this polynomial is limited to the ranges observed, i.e. mean ages from 0 to 5.4 years and CFC-12 mixing ratios from 540 to 235 ppt. For 23 samples we inferred mean ages above 5.4 years, and consequentially these were excluded from further analysis. Moreover, mean ages derived via Eq. (1) can not be used to infer FRFs of CFC-12.
We then calculated the average mixing ratios that were present in the individual air parcel when it entered the strato-sphere using the mean agesŴand a parameterisation of its re-lation to the squared width of the age spectrum12(12/ Ŵ=
3=0.7 as in Engel et al., 2002). Laube et al. (2010a) tested the sensitivity of this parameterisation with different ratios and found the corresponding changes to have little influence on fractional release. By relating these mixing ratios to the amount actually observed in the samples via Eq. (2) (adapted from Solomon and Albritton, 1992), we infer fractional re-lease factors.
FRFi(x, y, z, t )= ¯
χi,entry−χi(x, y, z, t ) ¯
χi,entry
(2)
χi(x, y, z, t )is the mixing ratio of a long-lived trace gasiat
stratospheric location (x, y, z)and time (t ), andχi,entry¯ is the
4 Stratospheric lifetimes
Volk et al. (1997) used the slope of correlations at the extra-tropical tropopause to derive stratospheric steady-state life-times via two different methods. We here use the relative method which is based on the knowledge of the lifetime of one tracer. According to Volk et al. (1997) and using CFC-11 as the reference tracer, the stratospheric lifetimeτ of a tracer
ican then be obtained from Eq. (3).
τi=
τCFC−11·σ¯CFCσi¯−11
dσi dσCFC−11
TP
(3)
¯
σis the average atmospheric mixing ratio in steady state, and
dσi dσCFC−11
TPis the slope of the mixing ratio correlation at the extratropical tropopause in steady state.
The ratio of the stratospheric lifetimes is thus dependent on the atmospheric average mixing ratios and the slope at the extratropical tropopause of the correlation of the two trac-ers, and these quantities need to be evaluated in steady state. The steady-state atmospheric average mixing ratios may be derived with little error from observed (non-steady) mixing ratios (χi)as they are dominated by the troposphere, which
is well-mixed (and thus close to steady state) for the long-lived species considered here. However, observed slopes at the tropopause are heavily influenced by transience due to tropospheric growth or decline. We here use the method of Volk et al. (1997) (cf. Eq. 25 in that study) that relates the observed transient gradient of a tracer with respect to mean age at the tropopause (dχ /dŴ) to the respective gradient
dσ/dŴ, corresponding to a steady state situation with the same tropopause mixing ratio as observed:
dσi
dŴ =
dχi
dŴ +γ0,i·σ0,i
1−2·γ0,i·3
(4)
σ is the steady-state mixing ratio (index 0=at the
tropopause), γ0 is the effective linear tropospheric growth rate in year−1(cf. Volk et al. (1997), Eq. A13), and3is the ratio of the squared width of the age spectrum12to mean ageŴ.
In order to minimise uncertainties resulting from the gradi-ents of tracers against mean age, we substitutedχi/dŴwith
(dχi/dχCFC−11)(dχCFC−11/dŴ)in Eq. (4) instead of deriv-ing gradients with respect to age (and subsequently correc-tion factors) for each species as done in Volk et al. (1997). This leaves only the slope of CFC-11 against mean age to be determined in addition to the slopes relative to CFC-11. CFC-11 is one of the shorter-lived tracers considered here, thus giving a comparably large (and thus well-constrained) slope against mean age. Moreover, CFC-11 has one of the best precisions and the lowest number of excluded samples resulting in the most reliable data set.
-50 -45 -40 -35 -30 -25 -20 -15 -10 -5 0
0 1 2 3 4
(Average) mean age [years]
S
lo
p
e
o
f
C
F
C
-1
1
v
s
m
e
a
n
a
g
e
[p
p
t/
y
e
a
r]
0 50 100 150 200 250
C
F
C
-1
1
[
p
p
t]
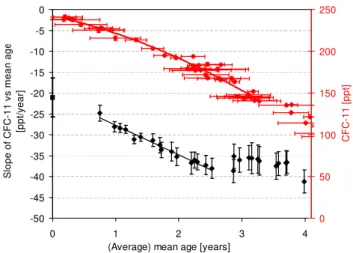
Fig. 1. Correlation of CFC-11 mixing ratios and mean age of air (red diamonds) and the corresponding slope evolution against the average mean age of air (black diamonds). Fitting a linear regres-sion (black line) through the slope data between 0.7 and 2.5 years of average mean age yields a slope of (–20.6±4.6) ppt yr−1at a mean age of 0 (black square). The uncertainty of this y-intercept was esti-mated similar to Volk et al. (1997) using a “bootstrap” method (500 samples) and a scaling factor of the resulting uncertainty to account for the interdependency of the individual points.
The steady state slope relative to CFC-11 at the tropopause required in Eq. (3) is then readily obtained by using Eq. (4) for a tracer and for CFC-11:
dσi
dσCFC−11
=
dσi
dŴ
dσCFC−11
dŴ =
dχi
dχCFC−11
dχCFC−11
dŴ +γ0,i·σ0,i
dχCFC−11
dŴ +γ0,CFC−11·σ0,CFC−11
·1−2·γ0,CFC−11·3 1−2·γ0,i·3
. (5)
The less precise slope dχCFC−11/dŴ now appears in both the nominator and denominator resulting in uncertainties par-tially cancelling out. Overall in Eq. (5) the principal informa-tion always comes from the well constraineddχi/dχCFC−11. The more uncertain slopedχCFC−11/dŴ is in many cases a small correction term that only gains significant influence when tropospheric growth is very large. We calculate the effective linear growth rates γ0 as in Volk et al. (1997) by approximating the tropospheric trend of the last 5 years as obtained from NOAA-ESRL (see Sect. 2) with a quadratic polynomial.3is again a parameterisation of the width of the age spectrum, and we here use three different values (0.7, 1.25 and 1.75) to assess the resulting lifetime uncertainties.
We derive a slope against mean age of (−20.6±
from the 270 ppt used in the study of Volk et al. (1997), which we also take into account in Eqs. (3) to (5). In other respects our method is similar to that of Volk et al. (1997). Slopes along the CFC-11–age relation are measured by fit-ting linear regression lines over moving 2-year-mean age in-tervals using a bivariate error-weighted fit (Cantrell, 2008) to account for uncertainties in both axes. We then plot these slopes against the average mean age (see Fig. 1) and fit a re-gression line from 0.7 to 2.5 years that is extrapolated to de-rive the slope at the tropopause. We exclude data that could be influenced by the polar vortex (i.e. samples from the 2010 high-latitude campaign with CFC-11 mixing ratios<140 ppt, which is equivalent to vortex data at a potential temperature of∼380 K) and choose a smaller age range as compared to
Volk et al. (1997) (0.8 to 3.5 years), as we observe higher variability of the slopes at larger mean ages. The uncertainty of the tropopause slope value is estimated using the bootstrap technique in the same way as described in Volk et al. (1997). Using−20.6 ppt yr−1as the slope of CFC-11 against mean
age at the tropopause and the above mentioned substitutions yields Eq. (6) for the derivation of lifetimes relative to that of CFC-11.
τi=τCFC−11·
¯
σi ¯
σCFC−11
·−20.6+γ0,CFC−11·σ0,CFC−11
−20.6· dχi
dχCFC−11+γ0,i
·σ0,i·
1−2·γ0,i·3
1−2·γ0,CFC−11·3
(6) We calculate average atmospheric mixing ratios for January 2010 again using NOAA-ESRL data (i.e. global means) for the troposphere. For the stratosphere we fit average profiles of mixing ratio versus pressure to a data set including all Geophysica samples and in addition 44 samples collected on board stratospheric balloons launched by the French Space Agency CNES (Centre National d’Etudes Spatiales). Two of these balloon flights were launched from Kiruna in March 2009 and April 2011, while two others collected samples in the tropical stratosphere above Teresina, Brazil (5◦S, 42◦W), in June 2005 (see Laube et al., 2010a, for the lat-ter; overall balloon altitude range: 10–34 km). To account for differences in tropopause altitudes, we subdivide the strato-sphere into area-weighted high- (70–90◦), mid- (25–70◦) and tropical- (25◦N–25 ◦S) latitude bins. We estimate the un-certainties of these profiles by varying the boundaries be-tween the three regions by±5◦. To simulate the variability of the pressure tropopause, the profiles were shifted by±20 % above 400 hPa. The respective uncertainties in average atmo-spheric mixing ratios were less than 2.1 % in all cases. All average mixing ratios and effective linear growth rates can be found in the Supplement.
The most crucial observational quantity in Eq. (6), ac-counting for the major part of the uncertainty of the life-time result, is the slope of mixing ratio versus CFC-11 at
(A)
(B) 100
150 200 250 300 350 400 450 500 550
C
F
C
-1
2
[
p
p
t]
0 1 2 3 4 5 6 7 8 9
0 50 100 150 200 250
CFC-11 [ppt]
C
H3
C
C
l3
[
p
p
t]
Mid latitudes, 2009 (UEA) High latitudes, 2010 (UEA) High latitudes, 2010 (UFra) High latitudes, 2011 (UEA) Trend-corrected, all data
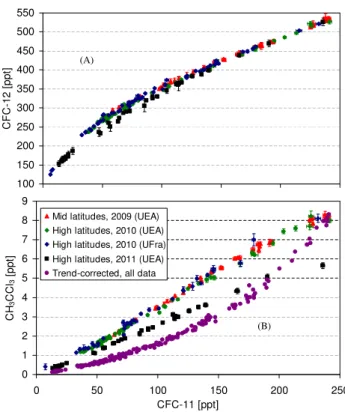
Fig. 2.Compact correlations of CFC-11 mixing ratios with those of CFC-12(A)and CH3CCl3(B)in the mid- and high-latitude
strato-sphere as obtained from whole-air samples collected during aircraft campaigns in 2009 (red), 2010 (blue and green) and 2011 (black). Analysis of the 2010 samples was split between the University of Frankfurt (UFra, blue) and the University of East Anglia (UEA, green), with excellent agreement between the two data sets for all compounds. When applying a first-order correction for the influ-ence of the changing tropospheric trend, the correlations become very similar (purple). This is only displayed for(B)as the respec-tive changes in tropospheric abundances of CFC-11 and CFC-12 are small and thus the “trend-corrected” correlation is almost indistin-guishable from the other correlations.
the tropopause. Our derivation of these slopes and their un-certainties follows again the methods laid out in Volk et al. (1997). A detailed description of the methodology, fig-ures, and the derived slopes are also given in the Supple-ment. The estimated uncertainties of the derived slopes at the tropopause vary between about 5 % and 33 %, depend-ing on the amount of available samples, their precision, and the scatter and the curvature of the correlation with CFC-11.
5 Results and discussion
5.1 Fractional release and mean age of air
-0.6 0.4 1.4 2.4 3.4 4.4 5.4 6.4
M
e
a
n
a
g
e
[
y
e
a
rs
] CFC-11
-0.2 0.8 1.8 2.8 3.8 4.8 5.8
-0.1 0.1 0.3 0.5 0.7 0.9
Fractional Release Factor (FRF)
M
e
a
n
a
g
e
[
y
e
a
rs
]
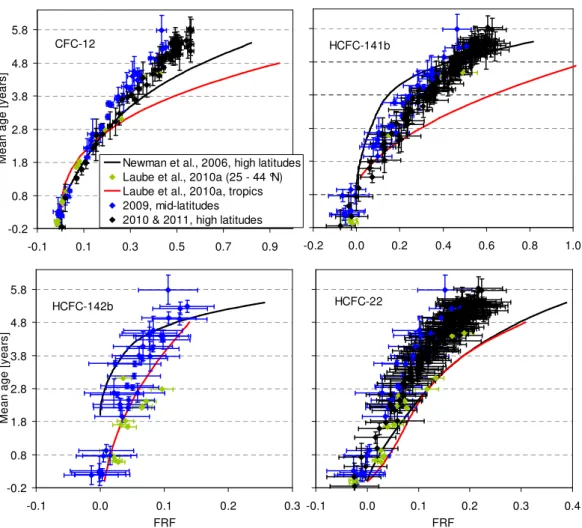
Newman et al., 2006, high latitudes Laube et al., 2010a (25 - 44 °N) Laube et al., 2010a, tropics 2009, mid-latitudes 2010 & 2011, high latitudes CFC-113
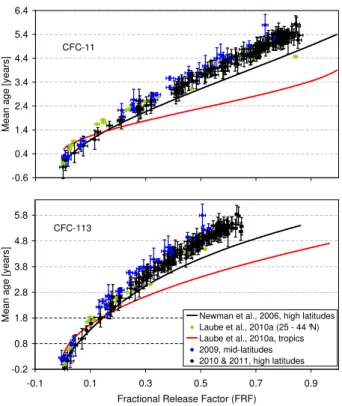
Fig. 3.Correlation of fractional release factors with mean age of air for CFC-11 and CFC-113. High- (black) and mid-latitude (blue) data from this study are shown alongside with tropical and extra-tropical data from Laube et al. (2010a) (FRFs from 2005 and 2006), as well as high-latitude correlations from Newman et al. (2006) (data from 2000). The error bars were derived using the 1σ mea-surement uncertainty (or its equivalent in mean age). To account for the uncertainty in entrance mixing ratios, we also added the percent-age difference between the NOAA-ESRL stations in Tutuila, Amer-ican Samoa (14.25◦S, 170.56◦W), and Mauna Loa, Hawaii, United States (9.54◦N, 155.58◦W), as well as the respective NOAA 1σ measurement uncertainties, both averaged over 2010. For samples for which mean age was derived from a correlation with CFC-12 (see text), we added an additional error of 0.06 years from the un-certainty of this correlation.
as obtained from the three Geophysica campaigns. Firstly, it is notable from this figure that there is very good agree-ment between the different laboratories (at UEA and UFra), which has been observed for all compounds reported here. Secondly, in the case of CFC-12 and CFC-11 tropospheric changes have been minor in recent years. Thus the correla-tions from the three campaigns are very similar. In the case of CH3CCl3, there is a distinct difference between the first two campaigns which took place in November 2009 and Jan-uary 2010 and the third campaign almost two years later. Tropospheric abundances of CH3CCl3have decreased con-siderably over this period (WMO, 2011), which is reflected in this correlation. For CH3CCl3the discrepancy between the two correlations is also decreasing with increasing decompo-sition.
Also shown in Fig. 2 is a “trend-corrected” correlation of CFC-11 and CH3CCl3which is calculated by multiplying the FRFs with the mixing ratio observed at the tropopause (here: January 2010). Although this first order correction is not ex-pected to yield a correlation representative of a steady state, the differences between the data sets diminish, demonstrating the potential influence of trend changes but also the quality of the applied correction.
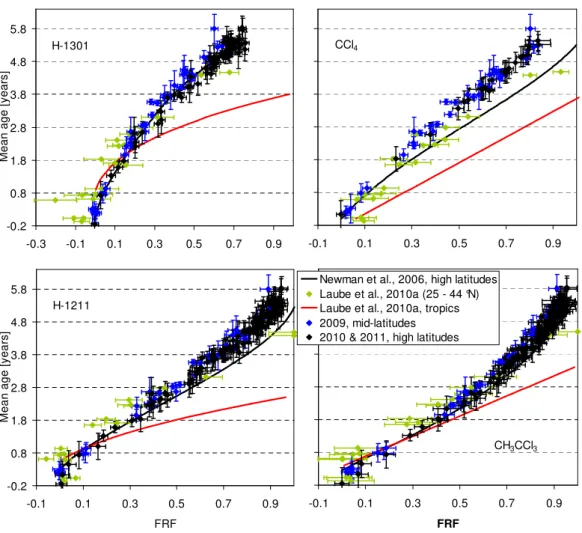
Figure 3 shows the FRF correlation with mean age for CFC-11 and CFC-113 in comparison to the polynomial re-lationships inferred by Newman et al. (2006) from high-latitude flights and Laube et al. (2010a) from tropical and extra-tropical samples. As expected for compounds with photolysis as the major sink, CFC-11 and CFC-113 are de-composing fastest in the tropical stratosphere where the high-est actinic fluxes occur. When comparing different latitudes we find similarly to Schauffler et al. (1999) that fractional re-lease is lowest in the mid-latitudinal stratosphere. This can be understood in terms of the seasonal development of the winter/spring polar correlations. Isolation of the polar vortex in association with differential descent and horizontal mix-ing leads to the formation of separate polar correlations on the concave side of the climatologic mid-latitudinal correla-tion curves over the course of the winter (Plumb, 2007). For most species considered here, this tends to decrease mixing ratios at a given age surface in the lower stratosphere, and thus increase fractional release. Correlations of the remain-ing eight compounds are shown in Figs. 4 and 5, with the highest FRFs derived for H-1211 and CH3CCl3and the low-est for HCFC-22 and HCFC-142b. Respective polynomial fit functions derived from these correlations can be found in the Supplement.
Also apparent from Figs. 3 to 5 is a discrepancy in comparison to the high-latitude correlations of Newman et al. (2006). Most notably the two dependencies diverge with increasing mean age and FRF. We find this for 7 out of the 10 compounds reported here, i.e. all except HCFC-141b, HCFC-142b and H-1301. Both of the HCFCs still showed significant nonlinear growth rates at the time of sample col-lection for the work of Newman et al. (2006) (i.e. in 2000) which adds significant uncertainties (as has been noted in Daniel and Velders, 2007). Moreover, for HCFC-142b our data set shows FRFs that are too small to evaluate differ-ences with Newman et al. (2006) within the uncertainties. The Newman et al. (2006) study was also based mostly on data from a high-latitude campaign (Schauffler et al., 2003) but for H-1301 used a completely different data set originat-ing from an earlier campaign and a variety of latitudes (and also with much higher uncertainties; Schauffler et al., 1999). When not considering these three compounds, we find sim-ilar divergence between our data set and the correlations of Newman et al. (2006), indicating that the differences might be related to differences in mean age.
-0.2 0.8 1.8 2.8 3.8 4.8 5.8
-0.1 0.1 0.3 0.5 0.7 0.9
M
e
a
n
a
g
e
[
y
e
a
rs
]
Newman et al., 2006, high latitudes Laube et al., 2010a (25 - 44 °N) Laube et al., 2010a, tropics 2009, mid-latitudes 2010 & 2011, high latitudes CFC-12
-0.2 0.0 0.2 0.4 0.6 0.8 1.0
HCFC-141b
-0.2 0.8 1.8 2.8 3.8 4.8 5.8
-0.1 0.0 0.1 0.2 0.3
FRF
M
e
a
n
a
g
e
[
y
e
a
rs
]
HCFC-142b
-0.1 0.0 0.1 0.2 0.3 0.4
FRF HCFC-22
Fig. 4.Same as in Fig. 3 but for CFC-12, HCFC-141b, HCFC-142b and HCFC-22.
both trace gases give comparable mean ages (e.g. Strunk et al., 2000; Engel et al., 2002). An exception can be the mid-dle high-latitudinal stratosphere if influenced by descending mesospheric air depleted in SF6, which results in erroneously high mean ages (e.g. Engel et al., 2006). We have found no evidence for significant mesospheric influence here. High-latitude data from nine different Geophysica flights all fol-low the same correlations. Moreover, the high-latitude and the mid-latitude data do not converge as mean age increases. As the mid-latitude data set was obtained in late autumn at altitudes between 10 and 20 km, it is very unlikely to be influenced by mesospheric air. At higher latitudes even small amounts of mesospheric air would result in signifi-cantly enhanced mean age as this air contains very little SF6. On the other hand, the FRF of CFC-11 would only be in-creased slightly as CFC-11 is depleted to very low values in the middle stratosphere already. Therefore the high-latitude FRF–mean-age correlation would approach or even cross the mid-latitude correlation. This is not observed and we con-clude that there is no significant mesospheric influence in our data set. An additional confirmation comes from
simul-taneous stratospheric measurements of H2 by the HAGAR instrument. Extreme H2 mixing ratios of less than 400 and more than 800 parts per billion (ppb) have been observed in the vicinity of mesospherically influenced air (Engel et al., 2006), but the range observed here was considerably smaller, ranging from 470 to 590 ppb.
Mean ages derived from CO2 are not sensitive to meso-spheric influences (Engel et al., 2006). If the data set used by Newman et al. (2006) was influenced by mesospheric or even higher stratospheric air, this would lead to a modest shift of the FRF–mean-age correlation similar to the observed dif-ference. Moreover, the arctic stratosphere shows significant interannual variability especially in the winter, which could also explain the observed differences. There are a number of other possible contributors for these differences such as the difficulties in deriving mean ages from CO2, e.g. because of the strong interannual variability of its growth rate (Stiller et al., 2012), and possible long-term changes in stratospheric mean age (Engel et al., 2009 and Stiller et al., 2012).
-0.2 0.8 1.8 2.8 3.8 4.8 5.8
-0.3 -0.1 0.1 0.3 0.5 0.7 0.9
M
e
a
n
a
g
e
[
y
e
a
rs
]
H-1301
-0.2 0.8 1.8 2.8 3.8 4.8 5.8
-0.1 0.1 0.3 0.5 0.7 0.9
FRF
M
e
a
n
a
g
e
[
y
e
a
rs
]
H-1211
-0.1 0.1 0.3 0.5 0.7 0.9
CCl4
-0.1 0.1 0.3 0.5 0.7 0.9
FRF
Newman et al., 2006, high latitudes Laube et al., 2010a (25 - 44 °N) Laube et al., 2010a, tropics 2009, mid-latitudes 2010 & 2011, high latitudes
CH3CCl3
Fig. 5. Same as in Fig. 3 but for H-1301, H-1211, CCl4and CH3CCl3.
tropospheric growth) are coupled by stratospheric transport and can not be easily separated from each other. To derive steady-state quantities from transient in situ observations, Volk et al. (1997) solved this problem for the simpler case of the gradient at the tropopause, as displayed in Eq. (7) (cf. Eq. (A11) in Volk et al., 1997).
dχ
dŴ = −χ0(t )·(β0+γ0−2·β0·γ0·3) dχ
dŴ−gradient of mixing ratio against mean age atŴ=0
χ0(t )−mixing ratio atŴ=0 (7)
Here,β0is a term describing the steady state loss rate, while
γ0is again the effective tropospheric growth rate. Thus a cor-rection for tropospheric growth needs to take into account not onlyγ0but also its interaction withβ0via the age spectrum (3=12/ Ŵ as noted above) in the last term of Eq. (7). A similar correction of FRFs (or of tracer correlations in gen-eral) inside the stratosphere is not possible from observations
alone as it would require prior knowledge of stratospheric transport and loss (Volk et al., 1997). Therefore the FRFs derived here can not be considered as equilibrium quantities and are only valid as long as the tropospheric trends of the re-spective compounds do not significantly change. This could also explain the differences between our FRF–mean-age cor-relation and that of Newman et al. (2006), especially for HCFC-141b; as growth rates became more linear the shape of this correlation changed significantly. In 2009–2011 it be-came very similar to that of HCFC-22, which has been grow-ing more linearly since the 1990s (WMO, 2011).
could then instead be related to differences in mean age. The FRFs presented here are more up-to-date than the FRFs used in WMO (2011). However, with the available data it is not possible to resolve their seasonality or the potential variabil-ity introduced by the mean age part of these correlations.
5.2 Stratospheric lifetime evaluation
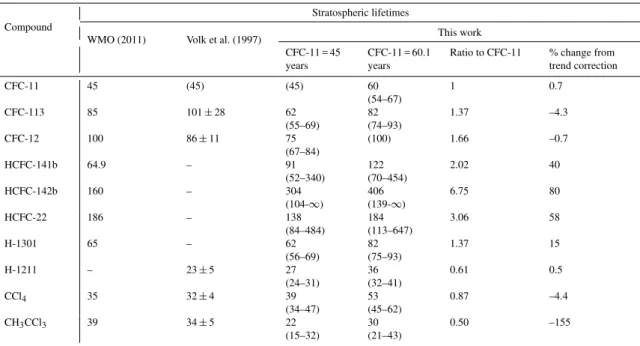
Table 2 gives an overview of stratospheric lifetimes reported in the most recent WMO Ozone Assessment (WMO, 2011), Volk et al. (1997), and those derived here including uncer-tainty ranges. The latter were inferred from uncertainties in-troduced by the tracer versus CFC-11 and CFC-11 versus mean-age correlation slopes, and different widths of the age spectrum. For CH3CCl3and HCFC-142b we also considered the maximum difference between our upper tropospheric and NOAA NH mixing ratios (see Sect. 2). We generally find that the stratospheric lifetime uncertainties are dominated by the two slope uncertainties with a smaller contribution from the different widths of the age spectrum.
Our stratospheric lifetimes were initially calculated as-suming a lifetime of 45 years for CFC-11. Based on this assumption our stratospheric lifetimes agree with those in WMO (2011) and Volk et al. (1997) within the uncertainty ranges for six compounds. It should be noted though that for H-1211 only an overall lifetime is given in WMO (2011), and that H-1301 and the three HCFCs were not evaluated in Volk et al. (1997). For three compounds (i.e. CFC-113, CFC-12 and CH3CCl3), we find stratospheric lifetimes that are lower than those in Volk et al. (1997) but still agree within the com-bined uncertainties – but not with those in WMO (2011). However, there is no uncertainty range given in WMO (2011) so the lifetimes could still agree within the combined respec-tive errors. For CH3CCl3we find a 42 % lower stratospheric lifetime than the one presented in WMO (2011). A much smaller stratospheric lifetime of CH3CCl3would result in a number of implications. The overall atmospheric CH3CCl3 lifetime of 5 years (WMO, 2011) is dominated by its OH loss. Replacing the stratospheric component with our esti-mate would decrease its overall lifetime by≈0.43 years or
about 8 %. Because of its short lifetime with respect to OH, this compound has been used in a number of studies to esti-mate levels of OH in the atmosphere (e.g. Krol et al., 2003; Prinn et al., 2005; Montzka et al., 2011). Therefore a sig-nificant stratospheric lifetime reduction would have an im-pact on derived OH concentrations, which has the potential to change the atmospheric lifetimes of a large number of trace gases that are dominated by reaction with OH.
Table 2 also highlights the limitations of our method to de-rive lifetimes for compounds that are very long-lived in the stratosphere such as HCFC-22 and HCFC-142b. Because of the small loss rates, the corrected correlation slopes of these compounds are very small, which leads to large uncertainty ranges. In the case of HCFC-142b, we even calculate small negative slopes at the upper end of the lifetime uncertainty
range, which is equivalent to an infinite stratospheric life-time. The only reliable estimate for this compound is there-fore the lower end of the lifetime range, which is the mini-mum stratospheric lifetime. In addition, it is notable that our results only just agree with the lifetimes in WMO (2011) for one further compound. According to our best estimate (and relative to a lifetime of 45 years for CFC-11), CCl4 should be considerably longer-lived than the value given in WMO (2011).
For 12 we note a discrepancy regarding our CFC-12/CFC-11 lifetime ratio (1.66), which is already smaller than that of Volk et al. (1997) (1.92) but differs even more from the one resulting from WMO reports (2.22). It has also been noted in WMO (2011) that “evidence is emerging that lifetimes for some important ODSs (e.g. CFC-11) may be somewhat longer than reported in past assessments”. In the case of CFC-11, this is supported by the study of Douglass et al. (2008), which suggested a range of 56 to 64 years for its steady-state lifetime from a number of global mod-els with improved model transport schemes. With respect to CFC-12 Douglass et al. (2008) concluded that the new model results agree better with previous lifetime estimates as compared to CFC-11. For these reasons we derive a sec-ond set of lifetimes by assuming a CFC-12 lifetime of 100 years as recommended in WMO (2011) but also because it agrees with the range in Douglass et al. (2008). This here translates into a CFC-11 lifetime of 60.1 years (see Table 2), which falls in the range suggested by Douglass et al. (2008). The resulting stratospheric lifetimes are in this case calcu-lated to be larger than those recommended by WMO (2011) in 5 out of 8 cases. For CFC-11, HCFC-141b, H-1301 and CCl4, even the lower ends of our uncertainty ranges are larger than the WMO lifetimes. These results should be assessed by global models, but it is clear that the sum of such increases would cause a significant delay in projections of the recovery of stratospheric ozone. For CH3CCl3 our stratospheric life-time range (21 to 43 years) then agrees with the 39 years given in WMO (2011). Using a CFC-11 lifetime of 60.1 years and again directly replacing the stratospheric lifetime in WMO (2011) with our estimate, the resulting change in its overall lifetime would be smaller and equate to a reduction of≈0.19 years or about 4 %.
Table 2.Comparison of stratospheric lifetimes from WMO (2011), Volk et al. (1997) and this work. The latter two were scaled relative to a CFC-11 lifetime of 45 years. The CFC-11 lifetime of 60.1 years in our work results from assuming a CFC-12 lifetime of 100 years. The uncertainty ranges were derived via Eq. (6) by considering the slope uncertainty in the CFC-11–mean-age correlation as given in the text, slope uncertainties in tracer-CFC-11 correlations (see the Supplement), and values of 0.7 to 1.75 for3. To ensure comparability with the work of Volk et al. (1997), we adopt a3value of 1.25 for our lifetime calculations.
Compound
Stratospheric lifetimes
WMO (2011) Volk et al. (1997) This work CFC-11 = 45
years
CFC-11 = 60.1 years
Ratio to CFC-11 % change from trend correction
CFC-11 45 (45) (45) 60
(54–67)
1 0.7
CFC-113 85 101±28 62
(55–69)
82 (74–93)
1.37 –4.3
CFC-12 100 86±11 75
(67–84)
(100) 1.66 –0.7
HCFC-141b 64.9 – 91
(52–340)
122 (70–454)
2.02 40
HCFC-142b 160 – 304
(104-∞)
406 (139-∞)
6.75 80
HCFC-22 186 – 138
(84–484)
184 (113–647)
3.06 58
H-1301 65 – 62
(56–69)
82 (75–93)
1.37 15
H-1211 – 23±5 27
(24–31)
36 (32–41)
0.61 0.5
CCl4 35 32±4 39
(34–47)
53 (45–62)
0.87 –4.4
CH3CCl3 39 34±5 22
(15–32)
30 (21–43)
0.50 –155
5.3 Ozone depletion potentials
FRFs and stratospheric lifetimes as calculated in the previ-ous sections provide the ingredients for a reassessment of a key quantity: the semi-empirical ozone depletion potential. These can be derived via Eq. (8), which has been adapted from Daniel and Velders (2007).
ODPi= α·nBr,i+nCl,i· FRFi FRFCFC−11
· τi
τCFC−11
·MCFC−11
Mi
·1
3
, (8)
where α is relative ozone destruction effectiveness of bromine as compared to chlorine (here 60 as recommended in WMO (2011) for mid-latitudes), n is the number of bromine/chlorine atoms, τ is the overall atmospheric life-time, andMis molecular mass.
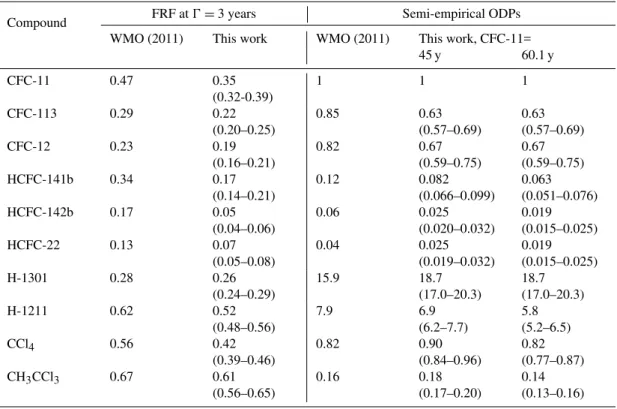
In the case of CFC-11, CFC-12, CFC-113 and H-1301, where no significant tropospheric sinks exist, we use our newly calculated stratospheric lifetimes as equiv-alent to the overall atmospheric lifetimes. For the remain-ing six molecules, we use our calculated stratospheric life-times along with the non-stratospheric losses reported in WMO (2011) to recalculate overall lifetimes. For H-1211 only the overall lifetime is given in WMO (2011), so we use the tropospheric lifetime of 23 years from Burkholder et al. (1991) combined with our calculated stratospheric life-time. For comparability to WMO (2011), we calculate new ODPs from our mid-latitudinal FRFs only. The FRFs at a mean age of 3 years and the resulting ODPs are shown in Table 3, both in comparison to values from WMO (2011).
Using the two different lifetimes for CFC-11 (i.e. 45 and 60 years) has a smaller influence on ODPs as compared to FRFs, as the respective lifetime changes of all other pounds are in the same direction, and are thus partly com-pensated for in Eq. (8). Longer lifetimes have no influence at all in the case of stratospheric lifetimes being equivalent to the overall atmospheric lifetime (i.e. for CFC-12, CFC-113, and H-1301) as the lifetime ratio then remains unchanged. In the case of significant extra-stratospheric sinks, the ODPs are generally found to decrease with increasing stratospheric lifetime. This is caused by the fact that a downscaled change in overall lifetime is then related to a bigger change in CFC-11 lifetime in Eq. (8). In the case of the HCFCs, the ac-tual stratospheric lifetimes are accompanied by a large un-certainty range. However, this has very little influence on the ODP as the overall lifetimes of these compounds are domi-nated by their lifetime with respect to OH.
Table 3.Overview of FRFs derived from mid-latitude polynomial fit functions (see Supplement) at a mean age of 3 years. Uncertainties are calculated by fitting polynomials through the upper and lower envelopes exhibited by the FRF and mean-age error bars displayed in Figs. 3 to 5. Also shown are semi-empirical ozone depletion potentials calculated using these FRFs and the stratospheric lifetimes from Table 2 in comparison to recent estimates from WMO (2011). The ODP ranges additionally consider the stratospheric lifetime ranges from Table 2.
Compound FRF atŴ=3 years Semi-empirical ODPs
WMO (2011) This work WMO (2011) This work, CFC-11=
45 y 60.1 y
CFC-11 0.47 0.35
(0.32-0.39)
1 1 1
CFC-113 0.29 0.22
(0.20–0.25)
0.85 0.63
(0.57–0.69)
0.63 (0.57–0.69)
CFC-12 0.23 0.19
(0.16–0.21)
0.82 0.67
(0.59–0.75)
0.67 (0.59–0.75)
HCFC-141b 0.34 0.17
(0.14–0.21)
0.12 0.082
(0.066–0.099)
0.063 (0.051–0.076)
HCFC-142b 0.17 0.05
(0.04–0.06)
0.06 0.025
(0.020–0.032)
0.019 (0.015–0.025)
HCFC-22 0.13 0.07
(0.05–0.08)
0.04 0.025
(0.019–0.032)
0.019 (0.015–0.025)
H-1301 0.28 0.26
(0.24–0.29)
15.9 18.7
(17.0–20.3)
18.7 (17.0–20.3)
H-1211 0.62 0.52
(0.48–0.56)
7.9 6.9
(6.2–7.7)
5.8 (5.2–6.5)
CCl4 0.56 0.42
(0.39–0.46)
0.82 0.90
(0.84–0.96)
0.82 (0.77–0.87)
CH3CCl3 0.67 0.61
(0.56–0.65)
0.16 0.18
(0.17–0.20)
0.14 (0.13–0.16)
ODP is mostly induced by the lower FRF of CFC-11 as our H-1301 FRF does not differ much from that in WMO (2011). It should also be noted that differences to WMO values are intensified through the exclusive use of mid-latitude data in our study. As already stated in Sect. 4.1, we find less frac-tional release in mid-latitudes as compared to high latitudes. Although a mean age of 3 years is supposed to represent mid-latitudes, the values in WMO (2011) are mostly based on correlations from Newman et al. (2006, 2007) which orig-inate from both mid- and high-latitude data (52 to 88 ◦N, Schauffler et al., 2003). Our results suggest that it may be rec-ommendable to distinguish between these two stratospheric regions.
6 Conclusions
We have reassessed three policy-relevant parameters for 10 important ozone-depleting substances: fractional release, steady-state lifetimes, and semi-empirical ODPs. For the de-rived correlations of FRFs with mean age, we find differ-ences to the work of Newman et al. (2006) which could be related to differences in mean age. Especially in the case of HCFC-141b and HCFC-142b, the differences might ad-ditionally be related to temporal changes in relative tropo-spheric growth rates. Experimentally derived correlations of
FRFs with mean age of air should thus only be considered as time-independent as long as there are no major changes in stratospheric transport or relative tropospheric growth rates. When using such correlations the uncertainties connected to the mean age of air and its calculation could be very sub-stantial. We can, for instance, not assess seasonal or hemi-spheric variability with the available data set. However, we do find differences between mid- and high-latitude fractional release, and this should be taken into account when assessing ozone recovery scenarios for different latitudinal regions. It is also recommended to further investigate the variability of the FRF–mean-age correlations as they have the potential to significantly alter the projected time of stratospheric ozone recovery.
stratospheric lifetime difference to 23 % but also gives 34 % larger lifetimes for all compounds. This would result in WMO stratospheric lifetime recommendations being below our estimated ranges for CFC-11, HCFC-141b, H-1301 and CCl4. However, we are unable to resolve the discrepancy between WMO (2011) and Douglass et al. (2008) here. In the absence of an updated and independent estimate of the lifetime of CFC-11, we recommend the internally consistent stratospheric lifetime ratios given in Table 2. It is notable though that our CFC-12/CFC-11 lifetime ratio is closer to that inferred by Volk et al. (1997) and Douglass et al. (2008), whereas the ratio given in WMO (2011) is considerably higher.
The ozone depletion potentials derived from the FRFs and lifetimes above are in most cases smaller than those recommended by WMO (2011). We also note that accord-ing to our results HCFCs are considerably less harmful to stratospheric ozone than assumed in past WMO assessments, with reductions in their ODPs of up to 70 %. A corollary of these smaller ODPs, however, is that stratospheric ozone re-covery might be more delayed than previously determined, as a result of the reduced FRFs and possibly longer at-mospheric lifetimes of these ODSs. Finally, semi-empirical ODPs should not be considered as time-independent if they are based on observationally derived fractional release fac-tors, for the above mentioned reasons.
Supplementary material related to this article is
available online at: http://www.atmos-chem-phys.net/13/ 2779/2013/acp-13-2779-2013-supplement.zip.
Acknowledgements. This publication became possible because of the work of the Geophysica team, the CNES balloon team, the teams of the NOAA-ESRL Global Monitoring Division, the staff at the Cape Grim station and at CSIRO GASLAB Aspendale, as well as funding from the UK Natural Environment Research Council (Research fellowships NE/F015585/1 and NE/I021918/1), the ESA (PremierEx project), the Forschungszentrum J¨ulich, the European Commission (FP7 project RECONCILE-226365-FP7-ENV-2008-1), the Dutch Science foundation (NWO, grant number 865.07.001) as well as CSIRO and the Bureau of Meteorology. In addition, we thank Michel Bolder, Thijs F. Duindam (both Utrecht University, Netherlands), Paul Fraser (Centre for Australian Weather and Climate Research, Australia), Elisabeth H¨osen (University of Wup-pertal, Germany), Dave Oram (National Centre for Atmospheric Science, United Kingdom) and the anonymous reviewers for their contributions.
Edited by: R. M¨uller
References
B¨onisch, H., Engel, A., Curtius, J., Birner, T., and Hoor, P.: Quanti-fying transport into the lowermost stratosphere using simultane-ous in-situ measurements of SF6and CO2, Atmos. Chem. Phys.,
9, 5905–5919, doi:10.5194/acp-9-5905-2009, 2009.
Burkholder, J. B., Wilson, R. R., Gierczak, T., Talukdar, R., McK-een, S. A., Orlando, J. J., Vaghjiani, G. L., and Ravishankara, A. R.: Atmospheric fate of CF3Br CF2Br2, CF2ClBr, and CF2BrCF2Br, J. Geophys. Res., 96, 5025–5043, 1991.
Cairo, F., Pommereau, J. P., Law, K. S., Schlager, H., Garnier, A., Fierli, F., Ern, M., Streibel, M., Arabas, S., Borrmann, S., Berthelier, J. J., Blom, C., Christensen, T., D’Amato, F., Di Don-francesco, G., Deshler, T., Diedhiou, A., Durry, G., Engelsen, O., Goutail, F., Harris, N. R. P., Kerstel, E. R. T., Khaykin, S., Konopka, P., Kylling, A., Larsen, N., Lebel, T., Liu, X., MacKen-zie, A. R., Nielsen, J., Oulanowski, A., Parker, D. J., Pelon, J., Polcher, J., Pyle, J. A., Ravegnani, F., Riviere, E. D., Robin-son, A. D., Rockmann, T., Schiller, C., Simoes, F., Stefanutti, L., Stroh, F., Some, L., Siegmund, P., Sitnikov, N., Vernier, J. P., Volk, C. M., Voigt, C., von Hobe, M., Viciani, S., and Yushkov, V.: An introduction to the SCOUT-AMMA stratospheric aircraft, balloons and sondes campaign in West Africa, August 2006: rationale and roadmap, rationale and roadmap, Atmos. Chem. Phys., 10, 2237–2256, doi:10.5194/acp-10-2237-2010, 2010. Cantrell, C. A.: Technical Note: Review of methods for linear
least-squares fitting of data and application to atmospheric chemistry problems, Atmos. Chem. Phys., 8, 5477–5487, doi:10.5194/acp-8-5477-2008, 2008.
Daniel, J. S., Solomon, S. and Albritton, D. L.: On the evaluation of halocarbon radiative forcing and global warming potentials, J. Geophys. Res., 100, 1271–1285, 1995.
Daniel, J. S., Velders, G. J. M., Douglass, A. R., Forster, P. M. D., Hauglustaine, D. A., Isaksen, I. S. A., Kuijpers, L. J. M., Mc-Culloch, A., and Wallington, T. J.: Halocarbon scenarios, ozone depletion potentials, and global warming potentials, Chapter 8 in World Meteorological Organization: Scientific assessment of ozone depletion: 2006, Global Ozone Research and Monitoring Project – Report No. 50, Geneva, 2007.
Douglass, A. R., Stolarski, R. S., Schoeberl, M. R., Jackman, C. H., Gupta, M. L., Newman, P. A., Nielsen, J. E., and Flem-ing, E. L.: Relationship of loss, mean age of air and the distribution of CFCs to stratospheric circulation and implica-tions for atmospheric lifetimes, J. Geophys. Res., 113, D14309, doi:10.1029/2007JD009575, 2008.
Engel, A., Strunk, M., M¨uller, M., Haase, H.-P., Poss, C., Levin, I., and Schmidt, U.: Temporal development of total chlorine in the high-latitude stratosphere based on reference distributions of mean age derived from CO2and SF6, J. Geophys. Res., 107,
4136, doi:10.1029/2001JD000584, 2002.
Engel, A., M¨obius, T., Haase, H.-P., B¨onisch, H., Wetter, T., Schmidt, U., Levin, I., Reddmann, T., Oelhaf, H., Wetzel, G., Grunow, K., Huret, N., and Pirre, M.: Observation of meso-spheric air inside the arctic stratomeso-spheric polar vortex in early 2003, Atmos. Chem. Phys., 6, 267–282, doi:10.5194/acp-6-267-2006, 2006.
the past 30 years, Nat. Geosci., 2, 28–31, doi:10.1038/Ngeo388, 2009.
Hall, B.D., Dutton, G. S., Mondeel, D. J. Nance, J. D., Rigby, M., Butler, J. H., Moore, F. L., Hurst, D. F., and Elkins, J. W.: Improving measurements of SF6 for the study of atmospheric
transport and emissions, Atmos. Meas. Tech., 4, 2441–2451, doi:10.5194/amt-4-2441-2011, 2011.
Harnisch, J., Borchers, R., Fabian, P., and Maiss, M.: Tropospheric trends for CF4 and C2F6 since 1982 derived from SF6 dated stratospheric air, Geophys. Res. Lett., 23, 1099–1102, 1996. Kaiser, J., Engel, A., Borchers, R., and R¨ockmann, T.: Probing
stratospheric transport and chemistry with new balloon and air-craft observations of the meridional and vertical N2O isotope
dis-tribution, Atmos. Chem. Phys., 6, 3535–3556, doi:10.5194/acp-6-3535-2006, 2006.
Krol, M. C., Lelieveld, J. , Oram, D.E., Sturrock, G.A., Penkett, Brenninkmeijer, C. A.M., Gros, V., Williams, J., and Scheeren, H. A.: Continuing emissions of methyl chloroform from Europe, Nature, 421, 131–135, 2003.
Laube, J. C., Engel, A., B¨onisch, H., M¨obius, T., Worton, D. R., Sturges, W. T., Grunow, K., and Schmidt, U.: Contribution of very short-lived organic substances to stratospheric chlorine and bromine in the tropics – a case study, Atmos. Chem. Phys., 8, 7325–7334, doi:10.5194/acp-8-7325-2008, 2008.
Laube, J. C., Engel, A., B¨onisch, H., M¨obius, T., Sturges, W. T., Braß, M., and R¨ockmann, T.: Fractional release factors of long-lived halogenated organic compounds in the tropical strato-sphere, Atmos. Chem. Phys., 10, 1093–1103, doi:10.5194/acp-10-1093-2010, 2010a.
Laube, J. C., Martinerie, P., Witrant, E., Blunier, T., Schwan-der, J., Brenninkmeijer, C. A. M., Schuck, T. J., BolSchwan-der, M., R¨ockmann, T., van der Veen, C., B¨onisch, H., Engel, A., Mills, G. P., Newland, M. J., Oram, D. E., Reeves, C. E., and Sturges, W. T.: Accelerating growth of HFC-227ea (1,1,1,2,3,3,3-heptafluoropropane) in the atmosphere, Atmos. Chem. Phys., 10, 5903–5910, doi:10.5194/acp-10-5903-2010, 2010b.
Levin, I. and Hesshaimer, V.: Refining of atmospheric transport model entries by the globally observed passive tracer distribu-tions of85Krypton and sulphur hexafluoride (SF6), J. Geophys.
Res., 101, 16745–16755, 1996.
Montzka, S. A., Butler, J. H., Elkins, J. W., Thompson, T. M., Clarke, A. D., and Lock, L. T.: Present and future trends in the atmospheric burden of ozone-depleting halogens, Nature, 398, 690–694, doi:10.1038/19499, 1999.
Montzka, S. A., Krol, M., Dlugokencky, E., Hall, B., Jockel, P., and Lelieveld, J.: Small interannual variability of global atmospheric hydroxyl, Science, 331, 67–69, 2011.
Newland, M. J., Reeves, C. E., Oram, D. E., Laube, J. C., Sturges, W. T., Hogan, C., Begley, P., and Fraser, P. J.: South-ern hemispheric halon trends and global halon emissions, 1978–2011, Atmos. Chem. Phys. Discuss., 12, 29289–29324, doi:10.5194/acpd-12-29289-2012, 2012.
Newman, P. A., Nash, E. R., Kawa, S. R., Montzka, S. A., and Schauffler, S. M.: When will the Antarctic ozone hole recover?, Geophys. Res. Lett., 33, L12814, doi:10.1029/2005GL025232, 2006.
Newman, P. A., Daniel, J. S., Waugh, D. W., and Nash, E. R.: A new formulation of equivalent effective stratospheric chlorine (EESC), Atmos. Chem. Phys., 7, 4537–4552, doi:10.5194/acp-7-4537-2007, 2007.
Plumb, R. A.: A “tropical pipe” model of stratospheric transport, J. Geophys. Res., 101, 3957–3972, 1996.
Plumb, R. A.: Tracer interrelationships in the stratosphere, Rev. Geophys., 45, RG4005, doi:10.1029/2005rg000179, 2007. Plumb, R. A. and Ko, M. K. W.: Interrelationships between mixing
ratios of long-lived stratospheric constituents, J. Geophys. Res., 97, 10145–10156, 1992.
Prinn, R. G., Huang, J., Weiss, R. F., Cunnold, D. M., Fraser, P. J., Simmonds, P. G., McCulloch, A., Harth, C., Reimann, S., Salameh, P., O’Doherty, S., Wang, R. H. J., Porter, L. W., Miller, B. R., and Krummel, P. B.: Evidence for variability of atmo-spheric hydroxyl radicals over the past quarter century, Geophys. Res. Lett., 32, L07809, doi:10.1029/2004GL022228, 2005. Schauffler, S. M., Atlas, E. L., Blake, D. R., Flocke, F., Lueb, R. A.,
Lee-Taylor, J. M., Stroud, V., and Travnicek, W.: Distributions of brominated organic compounds in the troposphere and lower stratosphere, J. Geophys. Res., 104, 21513–21535, 1999. Schauffler, S. M., Atlas, E. L., Donnelly, S. G., Andrews, A.,
Montzka, S. A., Elkins, J. W., Hurst, D. F., Romashkin, P. A., Dutton, G. S., and Stroud, V.: Chlorine budget and partitioning during SOLVE, J. Geophys. Res., 108, 4173, doi:10.1029/2001JD002040, 2003.
Solomon, S., Tuck, A. F., Mills, M., Heidt, L. E., and Pollock, W. H.: On the evaluation of ozone depletion potentials, J. Geophys. Res., 97, 825–842, 1992.
Solomon, S. and Albritton, D. L.: Time-dependent ozone depletion potentials for short- and long-term forecasts, Nature 357, 33–37, doi:10.1038/357033a0, 1992.
Stiller, G. P., von Clarmann, T., Haenel, F., Funke, B., Glatthor, N., Grabowski, U., Kellmann, S., Kiefer, M., Linden, A., Lossow, S., and L´opez-Puertas, M.: Observed temporal evolution of global mean age of stratospheric air for the 2002 to 2010 period, Atmos. Chem. Phys., 12, 3311–3331, 2012, doi:10.5194/acp-12-3311-2012, 2012.
Strunk, M., Engel, A. Schmidt, U. Wetter, T. Levin, I., and Glatzel-Mattheier, H.: CO2and SF6as stratospheric age tracers:
Con-sistency and the effect of mesospheric SF6-loss, Geophys. Res. Lett., 27, 341–344, 2000.
Volk, C. M., Elkins, J. W., Fahey, D. W., Sutton, G. S., Gilligan, J. M., Loewenstein, M., Podolske, J. R., Chan, K. R., and Gun-son, M. R.: Evaluation of source gas lifetimes from stratospheric observations, J. Geophys. Res., 102, 25543–25564, 1997. Werner, A., Volk, C. M., Ivanova, E. V., Wetter, T., Schiller, C.,
Schlager, H. and Konopka, P.: Quantifying transport into the Arctic lowermost stratosphere, Atmos. Chem. Phys., 10, 11623– 11639, doi:10.5194/acp-10-11623-2010, 2010.
WMO: Scientific Assessment of Stratospheric Ozone: 1989, Global Ozone Research and Monitoring Project – Report No. 20, World Meteorological Organization, Geneva, Switzerland, 1990. WMO: Scientific Assessment of Ozone Depletion: 2010, Global