www.ann-geophys.net/25/1499/2007/ © European Geosciences Union 2007
Annales
Geophysicae
Adaptation of an empirical model for erythemal ultraviolet
irradiance
I. Foyo-Moreno1, I. Alados2, and L. Alados-Arboledas1
1Dpto de F´ısica Aplicada, Universidad de Granada, Granada, Spain 2Dpto de F´ısica Aplicada II, Universidad de M´alaga, M´alaga, Spain
Received: 20 March 2006 – Revised: 18 June 2007 – Accepted: 27 June 2007 – Published: 30 July 2007
Abstract. In this work we adapt an empirical model to esti-mate ultraviolet erythemal irradiance (UVER) using experi-mental measurements carried out at seven stations in Spain during four years (2000–2003). The measurements were taken in the framework of the Spanish UVB radiometric net-work operated and maintained by the Spanish Meteorolog-ical Institute. The UVER observations are recorded as half hour average values. The model is valid for all-sky condi-tions, estimating UVER from the ozone columnar content and parameters usually registered in radiometric networks, such as global broadband hemispherical transmittance and optical air mass. One data set was used to develop the model and another independent set was used to validate it. The model provides satisfactory results, with low mean bias er-ror (MBE) for all stations. In fact, MBEs are less than 4% and root mean square errors (RMSE) are below 18% (except for one location). The model has also been evaluated to esti-mate the UV index. The percentage of cases with differences of 0 UVI units is in the range of 61.1% to 72.0%, while the percentage of cases with differences of±1 UVI unit covers
the range of 95.6% to 99.2%. This result confirms the ap-plicability of the model to estimate UVER irradiance and the UV index at those locations in the Iberian Peninsula where there are no UV radiation measurements.
Keywords. Atmospheric composition and structure (Aerosols and particles; Transmission and scattering of radi-ation) – Meteorology and atmospheric dynamics (Radiative processes)
1 Introduction
Solar radiation sustains and affects all life forms on the Earth. Solar irradiance in the UV range (280–400 nm) is known to produce significant environmental effects (UNEP, 1998, Correspondence to:I. Foyo-Moreno
2003). Small amounts of solar ultraviolet radiation are bene-ficial for people and essential in the production of vitamin D3 for building and maintaining bones (Bryant, 1997), but the major effects of the shorter wavelength region reaching the Earth are harmful to many organisms, causing DNA damage (Diffey, 1992). Excessive UV exposure may lead to dam-age of the skin, eyes and immune systems of humans and animals, and can also harm terrestrial plants and aquatic sys-tems.
The discovery of the Antarctic ozone hole and the decline of the ozone layer in mid-latitudes has increased concern about levels of UV radiation (WMO, 1998), and this presents a serious environmental issue (Lebert et al., 2002; Ma and Guicherit, 1997). In Brazil, covering tropical and subtropical regions, the damage caused by sunlight exposure is respon-sible for the highest-incident cancer type in the country: skin cancer (Brazilian Society of Dermatology, 2003). Incidence and mortality rates due to skin cancer in Australia are among the highest in the world, with two out of three Australians developing some form of skin cancer in their lifetime (Tur-bull and Parisi, 2003). Since 1973 the annual growth rate for cases of malignant melanoma has been quantified at 4% (ACS, 1995), while the United Nations Environment Pro-gram (UNEP) has estimated that every year there are more than 2 million melanoma skin cancer cases and some 200 000 cases of malignant melanomas.
Recently, the interest of the scientific community has been focused on the study of UV-B radiation, principally due to its harmful effects on biological systems (Diffey, 1991; Van der Leun et al., 1991, 1994, 1998; Zerefos at al., 2001). For hu-man beings, the effect that has received most attention is the erythema, or sunburn. An index that is recognized interna-tionally as a standard for determining the risk associated with UV-B radiation is the erythemal irradiance (UVER). This is calculated by weighting the spectral curve of the incident solar radiation at the surface with the spectral action curve proposed by the “Commission Internationale de l’Eclairage” (McKinlay and Diffey, 1987). The action spectrum (Diffey, 1982) has an absolute maximum at 297 nm.
When solar extraterrestrial UV radiation enters the at-mosphere, it interacts with atmospheric constituents (air molecules, aerosol particles, droplets and ice particles). The variability of different constituents, especially the high tem-poral and spatial variability of cloud cover and aerosols, as well as the position of the Sun in the sky, determine the vari-ability of radiation received on the ground. Given the ma-jor role played by the UV solar radiation received at the Earth’s surface and the importance of its characterisation, recent years have seen a substantial increase in attempts to model UV solar radiation. However, only recently have the network stations measuring this radiometric flux begun to in-crease and so much remains to be learned.
To model the influence of clouds and aerosols on UV solar radiation is difficult, since there is a general lack of observa-tions for aerosols and the effects of the clouds are complex to quantify. Different methodologies have been used to anal-yse the effects of clouds on this radiometric flux, including radiative transfer models and empirical approaches. The first method implies the application of Mie theory and requires in-put information, such as cloud optical thickness and droplet size distributions with high temporal and spatial resolution, information that is limited to specific sites and campaigns. The second method attempts to estimate the UV radiation from parameters usually measured at most radiometric sta-tions. Calb´o et al. (2005) have carried out a detailed revi-sion of empirical studies of cloud effects on UV radiation. These empirical models are based on visual observations of cloud amount alone or in combination with other cloud fea-tures (Ilyas, 1987; Frederick et al., 1990, 1993; Blumthaler et al., 1994, 1996; Thiel et al., 1997; Kuchinke and Nunez, 1999; Lubin and Frederick, 1991; Bais et al., 1993; Nemeth et al., 1996), on information obtained with sky cameras and satellite cloud retrieval techniques (Borkowski et al., 1977; Shafer et al., 1996; Sabburg and Wong, 2000; Josefsson and Landelius, 2000), on information retrieved by radiative surements, or on combined information from radiative mea-surements and observations of clouds (Frederick and Steele, 1995; Bordewijk et al., 1995; Bodeker and McKenzie, 1996; Foyo-Moreno et al., 1998; Estupi˜n´an et al., 1996; Grant and Heisler, 2000; den Outer et al., 2005).
Previous works (Alados-Arboledas et al., 2003; Alados et al., 2004) have characterised the cloud effects on UVER us-ing information routinely registered in most meteorological stations: cloud type and amount, expressed in terms of frac-tional cloud coverage in octas (eighths). On the other hand, Foyo-Moreno et al. (1999) developed an empirical model to estimate the ultraviolet solar radiation in the range of 295– 385 nm for all-sky conditions. This model, revised recently by Calb´o et al. (2005), uses as input a set of parameters usu-ally available in radiometric networks, such as the broadband global solar irradiance and the optical air mass. In particular, the model uses the hemispherical transmittance (kt), defined as the ratio of global horizontal irradiance to extraterrestrial horizontal irradiance, a parameter that depends on the cloud cover and aerosol load. In this work, we have adapted the model to estimate UVER for several stations of the Iberian Peninsula with rather different environments. To do this we have included as an additional input parameter the ozone columnar content. Data from Madrid have been used to de-velop the model that has been validated with the independent data sets recorded at the remaining sites.
2 Data and measurements
The UVER observations, performed within the Spanish UV-B radiometric network, were recorded as half-hour average values, although these instruments in their standard operation mode, take measurements of ultraviolet erythemal radiation every second. From these values the integrated irradiation is found for the desired time interval, hourly average values in our case.
Martinez-Lozano et al. (2002) reported a detailed descrip-tion of this network. Yankee UVB-1 radiometers are oper-ated and maintained by the Spanish Meteorological Institute (INM). Only clear sky data are used in the determination of the erythemal calibration factors. These factors are mod-elled as a function of zenith angle and total ozone, follow-ing the so-called indirect method. The calibration method-ology of these instruments has been described by Lantz et al. (1999). The Yankee UVB-1 radiometer is a broadband (280–315 nm) Robertson–Berger type radiometer. The spec-tral response of the instrument is designed to approximate the spectral response of the human skin to UV (McKinlay and Diffey, 1987). The experimental uncertainty of this in-strument is about 8–9% (Leszczynski et al., 1998; Pearson et al., 2000).
Solar global irradiance has been registered on an hourly basis using a Kipp & Zonen model CM-11, while another Kipp & Zonen model C-11 with a polar axis shadowband was used to measure solar diffuse irradiance. Measurements of solar global and diffuse irradiance have an estimated ex-perimental error of about 2–3%.
67 m a.s.l.), M´alaga (36◦43′N, 4◦29′W, 61 m a.s.l.), San-tander (43◦29′N, 3◦48′W, 63 m a.s.l.), Zaragoza (41◦38′N, 0◦55′W, 250 m a.s.l.), during the period 2000–2003, Valen-cia (39◦29′N, 0◦22′W, 11 m a.s.l.) during the years 2000, 2001 and 2003 and Murcia (38◦00′N, 1◦10′W, 69 m a.s.l.) during the year 2000. Madrid and Zaragoza are inland loca-tions more than 200 km from the coast; Murcia is an inland location about 50 km from the Mediterranean Sea; whereas Valencia and M´alaga are coastal locations situated in the western Mediterranean. A Coru˜na and Santander are located on the Atlantic coast of the Iberian Peninsula.
In the stations selected for this study, simultaneous obser-vations of ozone columnar content were performed using the Brewer instrument operated within the same network at the selected locations. Columnar ozone content is not measured at all the stations. After analysing the available measure-ments and considering the marked latitudinal pattern of this variable, different criteria have been used for the assignation of ozone columnar content at stations where measurements were not available. Thus, for M´alaga we have used the mea-surements performed at El Arenosillo, the closest station that also presents a similar latitude. A similar procedure has been followed at Santander that uses the data set registered at A Coru˜na. Finally, for Valencia we used the average between Madrid and Murcia.
The Madrid data were used to develop the model, and data from the other stations were used in the evaluation of the model. To avoid problems associated with deviations by the instrument from the ideal cosine law, we limited our study to solar elevation angles greater than 10◦; in any case, the UVER values measured for larger zenith angles are relatively small.
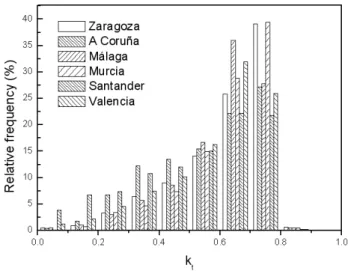
Figure 1 shows a histogram with the relative frequency for the broadband hemispherical transmittance (kt)at all sites
employed in the evaluation of model, in order to characterise atmospheric conditions for the period under study. This pa-rameter is defined as the ratio of the global irradiance to the extraterrestrial irradiance, both on a horizontal surface. We can observe that the cities which present a great number of cases with highkt are Murcia, M´alaga and Zaragoza, with
84%, 81% and 80%, respectively, of cases with kt higher than 0.5. The cities with a higher number of cases with
kt lower than 0.5 are Santander and A Coru˜na, with a per-centage of 41 and 35%, respectively. For the period 1971– 2000, we obtained monthly and yearly climatic data from http://www.inm.es for stations analysed in this study. Table 1 shows some climatic data for stations analysed in this study. Especially relevant are the differences in yearly precipitation, relative humidity and sunshine duration. In terms of clima-tology M´alaga and A Coru˜na and Santander present extremes among our sites, M´alaga representative of the Mediterranean climates, and A Coru˜na and Santander of the maritime cli-mates. M´alaga presents high maximum mean temperature and a mild minimum temperature with sparse cloudiness and precipitation, and Santander and A Coru˜na present mild
tem-Fig. 1.Histograms of the global broadband hemispherical transmit-tance (kt)at each location for the study period.
peratures for the entire year, increased cloudiness and high precipitation. The station with climatic conditions most sim-ilar to Madrid is Zaragoza, with severe winters and warm summers. To some degree, the sites used in this study are representative of the climatic variety of the Iberian Penin-sula.
3 Results
3.1 Estimation model
The optical air mass and cloudiness conditions are the most important factors to be considered in order to estimate the UVER global irradiance. Accordingly, Krzyscin and Sobolewski (2001) affirmed that the main UVER day-to-day variability is induced by clouds and aerosol and not by ozone content. Also, Lubin et al. (1998) showed that the main variability of UV radiation in otherwise homogenous regions comes from cloudiness.
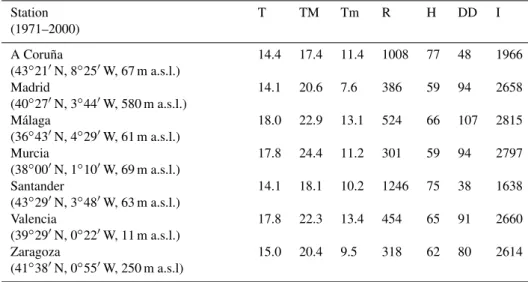
Table 1.Climatic data for the analyzed stations for the period 1971–2000.
Station (1971–2000)
T TM Tm R H DD I
A Coru˜na
(43◦21′N, 8◦25′W, 67 m a.s.l.)
14.4 17.4 11.4 1008 77 48 1966
Madrid
(40◦27′N, 3◦44′W, 580 m a.s.l.)
14.1 20.6 7.6 386 59 94 2658
M´alaga
(36◦43′N, 4◦29′W, 61 m a.s.l.)
18.0 22.9 13.1 524 66 107 2815
Murcia
(38◦00′N, 1◦10′W, 69 m a.s.l.)
17.8 24.4 11.2 301 59 94 2797
Santander
(43◦29′N, 3◦48′W, 63 m a.s.l.)
14.1 18.1 10.2 1246 75 38 1638
Valencia
(39◦29′N, 0◦22′W, 11 m a.s.l.)
17.8 22.3 13.4 454 65 91 2660
Zaragoza
(41◦38′N, 0◦55′W, 250 m a.s.l)
15.0 20.4 9.5 318 62 80 2614
T: Yearly average temperature (◦C)
TM: Yearly average of the maximum temperature (◦C) Tm: Yearly average of the minimum temperature (◦C) R: Yearly average of precipitation (mm)
H: Yearly average of relative humidity (%) DD: Yearly average of cloudless days I: Yearly average of sunshine duration
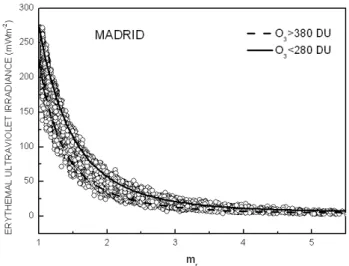
Fig. 2. Erythemal ultraviolet irradiance (UVER) versus optical air mass (mr)at Madrid.
adapted here because the input parameter is not direct infor-mation about cloudiness but rather the broadband global ir-radiance in terms ofkt. After a detailed analysis studying the
relation between ultraviolet global irradiance and broadband global irradiance, Foyo-Moreno et al. (1999) proposed a sim-ple expression to estimate ultraviolet solar radiation (295– 385 nm) from only two input variables: clear-sky ultraviolet
irradiance and thektparameter. A detailed description of the model is given by Foyo-Moreno et al. (1999).
In the next paragraphs we describe the adaptation of the previous UV model (Foyo-Moreno et al., 1999) to UVER. To do this we have included as an additional input parameter the ozone columnar content.
Figure 2 plots UVER global irradiance versus optical air mass at Madrid. This figures indicates that solar elevation alone does not allow for a correct determination of UVER global irradiance, but it can be concluded that the radiation values decrease with increasing air mass, although with high dispersion, and that a parameterization of the enveloping curve is possible. These data are maximum values for UVER global irradiance, logically associated with cloudless sky val-ues. In Foyo-Moreno et al. (1999) we have used this ap-proach by fitting the enveloping curve of UV (295–385 nm) to an exponential model:
UVo(295−385)=A+A′e−.
mr
B′ +A′′e−mrB′′, (1) whereA,A′ A′′, B′ andB′′ are fitting parameters and the subscript zero refers to clear conditions.
Fig. 3. Erythemal ultraviolet irradiance (UVER) versus optical air mass (mr)at Madrid (clear skies).
Fig. 2 that would be biased towards the lower values of ozone columnar content. Figure 3 represents the dependence on op-tical air mass of UVER data corresponding to cloudless con-ditions. An exponential decay model can be used to fit the data:
UVERo=Ao+A1e −mrB
1 +A2e −mrB
2, (2)
whereAo,A1,A2,B1andB2are fitting parameters and the subscript zero refers to clear conditions. Table 2 shows the adjusted values for the coefficients in Eq. (2). The spread of the data shown in Fig. 3 suggests the inclusion of an addi-tional parameterization on ozone columnar content. For this purpose we have divided the cloudless data set considering different intervals of ozone columnar content. Each subset has been fitted to the exponential function (Eq. 2). Consider-ing the functional form of Eq. (2), some coefficients present small variability with the ozone columnar content. In this sense the coefficientAo, associated with the asymptotic value
of UVER for increasing optical air mass, and the decaying constantB1andB2, have been fixed to the values obtained for the whole data set. Finally, only the amplitude coeffi-cientA1, associated with the fastest exponential decay, has been parameterized in terms of ozone columnar content, be-cause it presents the largest dependence on this variable. Ta-ble 3 includes the amplitude coefficientA1values associated with the different ozone columnar content intervals consid-ered. As is evident from Table 3 the coefficientA1decreases as the ozone columnar content increases. In this sense, the coefficientA1 explains the increased attenuation of UVER when ozone columnar content increases.
In Fig. 3, we have included the model curves for two dif-ferent values of ozone columnar content; this can be consid-ered representative of the extreme cases of ozone columnar content in the study region. Thus, the variability of the de-pendence of UVERoon optical air mass can be explained in
Table 2.Fitting values for coefficients in Eq. (2).
Ao A1 A2 B1 B2
mW m−2 mW m−2 mW m−2
12.0±0.1 1490±10 124±1 0.5±0.1 0.8±0.1
Table 3. CoefficientA1for different intervals of ozone columnar
content.
Ozone (DU)
A1
mW m−2
r2
(260, 270) 1724 0.95 (270, 280) 1640 0.96 (280, 290) 1530 0.97 (290, 300) 1500 0.97 (300, 310) 1497 0.96 (310, 320) 1430 0.96 (320, 330) 1410 0.96 (330, 340) 1347 0.96 (340, 350) 1304 0.96 (350, 360) 1300 0.96 (360, 370) 1209 0.96 (370, 380) 1196 0.95
>380 1070 0.95
terms of the dependence of UVER on ozone columnar con-tent.
Once the UVER global irradiance for clear skies is de-termined, the real value will depend on a given atmospheric situation. This situation can be characterized with the global broadband hemispherical transmittance (kt), a parameter that can be considered as a modulator of the maximum value. It is interesting to note that this parameter represents a hemi-spherical transmisivity that depends both on cloud cover and aerosol load. In a previous work (Foyo-Moreno et al., 1999) we have approached the use of a linear dependence of UV (295–285 nm) on the product of UVo andkt. In this work,
after some considerations we settled on another expression that slightly improves the results mainly for high values of the product ofkt and UVERo. This expression is a power
relation:
UVER=A (ktUVERo)B, (3)
whereA=(1.50±0.01) mW m−2andB=(0.960±0.003) with
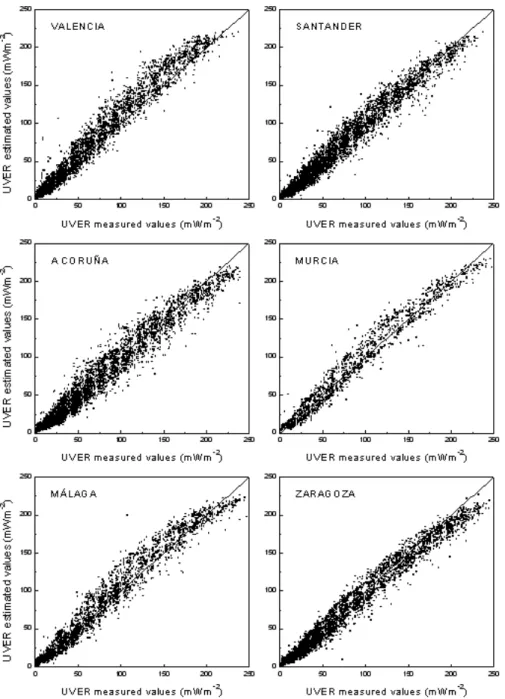
Fig. 4.Scatter plot of estimated versus measured UVER at each location.
3.2 Model validation
The model has been evaluated for the remaining sites which were not used in the calculation of the fitting parameters. Thus, to test portability and to validate the model we have used an independent database.
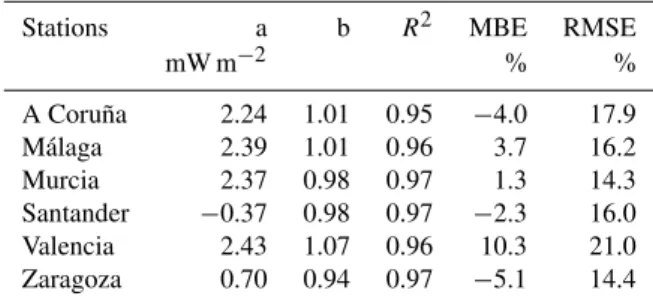
Table 4 shows the results obtained for every station in-cluding the determination coefficientR2(fraction of exper-imental data variance explained by the model), slope b, and intercept a, of the linear regression of UVER global mea-sured versus estimated values. Also Table 4 shows the MBE and RMSE, both as a percentage of the mean experimental
Table 4.Model results at each location.
Stations a b R2 MBE RMSE
mW m−2 % %
A Coru˜na 2.24 1.01 0.95 −4.0 17.9 M´alaga 2.39 1.01 0.96 3.7 16.2 Murcia 2.37 0.98 0.97 1.3 14.3 Santander −0.37 0.98 0.97 −2.3 16.0 Valencia 2.43 1.07 0.96 10.3 21.0 Zaragoza 0.70 0.94 0.97 −5.1 14.4
the MBE values are lower than 4%; only Valencia presents a larger value. The RMSE values do not exceed 18%, ex-cept for Valencia (21.0%). The model underestimates the UVER irradiance at three stations (A Coru˜na, Santander and Zaragoza). In any case, both the slope and correlation co-efficient of the linear regression between measured and esti-mated values reveals the goodness of the estimation model.
A more detailed inspection of Fig. 4 reveals that the devi-ation between measured and estimated values is not uniform across the range of UVER values. Thus, the largest values are usually underestimated at different stations, excluding Valen-cia, where a general overestimation is seen. In the medium range of UVER values the model produces larger variability; this range corresponds to the medium range of solar zenith angles cases with variable cloudiness. At A Coru˜na, San-tander and Zaragoza the scatter around the 1:1 line is almost symmetric in this medium range, while a more or less marked overestimation is evident at Valencia, Murcia and M´alaga. These results suggest the need for additional improvements to the proposed model. In this sense, we have considered the inclusion of a solar-zenith-angle dependence. Neverthe-less, the general underestimation in the largest values’ range is due to the fitting equation selected in developing the cloud-less model.
As mentioned above, den Outer et al. (2005) evaluated four parameterizations to estimate erythemal UV radiation with correlations between the ratios UV/UVoand G/Go, two
of which include dependence on the solar zenith angle. Ac-cording to these authors, their best results correspond to the model that includes the solar zenith angle dependence. Therefore, we have developed a model including a solar-zenith-angle dependence for the coefficients A and B of Eq. (3). To achieve this we binned the Madrid data according to solar zenith angle (Table 5) and computed the coefficients
AandBof Eq. (3).
For the first two categories the coefficients are similar to those obtained for the model without solar-zenith-angle de-pendence. For solar zenith angles greater than 58◦ the fit-ted coefficients differ markedly from those obtained with-out separation into solar-zenith-angles classes. TheR2 val-ues obtained show a worse correlation for those bins with
Table 5. Fitting parameters for Eq. (3) for different intervals of solar zenith angles.
ϑo(◦) A B R2
(18, 28) 1.55 0.96 0.85 (28, 38) 1.50 0.96 0.85 (38, 48) 1.87 0.91 0.82 (48, 58) 2.78 0.81 0.77 (58, 68) 3.29 0.74 0.72 (68, 80) 1.45 0.99 0.53
Table 6. Model results at each location considering solar depen-dence.
Stations a b R2 MBE RMSE
mW m−2 % %
A Coru˜na 1.77 0.96 0.96 −1.7 17.1 M´alaga 2.77 1.02 0.97 5.8 16.7 Murcia 2.68 1.008 0.97 3.1 14.3 Santander 0.98 0.99 0.97 0.1 15.6 Valencia 3.10 1.08 0.97 12.8 22.5 Zaragoza 1.61 0.95 0.98 −3.1 13.4
larger solar zenith angles representing a reduced UVER range (Fig. 2). The use of this solar-zenith-angle-dependent model does not improve upon the simple model. Table 6 presents the global results obtained at the different stations using the model with solar zenith angle dependence. The comparison of Tables 4 and 6 reveals that the use of a solar-angle-dependent model reduces the underestimation encoun-tered at A Coru˜na, Santander and Zaragoza, while for the other sites the overestimation increases. After applying an ANOVA test to the estimates from the models with and with-out solar-zenith-angle dependence we can conclude that, at the 0.01 level, the population variations are not significantly different. Thus, it seems that the use of the model with the solar-zenith-angle dependence does not represent a general-ized improvement.
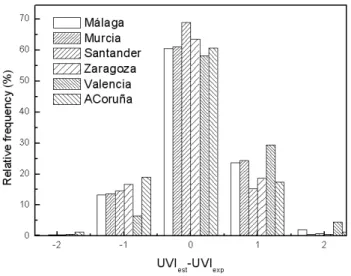
3.3 Estimation of the UV-index
Fig. 5. Histograms of the differences between modeled and esti-mated experimental UVI, at each location.
extreme (11+). This scale has been adopted by the WMO and WHO and is in use in many countries. In Europe there are currently more than a dozen centers that predict the UV index at a national or regional level (Vanicek at al., 2000). In Spain, the National Institute of Meteorology (INM) has a network composed of 16 measurement stations from which the values of the UV index are determined.
Once the model determined the UVER irradiance, we eval-uated the ability of the model to estimate the UV index. Fig-ure 5 shows the relative frequency of the differences between estimated and measured UV index values at each location. We found that the percentage of cases with differences of 0 UVI unit is in the range of 61.1% to 72.0% (Valencia and Santander), while the percentage of the cases with differ-ences of±1 UVI unit covers the range 95.6% (Valencia) to 99.2% (Zaragoza, Murcia and Santander). This means that in the absence of measured values the estimation of the UV index with the model is acceptable.
4 Conclusions
Taking into account that the most important factors influ-encing UV radiation reaching the ground are solar elevation and cloudiness, and since the cloudiness is both difficult to characterize and highly variable in time and space, we have adapted an empirical model (Foyo-Moreno et al., 1999) in order to estimate the UVER irradiance and the UV index for all-sky conditions.
The simple all-weather model needs only three input pa-rameters: the optical air mass, the total ozone to estimate the UVER irradiance for cloudless skies, and kt, the ratio
of global horizontal irradiance to extraterrestrial horizontal irradiance, which depends both on cloud cover and aerosol load. Thus, the model does not use direct information about
cloudiness. The model was developed considering that if short time scales are involved and an accurate description of the radiation for all cloud conditions is required, then the broadband solar radiation is the best input parameter (Calb´o et al., 2005).
The study considered seven stations in the Iberian Penin-sula using data recorded in the framework of the Spanish UVB radiometric network. One station (Madrid) was used in the generation of fitting parameters included in the model and an independent database with the remaining stations was employed in the model validation.
The results indicate that the empirical model provides good results. In fact, mean bias errors are less than 4% and root mean square errors are below 18% for all but one of the sites (Valencia). The model underestimates the UVER irra-diance at three stations (A Coru˜na, Santander and Zaragoza). A solar-zenith-angle-dependent version of the model has been considered. In some stations this model improves the UVER estimation while others present worse results. In any case, the ANOVA test suggests that, at the 0.01 level, the es-timations provided by both models are not significantly dif-ferent.
We also have evaluated the model in order to analyze its ability to estimate the UV index which has been defined to inform the public about levels of UV-B radiation incident at ground level and possible harmful effects. The results show that the percentage of cases with differences of 0 UVI units is in the range of 61.1% to 72.0%, while the percentage of the cases with differences of±1 UVI unit covers the range
of 95.6% to 99.2%. So when measurements are not available we can estimate the UV index using measurements of total ozone and global radiation.
In summary, an empirical model permits estimation of the erythemal UV irradiance and the UV index, at places where the UV-B irradiance is not measured or to extrapolate ex-isting data sets back in time. The model depends on input parameters that are usually available in radiometric networks (solar position and solar broadband irradiance). The ozone data can be easily available from satellites (TOMS data) if ground-based data is not available.
Acknowledgements. This work was supported by CICYT from
the Spanish Ministry of Science and Technology through projects CIRRUS REN2003-03175 and PANDORA-CALIPSO CGL2004-05984-C07-03, REN 2003- 03175 and Andalusian Regional Gov-ernment project P06-RNM-01503. The “Instituto Nacional de Me-teorolog´ıa” kindly provided the radiometric and meteorological in-formation for the stations used in this study. We are in debt with A. S. Kowalski that revise the manuscript and the anonymous refer-ees that provided some suggestions that help us to improve it.
References
ACS: Cancer Facts and Figures, Publication 95-375, American Cancer Society, Atlanta, GA (USA), 1995.
Alados, I., Mellado, J. A., Ramos, F., and Alados-Arboledas, L.: Estimating UV erythemal irradiance by means of neural net-works, J. Photochem. Photobiol., 80(2), 351–358, 2004. Alados-Arboledas, L., Olmo, F. J., Alados, I., and P´erez, M.:
Para-metric models to estimate photosynthetically active radiation in Spain, Agric. Forest. Meteorol., 101, 187–201, 2000.
Alados-Arboledas, L., Alados, I., Foyo-Moreno, I., Olmo, F. J., and Alc´antara, A.: The influence of clouds on surface UV erythemal irradiance, Atmos. Res., 1102, 1–18, 2003.
ASTM: Standard solar constant and air mass zero solar spectral ir-radiances tables, E490-73a, American Society for Testing and Materials, 6 pp, 1973.
Bais, A. F., Zerefos, C. S., Meleti, C., Ziomas, I. C., and Tour-pali, K.: Spectral measurements of solar UV-B radiation and its relations to total ozone, SO2and clouds, J. Geophys. Res., 98,
5199–5204, 1993.
Blumthaler, M., Ambach, W., and Salzgeber, M.: Effects of cloudi-ness on global and diffuse UV irradiance in a high-mountain area, Theor. Appl. Clim., 50, 68–74, 1994.
Blumthaler, M., Ambach, W., Cede, A. A., and Staehelin, J.: Atten-uation of erythemal effective irradiance by cloudiness at low and high altitude in the alpine region, J. Photochem. Photobiol., 63, 193–196, 1996.
Bodeker, G. E. and McKenzie, R. L.: An algorithm for inferring surface UV irradiance including cloud effects, J. Appl. Meteo-rol., 35, 1860–1877, 1996.
Bordewijk, J. A., Slaper, H., Reinen, H. A. J. M., and Schlamann, E.: Total solar radiation and the influence of clouds and aerosols on the biologically effective UV, Geophys. Res. Lett., 22(16), 2151–2154, 1995.
Borkowski, J., Chai, A. T., Mo, T., and Green, A. E. S.: Cloud ef-fects on middle ultraviolet global radiation, Acta Geophys. Pol., XXV(4), 287–301, 1977.
Bryant, E.: Climate Process and Change, 209 pp., Cambridge Univ. Press, New York, 1997.
Brazilian Society of Dermatology Website: http://www.sbd.org.br, National Program of Skin Cancer Control, 2003.
Calb´o, J., Pag`es, D., and Gonz´alez, J.: Empirical studies of cloud effects on UV radiation: A review, Rev. Geophys., 43, RG2002, doi:10.1029/2004RG000155, 2005.
CIE: Commission Internationale de l’Eclairage, Publication 17.4., 1987.
Den Outer, P. N., Slaper, H., and Tax, R. B.: UV radiation in the Netherlands: assessing long-term variability and trends in relation to ozone and clouds, J. Geophys. Res., 110, D02203, doi:10.1029/2004JD004824, 2005.
Diffey, B. L.: The consistency of studies of ultraviolet erythema in normal human skin, Phys. Med. Biol., 27, 715–720, 1982. Diffey, B. L.: Solar ultraviolet effects on biological systems, Phys.
Med. Biol., 36, 299–328, 1991.
Diffey, B. L.: Stratospheric ozone depletion and the risk of non-melanoma skin cancer in the British population, Phys. Med. Biol., 37(12), 2267–2274, 1992.
Estupi˜n´an, J. G., Raman, S., Crescenti, G. H., Streicher, J. J., and Barnard, W. F.: Effects of clouds and haze on UV-B radiation, J. Geophys. Res., 101(D11) 16 807–16 816, 1996.
Foyo-Moreno, I., Vida, J., and Alados-Arboledas, L.: Ground based ultraviolet (290–385 nm) and broadband solar radiation measure-ments in south-eastern Spain, Int. J. Climatol., 18, 1389–1400, 1998.
Foyo-Moreno, I., Vida, J., and Alados-Arboledas, L.: A simple all weather model to estimate ultraviolet solar radiation (290– 385 nm), J. Appl. Meteorol., 38, 1020–1026, 1999.
Frederick, J. E., Koob, A. E., Alberts, A. D., and Weatherhead, E. C.: Empirical studies of tropospheric transmission the ultravi-olet: Broadband measurements, J. Appl. Meteorol., 32, 1883– 1892, 1993.
Frederick, J. E. and Snell, H. E.: Tropospheric influence on solar ultraviolet radiation: the role of clouds, J. Climatol., 3, 373–381, 1990.
Frederick, J. E. and Steele, H. D.: The transmission of sunlight through cloudy skies: An analysis based on standard meteoro-logical information, J. Appl. Meteorol., 34, 2755–2761, 1995. Fr¨ohlich, C. and London, J. (Eds.): Revised Instruction Manual on
Radiation Instruments and Measurements, WCRP Publ. Series No. 7, WMO/TD, 140 pp., 1986.
Grant, R. H. and Heisler, G. M.: Estimation of ultraviolet-B irra-diance under variable cloud conditions, J. Appl. Meteorol., 39, 904–916, 2000.
Ilyas, M.: Effects of cloudiness on solar ultraviolet radiation reach-ing the surface, Atmos. Environ., 21, 1483–1484, 1987. Josefsson, W. and Landelius, T.: Effect of clouds on UV irradiance:
as estimated from cloud amount, cloud type, precipitation, global radiation and sunshine duration, J. Geophys. Res., 105, 4927– 4935, 2000.
Krzyscin, J. W. and Sobolewski, P. S.: The surface UV-B irradiation in the Arctic. Observations at the Polish polar station, Hornsund (77◦N, 15◦E), J. Atmos. Sol. Terr. Phys., 63, 321–329, 2001. Kuchinke, C. and Nunez, N.: Cloud transmission estimates of UV-B
erythemal irradiance, Theor. Appl. Climatol., 63, 149–161, 1999. Leszczynski, K., Jokela, K., Ylianttila, L., Visuri, R., and Blumthaler, M.: Erythemally weighted radiometers in solar UV monitoring: results from the WMO/STUK intercomparison, J. Photochem. Photobiol., 67, 212–221, 1998.
Lantz, K. O., Disterhoft, P., de Luisi, J. J., Early, E., Thomson, A., Bigelow, D., and Slusser, J.: Methodology for deriving clear sky erythemal calibration factors for UV broadband radiometers of the U.S. Central UV Calibration Facility, J. Atmos. Ocean. Technol., 16, 1736–1752, 1999.
Lebert, M., Schuster, M., and Hader, M.: The European light dosimeter network: four years of measurements, Photochem. Photobiol., 66, 81–87, 2002.
Lubin, D. and Frederick, J. F.: Ultraviolet radiation environment of the Antarctic Peninsula: The role of ozone and cloud cover, J. Appl. Meteorol., 30, 478–493, 1991.
Lubin, D., Jensen, E. H., and Gies, H. P.: Global surface ultravio-let climatology from TOMS and ERBE data, J. Geophys. Res., 103(D20), 26 061–26 091, 1998.
Ma, J. and Guicherit, R.: Effects of stratospheric ozone depletion and tropospheric pollution on UVB radiation in the troposphere, J. Photochem. Photobiol., 66, 346–355, 1997.
Vilaplana, J. M.: UV index experimental values during the years 2002 and 2001 from the Spanish broadband UV-B radiometric network, J. Photochem. Photobiol., 76, 181–187, 2002. McKinlay, A. F. and Diffey, L.: A reference spectrum for ultraviolet
induced erythema in human skin, CIE Journal, 6, 17–22, 1987. Nemeth, P., Toth, Z., and Nagy, Z.: Effect of weather conditions
on UV-B radiation reaching the earth’s surface, J. Photochem. Photobiol., 32, 177–181, 1996.
Pearson, A. J., Dean, S. F., Clark, I. E., Campbell, J. I., Grainger, K. J., and Driscoll, C. M. H.: NRPB solar ultraviolet radiation measurement network, Radiation Protection Dosimetry, 91, 169– 172, 2000.
Sabburg, J. and Wong, J.: Evaluation of a sky/cloud formula for estimating UV-B irradiance under cloudy conditions, J. Geophys. Res., 105, 29 685–29 691, 2000.
Schafer, J. S., Saxena, V. K., Wenny, B. N., Barnard, W., and de Luisi, J. J.: Observed influence of clouds on ultraviolet-B radia-tion, Geophys. Res. Lett., 23, 2625–2628, 1996.
Schwander, H., Koepke, P., Kaifel, A., and Seckmeyer, G.: Mod-ification of spectral UV irradiance by clouds, J. Geophys. Res., 107, 10 1029–10 1041, 2002.
Thiel, S., Steiner, K., and Seidlitz, H. K.: Modification of global erythematly effective irradiance by clouds, J. Photochem. Photo-biol., 65, 969–973, 1997.
Turnbull, D. J. and Parisi, A. V.: Spectral UV in public shade set-tings, J. Photochem. Photobiol. B. Biology, 69, 13–19, 2003. UNEP Report: Environmental effects of ozone depletion: 1998
as-sessment, J. Photochem. Photobiol. B. Biology, 46, 1–108, 1998.
UNEP Report: Environmental effects of ozone depletion and its interaction with climate change: 2002 assessment, J. Photochem. Photobiol. Science B. Biology, 2, 1–72, 2003.
Van der Leun, J. C., Tevini, M., and Worrest, M. (Eds.): Environ-mental Effects of Ozone Depletion: 1991 Update, United Na-tions Environmental Programme, Nairobi, 1991.
Van der Leun, J. C., Tevini, M., and Worrest, M. (Eds.): Environ-mental. Effects of Ozone Depletion: 1994 Update, United Na-tions Environmental Programme, Nairobi, 1994.
Van der Leun, J. C., Tevini, M., and Worrest, M. (Eds.): Environ-mental Effects of Ozone Depletion: 1998 Update, United Na-tions Environmental Programme, Nairobi, 1998.
Vanicek, K., Frei, T., Litynska, Z., and Schnalwieser, A.: UV-Index for the public, COST 713- Action (UV-B forecasting), Brussels, 2000.
WHO: Protection against exposure to ultraviolet radiation, Report WHO/EHG/95, World Health Organisation: Geneva, 17, 1995. WMO: Scientific Assessment of Ozone Depletion: 1998, Global
Ozone Research and Monitoring Project, Report No. 44, 1998. Zerefos, Z., Balis, D., Tzortziou, M., Bais, A., Tourpali, K., Meleti,
C., Bernhard, G., and Herman, J.: A note on the interannual variations of UV-B erythemal doses and solar irradiances from ground-based and satellite observations, Ann. Geophys., 19, 115–120, 2001,