ACPD
9, 13327–13354, 2009Sensitivity of polar stratospheric ozone
loss
S. R. Kawa et al.
Title Page
Abstract Introduction
Conclusions References
Tables Figures
◭ ◮
◭ ◮
Back Close
Full Screen / Esc
Printer-friendly Version
Interactive Discussion Atmos. Chem. Phys. Discuss., 9, 13327–13354, 2009
www.atmos-chem-phys-discuss.net/9/13327/2009/ © Author(s) 2009. This work is distributed under the Creative Commons Attribution 3.0 License.
Atmospheric Chemistry and Physics Discussions
This discussion paper is/has been under review for the journalAtmospheric Chemistry and Physics (ACP). Please refer to the corresponding final paper inACPif available.
Sensitivity of polar stratospheric ozone
loss to uncertainties in chemical reaction
kinetics
S. R. Kawa1, R. S. Stolarski1, P. A. Newman1, A. R. Douglass1, M. Rex2, D. J. Hofmann3, M. L. Santee4, and K. Frieler2,*
1
NASA Goddard Space Flight Center, Greenbelt, MD, USA
2
Alfred Wegener Institute for Polar and Marine Research, Potsdam, Germany
3
National Oceanic and Atmospheric Administration, Earth Systems Research Laboratory, Boulder, CO, USA
4
Jet Propulsion Laboratory, California Institute of Technology, Pasadena, CA, USA
*
now at: Potsdam Institute for Climate Impact Research (PIK), Potsdam, Germany Received: 19 May 2009 – Accepted: 29 May 2009 – Published: 17 June 2009 Correspondence to: S. R. Kawa ([email protected])
ACPD
9, 13327–13354, 2009Sensitivity of polar stratospheric ozone
loss
S. R. Kawa et al.
Title Page
Abstract Introduction
Conclusions References
Tables Figures
◭ ◮
◭ ◮
Back Close
Full Screen / Esc
Printer-friendly Version
Interactive Discussion
Abstract
The impact and significance of uncertainties in model calculations of stratospheric ozone loss resulting from known uncertainty in chemical kinetics parameters is evalu-ated in trajectory chemistry simulations for the Antarctic and Arctic polar vortices. The uncertainty in modeled ozone loss is derived from Monte Carlo scenario simulations 5
varying the kinetic (reaction and photolysis rate) parameters within their estimated un-certainty bounds. Simulations of a typical winter/spring Antarctic vortex scenario and Match scenarios in the Arctic produce large uncertainty in ozone loss rates and in-tegrated seasonal loss. The simulations clearly indicate that the dominant source of model uncertainty in polar ozone loss is uncertainty in the Cl2O2 photolysis reaction, 10
which arises from uncertainty in laboratory-measured molecular cross sections at at-mospherically important wavelengths. This estimated uncertainty inJCl2O2 from lab-oratory measurements seriously hinders our ability to model polar ozone loss within useful quantitative error limits. Atmospheric observations, however, suggest that the Cl2O2 photolysis uncertainty may be less than that derived from the lab data. Com-15
parisons to Match, South Pole ozonesonde, and Aura Microwave Limb Sounder (MLS) data all show that the nominal recommended rate simulations agree with data within uncertainties when the Cl2O2photolysis error is reduced by a factor of two, in line with previous in situ ClOx measurements. Comparisons to simulations using recent cross sections from Pope et al. (2007) are outside the constrained error bounds in each case. 20
Other reactions producing significant sensitivity in polar ozone loss include BrO+ClO and its branching ratios. These uncertainties challenge our confidence in modeling polar ozone depletion and projecting future changes in response to changing halo-gen emissions and climate. Further laboratory, theoretical, and possibly atmospheric studies are needed.
ACPD
9, 13327–13354, 2009Sensitivity of polar stratospheric ozone
loss
S. R. Kawa et al.
Title Page
Abstract Introduction
Conclusions References
Tables Figures
◭ ◮
◭ ◮
Back Close
Full Screen / Esc
Printer-friendly Version
Interactive Discussion
1 Introduction
The annual loss of ozone (O3) in the springtime polar lower stratosphere of both hemi-spheres is a key diagnostic for ozone assessment, recovery prediction, and chemistry interaction with climate change. To a large extent, our confidence in understanding and projecting changes in polar (and global) O3 is based on our ability to simulate 5
these loss processes in numerical models of chemistry and transport. The fidelity of the models is assessed in comparison with a wide range of observations. The models depend on laboratory-measured kinetic reaction rates and photolysis cross sections to simulate molecular interactions (Sander et al., 2006, hereafter referred to as JPL06). The rates of all of these reactions are subject to uncertainty, some of which is substan-10
tial. Given the complexity of the models, however, it is difficult to quantify uncertainty in many aspects of the system.
In this study we use trajectory box-model simulations for Antarctic and Arctic strato-spheric O3 to quantify the uncertainty in loss attributable to known reaction kinetic uncertainties. Following the method of earlier work, rates and uncertainties from the 15
latest laboratory evaluation are applied in random combinations (Stolarski et al., 1978; Stolarski and Douglass, 1986; Fish and Burton, 1997; Considine et al., 1999). We compare the results with observations to evaluate which combinations are consistent with atmospheric data. This also allows us to identify the key reactions and rates contributing the largest potential errors as a guide for future work. Note that these 20
simulations only test rate uncertainties, and their fidelity depends on the accuracy and completeness of the underlying chemical reaction set. Transport uncertainty is not in-cluded; however, the scenarios are chosen to minimize sensitivity to transport errors (see Antarctic trajectory discussion and references on Match trajectory uncertainties below).
25
ACPD
9, 13327–13354, 2009Sensitivity of polar stratospheric ozone
loss
S. R. Kawa et al.
Title Page
Abstract Introduction
Conclusions References
Tables Figures
◭ ◮
◭ ◮
Back Close
Full Screen / Esc
Printer-friendly Version
Interactive Discussion von Hobe et al., 2007; Schofield et al., 2008). In particular, the rate of polar O3 loss is
predominantly controlled by catalytic halogen reactions:
ClO+ClO+M ⇋Cl2O2+M (R1)
Cl2O2+hν→2Cl+O2 (R2)
and 5
ClO+BrO→BrCl+O2 (R3a)
Br+ClOO (R3b)
Br+OClO (R3c)
BrCl+hν→Br+Cl followed by
Cl+O3→ClO+O2 (R4)
Br+O3→BrO+O2 (R5)
Laboratory measurements of the Cl2O2photolysis cross sections by Pope et al. (2007) imply a much slower rate of photolysis than indicated by previous measurements 10
(Sander et al., 2006 and references within). This slower photolysis has a major im-pact in reducing the calculated O3 loss rate in polar conditions. In addition there is significant uncertainty in the forward and reverse rates of the ClO/Cl2O2 equilibrium Reaction (R1) and their temperature dependence (von Hobe et al., 2007). Note that throughout this paper Cl2O2refers to the symmetric isomer of the ClO-dimer (ClOOCl). 15
ACPD
9, 13327–13354, 2009Sensitivity of polar stratospheric ozone
loss
S. R. Kawa et al.
Title Page
Abstract Introduction
Conclusions References
Tables Figures
◭ ◮
◭ ◮
Back Close
Full Screen / Esc
Printer-friendly Version
Interactive Discussion O3 loss rates in Frieler et al. (2006) and WMO (2007) found that models generally
re-quired both additional stratospheric Br and a faster rate of Cl2O2photolysis than current recommendations to match observations.
In this paper we attempt to assess the impact of these uncertainties in simulating polar O3loss against the backdrop of known uncertainties in kinetic rates using a quan-5
titative model for the overall chemical error limits. Our overall objective is to evaluate the consistency of our theoretical understanding, model chemical mechanism, and ki-netic rate parameters, including known kiki-netic uncertainties, with recent observations of Arctic and Antarctic winter/spring O3 loss. Specifically, we 1) revisit the impact of kinetic uncertainties in models using JPL06 evaluations as well as new lab results (i.e., 10
Pope et al., 2007), 2) assess the impact of constraints on photolysis uncertainty limits provided by atmospheric observations, and 3) identify the major uncertainty sources in simulating polar O3loss that result from uncertainties in kinetics as a potential guide to further lab measurements.
In the next section we outline the trajectory chemistry scenarios and Monte Carlo 15
method used for calculating uncertainty bounds from the kinetic data. We also describe selection of data for comparison with the models. We then present the statistics of the calculations using JPL06 and the impact of constraining Cl2O2 photolysis error limits using atmospheric data. Following that we present comparisons with observations and implications for understanding processes and rates. We find that comparisons with 20
ozonesonde and Aura Microwave Limb Sounder (MLS) data in the Antarctic and Match observations in the Arctic present a consistent picture of seasonal O3loss and chlorine partitioning vis- `a-vis the kinetic rates and their uncertainties. The penultimate section summarizes key rate uncertainties in the polar O3 loss reaction system with potential for future measurement work, and the final section provides summary remarks.
ACPD
9, 13327–13354, 2009Sensitivity of polar stratospheric ozone
loss
S. R. Kawa et al.
Title Page
Abstract Introduction
Conclusions References
Tables Figures
◭ ◮
◭ ◮
Back Close
Full Screen / Esc
Printer-friendly Version
Interactive Discussion
2 Model scenarios and diagnostic observations
Results are presented below for the Antarctic and Arctic using slightly different calcula-tion procedures and somewhat different observational data. The methods were devel-oped independently but the findings are consistent between them, and both methods are described here. Our baseline for kinetic rates and uncertainties is JPL06 but in 5
some cases reference is made to earlier studies using JPL02 (Sander et al., 2003), JPL97 (DeMore et al., 1997), and JPL94 (DeMore et al., 1994). Note that the rec-ommendation for Cl2O2 photolysis cross sections and uncertainties has not changed since JPL97.
2.1 Antarctic model
10
A single, representative trajectory parcel was chosen for the Antarctic vortex from 29 July to 27 October. This parcel was selected from a run of 360 trajectory sam-ples initialized at 80◦S at 1◦ longitude increments on 27 September 2000 (a typical stratospheric winter). The trajectories were run backward 60 days to 29 July and then forward 30 days to 27 October. The trajectory winds were from the United Kingdom 15
Meteorological Office operational analysis. The parcel was selected to be deep in the vortex at the time of maximum ozone loss, and have near-median potential tempera-ture evolution and latitude-longitude excursions. In general, the vortex parcels follow statistically similar paths through this time period. This representative parcel’s average latitude was 73◦S varying between 89◦S and 57◦S at pressures from 40 to 67 hPa, 20
and it diabatically descended over the course of the trajectory.
Chemical evolution along the trajectory was calculated using the standard Goddard stratospheric mechanism (Kawa et al., 1997), which is typical of current models. The initial chemical state of the trajectory was taken from a run of the global CTM with minor adjustments to the O3 and reactive chlorine (Cly) abundances to more closely corre-25
ACPD
9, 13327–13354, 2009Sensitivity of polar stratospheric ozone
loss
S. R. Kawa et al.
Title Page
Abstract Introduction
Conclusions References
Tables Figures
◭ ◮
◭ ◮
Back Close
Full Screen / Esc
Printer-friendly Version
Interactive Discussion half of the trajectory when the temperature is sufficiently low. An additional 5 pptv of
Bry was included in the standard runs to represent the contribution from short-lived bromine-containing compounds reaching the stratosphere (WMO, 2007). Overhead O3and surface albedo for the photolysis calculations were derived from TOMS obser-vations for 2000 interpolated to the trajectory (Pierson et al., 1999). The time series 5
of O3along the trajectory for standard JPL06 chemistry can be seen in the central red curve in Fig. 1.
2.2 Kinetics uncertainties and Monte Carlo simulations
Kinetics uncertainties for the Antarctic calculations in this paper were taken from JPL06. Since all reaction rates must be positive, a lognormal distribution was assumed 10
for the uncertainty in each rate coefficient, as described by Stolarski et al. (1978). That is, the nominal (median) value is multiplied and divided by a factor scaled to the JPL06 uncertainty estimates assuming a normal distribution of errors. The uncertainties in JPL06 are expressed as uncertainty in the measurement at a temperature of 298 K and an independent uncertainty in the temperature dependence. We convert these to 15
uncertainties in the coefficients of the Arrhenius form of the reaction rate coefficient:
k(T)=Aexp(−E/R/T)
by the method described in JPL06. For uncertainties in termolecular reactions we have used the low-pressure limit form
k(T)=AT−n
20
and the estimates for uncertainty in k298 and temperature dependence as described in JPL06. The rate coefficients use the full formula given in JPL06, but the uncer-tainties were calculated using only the low-pressure limit. Unceruncer-tainties in photolysis coefficients were also taken from JPL06 and were applied uniformly at all wavelengths. The exception to this is the photolysis rate for Cl2O2, for which somewhat different 25
ACPD
9, 13327–13354, 2009Sensitivity of polar stratospheric ozone
loss
S. R. Kawa et al.
Title Page
Abstract Introduction
Conclusions References
Tables Figures
◭ ◮
◭ ◮
Back Close
Full Screen / Esc
Printer-friendly Version
Interactive Discussion To evaluate the collective importance of the uncertainties in the 120 reactions and
37 photolysis (J) coefficients, we use a Monte Carlo technique previously described by Stolarski et al. (1978), Stolarski and Douglass (1986), and Considine et al. (1999). Briefly, a set of random rate coefficients andJ coefficients, constrained to the recom-mended uncertainties, is produced for each simulation. This is repeated 1000 times to 5
produce a distribution of constituent concentrations along the selected trajectory. The Cl2O2cross section presents a special case for this paper. The rate evaluation panels attempt to estimate statistical uncertainties on the photolysis rates based on expert knowledge and consensus regarding reported results (JPL06). For Cl2O2cross sections, the lab measurements are very difficult, results vary widely, and the number 10
of measurements is small (5 at stratospherically important wavelengths and tempera-tures), so the uncertainty estimate is correspondingly large (JPL06). We carried out 3 sets of Monte Carlo simulations (1000 members to each set). The first of these used the uncertainty stated in JPL06 (we used the uncertainty for the long wavelength por-tion of the spectrum, >300 nm). The second halved the uncertainty factor (3 to 1.5) 15
to account for the constraints provided by atmospheric measurements as discussed below. The third used the recent Pope et al. (2007) cross sections as a baseline and the reduced uncertainty bounds.
As a further test, we evaluated the sensitivity of the O3 loss along the selected tra-jectory to each of the rate coefficients by varying that coefficient individually by plus 20
and minus one sigma.
2.3 Antarctic observations
The modeled evolution of O3is compared to ozonesondes at South Pole station (Hof-mann et al., 1997) and McMurdo station (Nardi et al., 1999), and satellite data from Aura MLS (Santee et al., 2008). HCl from MLS is also compared to the model. For 25
ACPD
9, 13327–13354, 2009Sensitivity of polar stratospheric ozone
loss
S. R. Kawa et al.
Title Page
Abstract Introduction
Conclusions References
Tables Figures
◭ ◮
◭ ◮
Back Close
Full Screen / Esc
Printer-friendly Version
Interactive Discussion latitude averaged daily data for 2005–2007 to the potential temperature/equivalent
lati-tude of the sample trajectory selected above. The 3-year average and range of yearly-interpolated data are shown below. Similar results are obtained using zonal mean MLS at 76◦S to 80◦S between 46 and 68 hPa; the potential temperature/equivalent latitude averaging provides a convenient method to aggregate the data. Antarctic O3 loss is 5
fairly consistent from year to year in the late 1990s and 2000s except for 2002 and 2004, which had anomalously warm conditions (Hoppel et al., 2005; Santee et al., 2008). In each year, observed O3 mixing ratios in the polar lower stratospheric vortex approach zero by mid-to-late September.
2.4 Arctic Match observations and model
10
For the Arctic, we concentrate on the polar winter of 1999–2000 because of the ex-tensive in situ and remote measurement sets available during that year, including the SOLVE/THESEO and Match field campaigns (Newman et al., 2002; Rex et al., 2002). Polar O3loss is derived from regression analysis of sequential Match ozonesonde ob-servations along air parcel trajectories (Rex et al., 1998; 2003). A photochemical box 15
model is run along the identical trajectories used for the O3 loss calculations. The chemical model uses a simplified mechanism that includes known reactions relevant to O3 loss in the lower stratosphere, with Cly and Bry constrained by observations (Rex et al., 2003; Frieler et al., 2006). The Bry abundance is based on DOAS profile mea-surements over Sweden in 2000, reflecting a contribution of approximately 6 pptv from 20
ACPD
9, 13327–13354, 2009Sensitivity of polar stratospheric ozone
loss
S. R. Kawa et al.
Title Page
Abstract Introduction
Conclusions References
Tables Figures
◭ ◮
◭ ◮
Back Close
Full Screen / Esc
Printer-friendly Version
Interactive Discussion
3 Monte Carlo simulation results
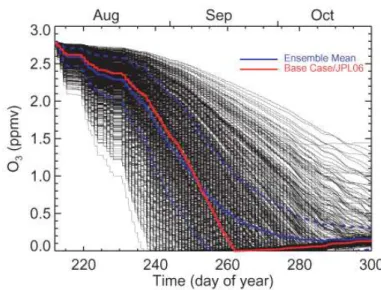
The full 1000-member ensemble of calculated O3time series for the Antarctic is shown in Fig. 1 based on rate uncertainties as tabulated in JPL06. A wide range in possible O3 loss is found, from complete destruction before the end of August (day 238) to less than 50% loss by the end of October (day 304). This range is driven almost entirely by the 5
stated uncertainty in Cl2O2photolysis, which is a factor of three at wavelengths greater than 300 nm based on uncertainty in the measured molecular cross sections (JPL06). Almost all calculated lower stratospheric photolysis of Cl2O2 takes place at the longer wavelengths, where the laboratory measurements are most susceptible to possible contamination from photolysis of other chlorine species (Burkholder et al., 1990; Huder 10
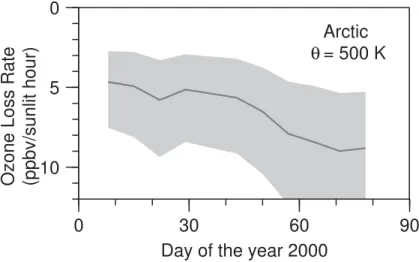
and DeMore, 1995; Pope et al., 2007). Based on JPL06 uncertainties (i.e., even without considering the results of Pope et al., 2007), modeled O3loss rates have an uncertainty of up to a factor of three. The same conclusion is reached for analysis of O3 loss in the Arctic using Match trajectory-chemistry (Fig. 2). The upper and lower limits of the uncertainty interval (i.e., the inner 68% of the calculated ozone loss rates) differ by a 15
factor of three. The primary message of this paper is that the stated uncertainty in the photolysis rateJCl2O2 from laboratory measurements precludes modeling of polar O3 loss within any useful quantitative error limits, and, at this level of uncertainty, not much else matters. The loss rate uncertainties fromJCl2O2are larger than any produced by varying other photolysis rates, Bry, other tracers, reaction rates, trajectories, or 20
transport within reasonable limits.
In order to move beyond the impact of nominal uncertainty in JCl2O2 to see what other rates and factors most strongly affect polar O3 loss, we constrained the uncer-tainty in JCl2O2 based on analysis of in situ atmospheric measurements of ClO and Cl2O2 (Stimpfle et al., 2004). Comparing the measured ClO/Cl2O2 with model for-25
ACPD
9, 13327–13354, 2009Sensitivity of polar stratospheric ozone
loss
S. R. Kawa et al.
Title Page
Abstract Introduction
Conclusions References
Tables Figures
◭ ◮
◭ ◮
Back Close
Full Screen / Esc
Printer-friendly Version
Interactive Discussion Hobe et al. (2008) reached a very similar range of uncertainty forJCl2O2 based on an
extensive analysis of observations and lab measurements, including uncertainties in the ClO/Cl2O2 equilibrium reactions. The analysis of in situ ClO measurements from Avallone and Toohey (2001) are also within this range. Therefore, we repeated our Monte Carlo uncertainty calculations using a halved uncertainty factor of 1.5 forJCl2O2 5
(which is the nominal uncertainty for photolysis at wavelengths less than 300 nm from JPL06), consistent with the results from atmospheric ClO and Cl2O2measurements.
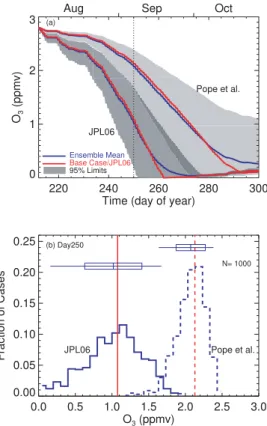
The results of the Antarctic trajectory scenario usingJCl2O2=JCl2O2(1±σ),σ=0.5, are shown in Fig. 3 (red line on the left side with darker grey shading). The uncertainty in the range of O3 losses is still large. Using the date at which the O3 mixing ratio first 10
reaches a value less than 0.1 ppmv, the values range around a base value of day 260.9 (16 September) from day 251 (7 September) to day 276 (2 October) for the JPL06 case at the 95% confidence limits. Uncertainty in Cl2O2 photolysis is still the largest source of uncertainty in the O3 loss (more below), but at this uncertainty level other error sources are discernable. For example, the scenarios using Pope et al. (2007) cross 15
sections for the baseline are distinguishable from JPL06 at or near the 95% confidence level (Fig. 3a). The minimum O3 in the base Pope et al. case reaches a minimum of 0.09 ppmv on day 294. The statistics of the distribution of O3on day 250 in the different scenarios is seen in Fig. 3b. There is little overlap between the JPL06 and Pope et al. photolysis distributions and both are slightly skewed toward low O3 mixing ratios. In 20
each, the base case, mean, and most probable value are within 0.1 ppmv of each other. The impact of uncertainty in other kinetic rates is discussed in Sect. 4 below.
In the course of developing these scenarios, we have tested a number of other sen-sitivities in polar O3 loss that are worth comparing to the kinetics uncertainty range shown here. The O3 loss rates are sensitive to the amounts of Cly and Bry as ex-25
ACPD
9, 13327–13354, 2009Sensitivity of polar stratospheric ozone
loss
S. R. Kawa et al.
Title Page
Abstract Introduction
Conclusions References
Tables Figures
◭ ◮
◭ ◮
Back Close
Full Screen / Esc
Printer-friendly Version
Interactive Discussion date of O3<0.1 ppmv by 4 days. Note that Cly decreases by about 3% between 2000
and 2006 (Newman et al., 2006).
The O3 loss is nearly insensitive to the rates of heterogeneous processes in the Antarctic scenario. Cly is nearly fully processed to reactive forms on 1 August and little recovery to reservoir species, HCl and ClONO2, occurs in the low sun conditions 5
through September. Varying the heterogeneous reaction rates by a factor of 2 changes the time of O3<0.1 ppmv by less than an hour. Heterogeneous reactions on liquid ternary solution droplets and the occasional PSCs are more than fast enough to keep all Cly activated until the final shift to HCl that occurs when O3is depleted (see below). The loss rates are sensitive to temperature with the date of O3<0.1 shifting by−1.7
10
to 2.3 days for a constant delta temperature of−5 and 5 K, respectively. Changes in
the assumed surface albedo (0.1 to 0.6) have only a negligible effect (<0.5 d) for the photolysis calculations in this scenario, while varying overhead O3(±50 DU) changes the date by±1 day.
The shape of the O3loss curve and date of mixing ratio<0.1 does depend strongly 15
on the parcel trajectory through the Antarctic vortex. We have run thousands of tra-jectories from different initial conditions in the Antarctic over the time of our selected parcel to examine this sensitivity. A wide range of O3 values is possible (although not as wide as in Fig. 1). The probability distribution function for day 250 (not shown) is relatively flat and the distribution of O3across the various trajectories is decidedly not 20
Gaussian. As expected, our selected parcel is near the mean and most probable value of this distribution. In general, parcels at more equatorward latitudes and higher alti-tudes begin to lose O3 sooner as the sun rises earlier, and complete O3 loss occurs earlier provided they are completely activated and denitrified. The O3time series from our selected parcel corresponds closely to that of a zonal average of parcels at 75◦S 25
ACPD
9, 13327–13354, 2009Sensitivity of polar stratospheric ozone
loss
S. R. Kawa et al.
Title Page
Abstract Introduction
Conclusions References
Tables Figures
◭ ◮
◭ ◮
Back Close
Full Screen / Esc
Printer-friendly Version
Interactive Discussion note that the conclusions discussed above regarding the uncertainty of O3loss
result-ing from uncertainty in Cl2O2 photolysis, the relative comparison between JPL06 and Pope et al., and the contribution of other kinetics uncertainties discussed below do not depend critically on the choice of trajectory. The large majority of Antarctic trajectories would show the same sensitivity.
5
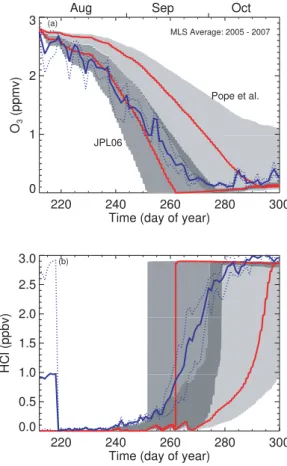
3.1 Antarctic comparisons with data
Comparisons with averaged MLS O3 and HCl from 2005–2007 are shown in Fig. 4a and b, respectively. The O3observations generally follow the JPL06 base case and fall within the 95% uncertainty limits given by the kinetics uncertainties on the JPL06 rate scenario (assuming an uncertainty factor of 1.5 for the Cl2O2cross section). The data 10
are outside the Pope et al. scenario bounds, at least until O3 loss is near complete in October. The day-to-day fluctuations in MLS O3result from both equivalent latitude ex-cursions of the trajectory and variations in the potential temperature/equivalent latitude averages of the data.
The MLS HCl comparison (Fig. 4b) is consistent with the O3 time series. When 15
O3 mixing ratios fall below about 0.5 ppmv, HCl increases rapidly, driven by produc-tion from reacproduc-tion of Cl and CH4 (Douglass et al., 1995; Douglass and Kawa, 1999). The averaged MLS HCl rises more gradually than the unmixed trajectory scenario, but the mixing ratios remain within or near the model error bars given by the JPL06 rate uncertainties through October. Neither MLS dataset is consistent with the Pope et 20
al. scenario, consistent with the results of Santee et al. (2008).
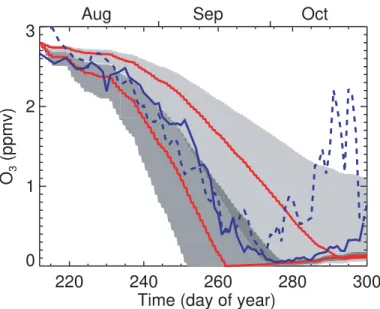
Comparison of the range of model O3 with sonde data from South Pole (SP) and McMurdo for several years is shown in Fig. 5. In each year at each site, the measured O3 decreases to near-zero mixing ratios. On most days at SP, the data fall within the 95% confidence limits on the JPL06 rate scenario and outside the Pope et al. scenario. 25
ACPD
9, 13327–13354, 2009Sensitivity of polar stratospheric ozone
loss
S. R. Kawa et al.
Title Page
Abstract Introduction
Conclusions References
Tables Figures
◭ ◮
◭ ◮
Back Close
Full Screen / Esc
Printer-friendly Version
Interactive Discussion more equatorial latitudes. The sun does not rise at 50 hPa over SP until about day 246
(3 September), when the main O3 decline begins, but some loss has already begun in August in most years. Interannual variation in the loss rate and minimum date is related to meteorological variability, but in all years from 1998 to 2007 (except 2002) O3 at the SP goes to near zero (<0.1 ppmv) within±5 days of day 270 (see Hofmann 5
et al., 1997, 2009 for updates through 2007). Average O3 from McMurdo at 77.5◦S starts out a bit higher than our trajectory initial condition, but generally falls within the JPL06 limits through September (day 274). McMurdo O3 loss appears to lead SP by several days on average, but the range of the data is relatively large (about±0.5 ppmv).
In October, McMurdo shows the effects of vortex distortion and mixing on local O3 in 10
some years.
3.2 Arctic comparisons with Match data
Comparison of the overall Match observed O3 loss rate for the year 2000 with model simulations for a range of Cl2O2cross section measurements is shown in Fig. 6. In this case error bars on the model calculation (red curve and bars in Fig. 6) represent the 15
uncertainty in inferring the amount of activated Cly for the O3 loss calculation, rather than the kinetics uncertainties. For Match, the best agreement with data occurs for the model based on Cl2O2cross sections from Burkholder et al. (1990). The model based on the JPL06 recommendation is within the uncertainty of the data. Model and data errors bars nearly overlap using the Huder and DeMore (1995) cross sections, which 20
are about a factor of 1.5 lower than JPL06, consistent with the constrained uncertainty discussion above. This analysis is consistent with 6 years of Match data, including the Antarctic in 2003 (Frieler et al., 2006). The model with Pope et al. (2007) cross sections is outside observational error limits.
In a complementary approach, the Match O3 loss rates can be “inverted” using the 25
ACPD
9, 13327–13354, 2009Sensitivity of polar stratospheric ozone
loss
S. R. Kawa et al.
Title Page
Abstract Introduction
Conclusions References
Tables Figures
◭ ◮
◭ ◮
Back Close
Full Screen / Esc
Printer-friendly Version
Interactive Discussion al., 2004) using Burkholder or JPL06 cross sections (and enhanced Br) (Frieler et al.,
2006). The amount of Cly required (3 to 10 ppbv) to produce observed loss using the Pope et al. cross sections is significantly more than the total chlorine in the stratosphere (∼3.5 ppbv).
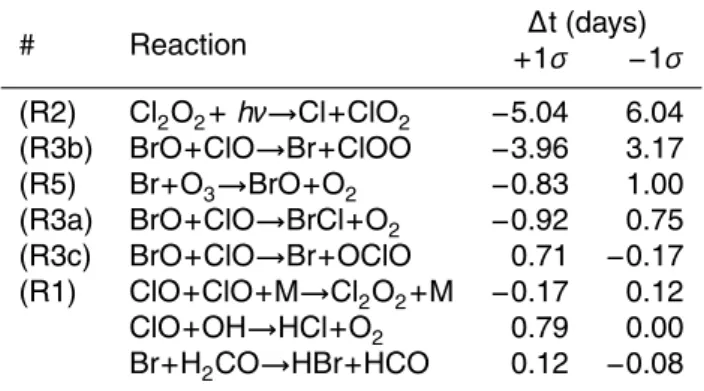
4 Sensitivity to key reactions and uncertainties
5
In addition to the Monte Carlo distribution of rate uncertainties run above, we also ran the Antarctic simulation varying rates one at a time at the±1σuncertainty limits given in
JPL06 (exceptJCl2O2for which the uncertainty was set at 1.5 as discussed above). The reactions with the largest uncertainty impacts, in terms of date of initial O3<0.1 ppmv, for the Antarctic scenario are given in Table 1. The uncertainty in Cl2O2photolysis Re-10
action (R2) still has the largest impact on polar O3loss, but the uncertainty in ClO+BrO Reaction (R3) is close behind. Reaction (3b) has the largest effect among the possible product yields for Reaction (R3) because this channel directly recycles the Br and Cl in sunlight, while Reaction (R3c) sequesters Cl in OClO at low zenith angles (producing the opposite sensitivity). The BrCl channel Reaction (R3a) is a minor pathway (∼8%)
15
(JPL06). Note that our modeling protocol treats uncertainty in each of these reaction pathways independently, which is probably not the case in the laboratory measure-ments, where the errors are likely correlated. Regardless of branching ratio, however, this exercise shows that uncertainty in this reaction causes a significant uncertainty in calculating polar O3loss.
20
The direct rate of O3loss with Br Reaction (R5) has some uncertainty impact, which will, of course, depend on the amount of Bry in the vortex. The Cl2O2 formation and back Reaction (R1), which have substantial uncertainty from lab studies, do not have a large impact on polar O3 loss because thermal dissociation is small compared to photolysis in sunlight, and photolysis Reaction (R2) is generally rate limiting compared 25
ACPD
9, 13327–13354, 2009Sensitivity of polar stratospheric ozone
loss
S. R. Kawa et al.
Title Page
Abstract Introduction
Conclusions References
Tables Figures
◭ ◮
◭ ◮
Back Close
Full Screen / Esc
Printer-friendly Version
Interactive Discussion interpretation of ambient Cly measurements (e.g., Stimpfle et al., 2004). Reactions that
remove Cl and Br from the active catalytic cycle into HCl and HBr show minor impact. Sensitivity to all other reactions is negligible in this scenario.
The Arctic Match O3loss uncertainty is also dominated by the top two reaction sensi-tivities as in Table 1, with Reaction (R1) in a distant third place. These findings are sim-5
ilar to those of Fish and Burton (1997) in the Arctic using JPL94 kinetic rates, although Fish and Burton found that Reaction (R3b) contributed a slightly larger uncertainty than Reaction (R2). In lieu of a recommendation from JPL94, Fish and Burton estimated
σ(JCl2O2) at a factor of 2, which they considered possibly overestimated in light of atmo-spheric ClO data. The nominal recommended cross sections in JPL06 are the same 10
as those in JPL94, and, while the mean rates for Reaction (R3) have changed slightly, the uncertainty bounds have not. The different ranking of reaction uncertainties from Fish and Burton probably arises from the specifics of the trajectories used and the Cly and Bry abundances.
5 Summary discussion
15
Quantitative evaluation of chemical uncertainty underlying stratospheric assessment models shows that known uncertainties in kinetic reaction rate parameters from labo-ratory measurements produce large uncertainty in polar O3loss calculated in simple, representative models. For both Antarctic and Arctic O3 loss, the Monte Carlo uncer-tainty distribution is dominated by the recommended JPL06 unceruncer-tainty in photolysis 20
cross sections for Cl2O2 at atmospherically relevant wavelengths. This uncertainty is large enough to include the recent cross section measurements of Pope et al. (2007), which imply greatly reduced polar O3loss rates in a standard model mechanism. New laboratory measurements are required to better interpret these and earlier results and diminish the error bounds. This finding is consistent with previous work, and several 25
new lab studies are in progress (SPARC, 2009).
pho-ACPD
9, 13327–13354, 2009Sensitivity of polar stratospheric ozone
loss
S. R. Kawa et al.
Title Page
Abstract Introduction
Conclusions References
Tables Figures
◭ ◮
◭ ◮
Back Close
Full Screen / Esc
Printer-friendly Version
Interactive Discussion tolysis rate can be constrained more tightly than the lab data indicate. When the
pho-tolysis rate uncertainty in the Monte Carlo simulations is constrained by atmospheric observations, the impact of varying Cl2O2cross sections between JPL06 and Pope et al. is distinct at the 95% confidence level for spring/winter Antarctic O3 loss. In this case, comparison to observations shows the ozonesonde, MLS, and Match data are 5
consistent with JPL06 kinetic rates within model uncertainty. This lends confidence that the chemical mechanism and JPL06 rates in the models are representative and reasonably accurate. Note that ifJCL2O2 is close to that produced from Pope et al., a large fraction of the observed O3loss cannot be explained by the standard chemistry mechanism. Efforts to simultaneously explain all the relevant theoretical, laboratory, 10
and atmospheric data by identifying missing processes or using an alternate chemical mechanism have yet to yield a solution (SPARC, 2009).
Sensitivity tests have also shown that uncertainty in the rate and branching ratio for BrO+ClO has a significant impact on uncertainty in polar O3 loss calculations in both hemispheres. This finding is consistent with previous work based on earlier rate 15
compilations at midlatitudes and in the Arctic, and leads us to a recommendation for further laboratory work on this reaction as well. The importance of this reaction is closely tied to the amount of bromine in the lower stratosphere, which also has sig-nificant uncertainty based on current measurements. Uncertainty in the key chemical reaction kinetics must be reduced in order to confidently assess the impact of changes 20
in bromine and other trace gases on future projections of polar O3loss and recovery.
Acknowledgements. We would like to acknowledge support from the Atmospheric Chemistry Modeling and Analysis and the Modeling, Analysis, and Prediction Programs at NASA. Work at the Jet Propulsion Laboratory, California Institute of Technology, was done under contract with the National Aeronautics and Space Administration. Work at AWI was supported by the
25
ACPD
9, 13327–13354, 2009Sensitivity of polar stratospheric ozone
loss
S. R. Kawa et al.
Title Page
Abstract Introduction
Conclusions References
Tables Figures
◭ ◮
◭ ◮
Back Close
Full Screen / Esc
Printer-friendly Version
Interactive Discussion
References
Avallone, L. M. and Toohey, D. W.: Tests of halogen photochemistry using in situ measurements of ClO and BrO, J. Geophys. Res., 106(10), 10411–10421, 2001.
Burkholder, J. B., Orlando, J. J., and Howard, C. J.: Ultraviolet-absorption cross-sections of Cl2O2between 210 and 410 nm, J. Phys. Chem., 94, 687–695, 1990.
5
Canty, T., Riviere, E. D., Salawitch, R.J., Berthet, G., Renard, J. B., Pfeilsticker, K., Dorf, M., Butz, A., Bosch, H., Stimpfle, R. M., Wilmouth, D. M., Richard, E. C., Fahey, D. W., Popp, P. J., Schoeberl, M. R., Lait, L. R., Bui, T. P.: Nighttime OClO in the winter Arctic vortex, J. Geophys. Res., 110, D01301, doi:10.1029/2004JD005035, 2005.
Considine, D. B., Stolarski, R. S., Hollandsworth, S. M., Jackman, C. H., and Fleming, E. L.: A
10
Monte Carlo uncertainty analysis of ozone trend predictions in a two-dimensional model, J. Geophys. Res., 104, 1749–1765, 1999.
DeMore, W. B., Sander, S. P., Golden, D. M., et al.: Chemical Kinetics and Photochemical Data for Use in Stratospheric Modeling, Evaluation Number 11, JPL Publication 94-26, Jet Propulsion Laboratory, Pasadena, Calif., 1994.
15
DeMore, W. B., Sander, S. P., Golden, D. M., et al.: Chemical Kinetics and Photochemical Data for Use in Stratospheric Modeling, Evaluation Number 12, JPL Publication 97-4, Jet Propulsion Laboratory, Pasadena, Calif., 1997.
Douglass, A. R., Schoeberl, M. R., Stolarski, R. S., Waters, J. W., Russell, J. M., Roche, A. E., and Massie, S. T.: Interhemispheric differences in springtime production of HCl and ClONO2
20
in the polar vortices, J. Geophys. Res., 100, 13967–13978, 1995.
Douglass, A. R. and Kawa, S. R.: Contrast between 1992 and 1997 high latitude Spring Halo-gen Occultation Experiment observations of lower stratospheric HCl, J. Geophys. Res., 104, 18739–18754, 1999.
Fish, D. J. and Burton, M. R.: The effect of uncertainties in kinetic and photochemical data on
25
model predictions of stratospheric ozone depletion, J. Geophys. Res., 102, 25537–25542, 1997.
Frieler, K., Rex, M., Salawitch, R. J., Canty, T., Streibel, M., Stimpfle, R. M., Pfeilsticker, K., Dorf, M., Weisenstein, D. K., and Godin-Beekmann, S.: Toward a better quantita-tive understanding of polar stratospheric ozone loss, Geophys. Res. Lett., 33, L10812,
30
doi:10.1029/2005GL025466, 2006.
ACPD
9, 13327–13354, 2009Sensitivity of polar stratospheric ozone
loss
S. R. Kawa et al.
Title Page
Abstract Introduction
Conclusions References
Tables Figures
◭ ◮
◭ ◮
Back Close
Full Screen / Esc
Printer-friendly Version
Interactive Discussion
of ozonesonde measurements at the South Pole: Implications for recovery of springtime Antarctic ozone, J. Geophys. Res., 102, 8931–8943, 1997.
Hofmann, D. J., Johnson, B. J., and Oltmans, S. J.: Twenty-two years of ozonesonde mea-surements at the South Pole, Proceedings of the Quadrennial Ozone Symposium, Tromso, Norway, 2008, J. Remote Sens., in press, 2009.
5
Hoppel, K., Bevilacqua, R., Canty, T., Salawitch, R. J. and Santee, M. L.: A measurement/model comparison of ozone photochemical loss in the Antarctic ozone hole using Polar Ozone and Aerosol Measurement observations and the Match technique, J. Geophys. Res., 110, D19304, doi:10.1029/2004JD005651, 2005.
Huder, K. J. and DeMore, W. B.: Absorption cross sections of the ClO dimer, J. Phys. Chem.,
10
99, 3905–3908, 1995.
Kawa, S. R., Newman, P. A., Lait, L. R., Schoeberl, M. R., Stimpfle, R. M., Kohn, D. W., Webster, C. R., May, R. D., Baumgardner, D., Dye, J. E., Wilson, J. C., Chan, K. R., and Loewenstein, M.: Activation of chlorine in sulfate aerosol as inferred from aircraft observations, J. Geophys. Res., 102, 3921–3933, 1997.
15
Nardi, B., Bellon, W., Oolman, L. D., and Deshler, T.: Spring 1996 and 1997 ozonesonde measurements over McMurdo Station, Antarctica, Geophys. Res. Lett., 26, 723–726, 1999. Newman, P. A., Harris, N. R. P., Adriani, A., et al.: An overview of the SOLVE/THESEO 2000
campaign, J. Geophys. Res., 107(D20), 8259, doi:10.1029/2001JD001303, 2002.
Newman, P. A., Nash, E. R., Kawa, S. R., Montzka, S. A., and Schauffler, S.
20
M.: When will the Antarctic ozone hole recover?, Geophys. Res. Lett., 33, L12814, doi:10.1029/2005GL025232, 2006.
Pierson, J. M., Kawa, S. R., Salawitch, R. J., Hanisco, T. F., Lanzendorf, E. J., Perkins, K. K., and Gao, R. S.: The influence of airmass histories on radical species during POLARIS, J. Geophys. Res., 105, 15185–15199, 2000.
25
Pope, F. D., Hansen, J. C., Bayes, K. D., Friedl, R. R., and Sander, S. P.: J. Phys. Chem., 111, 4322–4332, 2007.
Rex, M., von der Gathen, P., Harris, N. R. P., Lucic, D., Knudsen, B. M., Braathen, G.O., Reid, S. J., De Backer, H., Claude, H., Fabian, R., Fast, H., Gil, M., Kyro, E., Mikkelsen, I. S., Rummukainen, M., Smit, H. G., Stahelin, J., Varotsos, C., Zaitcev, I.: In situ measurements of
30
stratospheric ozone depletion rates in the Arctic winter 1991/1992: A Lagrangian approach, J. Geophys. Res., 103, 5843–5853, 1998.
ACPD
9, 13327–13354, 2009Sensitivity of polar stratospheric ozone
loss
S. R. Kawa et al.
Title Page
Abstract Introduction
Conclusions References
Tables Figures
◭ ◮
◭ ◮
Back Close
Full Screen / Esc
Printer-friendly Version
Interactive Discussion
Deckelmann, H., Chipperfield, M., Sinnhuber, B. M., Reimer, E., Alfier, R., Bevilacqua, R., Hoppel, K., Fromm, M., Lumpe, J., Kullmann, H., Kleinbohl, A., Bremer, H., von Konig, M., Kunzi, K., Toohey, D., et al.: Chemical depletion of Arctic ozone in winter 1999/2000, J. Geophys. Res., 107(D20), 8276, doi:10.1029/2001JD000533, 2002.
Rex, M., Salawitch, R. J., Santee, M. L., Waters, J. W., Hoppel, K., and Bevilacqua, R.: On the
5
unexplained stratospheric ozone losses during cold Arctic Januaries, Geophys. Res. Lett., 30(1), 1008, doi:10.1029/2002GL016008, 2003.
Salawitch, R. J., Weisenstein, D. K., Kovalenko, L. J., Sioris, C. E., Wennberg, P. O., Chance, K., Ko, M. K. W., and McLinden, C. A.: Sensitivity of ozone to bromine in the lower stratosphere, Geophys. Res. Lett., 32, L05811, doi:10.1029/2004GL021504, 2005.
10
Sander, S. P., Friedl, R. R., Golden, D. M., Kurylo, M. J., Huie, R. E., Orkin, V. L., Moortgat, G. K., Ravishankara, A. R., Kolb, C. E., Molina, M. J., and Finlayson-Pitts, B. J.: Chemical Kinetics and Photochemical Data for Use in Atmospheric Studies, Evaluation Number 14, JPL Publication 02-25, Jet Propulsion Laboratory, Pasadena, Calif., 2003.
Sander, S.P., Friedl, R. R., Golden, D. M., Kurylo, M. J., Moortgat, G. K., Keller-Rudek, H.,
15
Wine, P. H., Ravishankara, A. R., Kolb, C. E., Molina, M. J., Finlayson-Pitts, B. J., Huie, R. E., and Orkin, V. L.: Chemical Kinetics and Photochemical Data for Use in Atmospheric Studies, Evaluation Number 15, JPL Publication 06-02, Jet Propulsion Laboratory, Pasadena, Calif., 2006.
Santee, M. L., MacKenzie, I. A., Manney, G. L., Chipperfield, M. P., Bernath, P. F., Walker, K.
20
A., Boone, C. D., Froidevaux, L., Livesey, N. J., and Waters, J. W.: A study of stratospheric chlorine partitioning based on new satellite measurements and modeling, JGR 113, D12307, doi:10.1029/2007JD009057, 2008.
Schofield R., Frieler, K., Wohltmann, I., Rex, M., von Hobe, M., Stroh, F., Koch, G., Pe-ter, T., Canty, T., Salawitch, R. J. and Volk, C. M.: Polar stratospheric chlorine
kinet-25
ics from a self-match flight during SOLVE-II/EUPLEX, Geophys. Res. Lett., 35, L01807, doi:10.1029/2007GL031740, 2008.
Stratospheric Processes and Their Role in Climate, The Role of Halogen Chemistry in Polar Stratospheric Ozone Depletion: Report from the June 2008 Cambridge, UK Workshop for an Initiative under the Stratospheric Processes and Their Role in Climate (SPARC) Project of
30
the World Climate Research Programme, available at http://www.atmosp.physics.utoronto. ca/SPARC/HalogenChem Final 20090213.pdf, 2009.
ACPD
9, 13327–13354, 2009Sensitivity of polar stratospheric ozone
loss
S. R. Kawa et al.
Title Page
Abstract Introduction
Conclusions References
Tables Figures
◭ ◮
◭ ◮
Back Close
Full Screen / Esc
Printer-friendly Version
Interactive Discussion
ClOOCl in the stratosphere: The coupling of ClOOCl and ClO in the Arctic polar vortex, J. Geophys. Res., 109, D03301, doi:10.1029/2003JD003811, 2004.
Stolarski, R. S., Butler, D. M., and Rundel, R. D.: Uncertainty propagation in a stratospheric model 2. Monte Carlo analysis of imprecisions due to reaction rates, J. Geophys. Res., 83, 3074–3078, 1978.
5
Stolarski, R. S. and Douglass, A. R.: Sensitivity of an atmospheric photochemistry model to chlorine perturbations including consideration of uncertainty propagation, J. Geophys. Res., 91, 7853–7864, 1986.
von Hobe, M., Salawitch, R. J., Canty, T., Keller-Rudek, H., Moortgat, G. K., Grooß, J.-U., M ¨uller, R., and Stroh, F.: Understanding the kinetics of the ClO dimer cycle, Atmos. Chem.
10
Phys., 7, 3055–3069, 2007,
http://www.atmos-chem-phys.net/7/3055/2007/.
ACPD
9, 13327–13354, 2009Sensitivity of polar stratospheric ozone
loss
S. R. Kawa et al.
Title Page
Abstract Introduction
Conclusions References
Tables Figures
◭ ◮
◭ ◮
Back Close
Full Screen / Esc
Printer-friendly Version
Interactive Discussion
Table 1.First date of O3<0.1 ppmv.
# Reaction ∆t (days)
+1σ −1σ
(R2) Cl2O2+hν→Cl+ClO2 −5.04 6.04
(R3b) BrO+ClO→Br+ClOO −3.96 3.17 (R5) Br+O3→BrO+O2 −0.83 1.00 (R3a) BrO+ClO→BrCl+O2 −0.92 0.75 (R3c) BrO+ClO→Br+OClO 0.71 −0.17 (R1) ClO+ClO+M→Cl2O2+M −0.17 0.12 ClO+OH→HCl+O2 0.79 0.00 Br+H2CO→HBr+HCO 0.12 −0.08
ACPD
9, 13327–13354, 2009Sensitivity of polar stratospheric ozone
loss
S. R. Kawa et al.
Title Page
Abstract Introduction
Conclusions References
Tables Figures
◭ ◮
◭ ◮
Back Close
Full Screen / Esc
Printer-friendly Version
Interactive Discussion
Fig. 1. Calculated O3 as a function of time along the trajectory for simulations using each of the 1000 Monte Carlo reaction rate sets. The base case using nominal JPL06 rate recommen-dations is shown by the red curve. The solid and dashed blue lines are the mean and mean
ACPD
9, 13327–13354, 2009Sensitivity of polar stratospheric ozone
loss
S. R. Kawa et al.
Title Page
Abstract Introduction
Conclusions References
Tables Figures
◭ ◮
◭ ◮
Back Close
Full Screen / Esc
Printer-friendly Version
Interactive Discussion
Day of the year 2000
Ozone Loss Rate
(ppbv/sunlit hour)
0
5
10
0
30
60
90
Arctic
θ = 500 K
ACPD
9, 13327–13354, 2009Sensitivity of polar stratospheric ozone
loss
S. R. Kawa et al.
Title Page
Abstract Introduction
Conclusions References
Tables Figures
◭ ◮
◭ ◮
Back Close
Full Screen / Esc
Printer-friendly Version
Interactive Discussion
220 240 260 280 300
Time (day of year) 0
1 2 3
O3
(ppmv)
Aug Sep Oct
Ensemble Mean Base Case/JPL06
95% Limits
JPL06
Pope et al.
(a)
0.0 0.5 1.0 1.5 2.0 2.5 3.0
O3 (ppmv)
0.00 0.05 0.10 0.15 0.20 0.25
Fraction of Cases
N= 1000
JPL06 Pope et al.
(b) Day250
Fig. 3. O3 loss calculations with uncertainty inJCl2O2 constrained to a factor of 1.5. (a) Gray
shaded areas encompass the median 95% of O3 mixing ratio values from the scenario distri-bution on each day for the JPL06 and Pope et al. cases. Red lines are the calculations using the nominal rates from JPL06 and JPL06 with Pope et al. cross sections substituted forJCl2O2.
ACPD
9, 13327–13354, 2009Sensitivity of polar stratospheric ozone
loss
S. R. Kawa et al.
Title Page
Abstract Introduction
Conclusions References
Tables Figures
◭ ◮
◭ ◮
Back Close
Full Screen / Esc
Printer-friendly Version
Interactive Discussion
220 240 260 280 300
Time (day of year) 0
1 2 3
O3
(ppmv)
Aug Sep Oct
MLS Average: 2005 - 2007
JPL06
Pope et al.
(a)
220 240 260 280 300
Time (day of year) 0.0
0.5 1.0 1.5 2.0 2.5 3.0
HCl (ppbv)
(b)
ACPD
9, 13327–13354, 2009Sensitivity of polar stratospheric ozone
loss
S. R. Kawa et al.
Title Page
Abstract Introduction
Conclusions References
Tables Figures
◭ ◮
◭ ◮
Back Close
Full Screen / Esc
Printer-friendly Version
Interactive Discussion
220 240 260 280 300
Time (day of year) 0
1 2 3
O3
(ppmv)
Aug Sep Oct
Fig. 5. South Pole (90◦S, solid blue curve) and McMurdo (77.5◦S, dashed blue curve) sonde
ACPD
9, 13327–13354, 2009Sensitivity of polar stratospheric ozone
loss
S. R. Kawa et al.
Title Page
Abstract Introduction
Conclusions References
Tables Figures
◭ ◮
◭ ◮
Back Close
Full Screen / Esc
Printer-friendly Version
Interactive Discussion
JBurkholder
JJPL06
JHuder&DeMoore
JPope
Ozone loss
rate [ppbv
/ day]
JClOOClrelative to JPL06
30
20
10
0
0 0.5 1.0 1.5
Fig. 6. Comparison of overall Match observed O3 loss rate in early February 2000 (green
line; green shading is 1σ uncertainty) with model calculations using four different evaluations for Cl2O2 photolysis cross sections. Red curve is fit to results of chemical calculations along Match trajectories. Model active chlorine abundances are constrained by measurements from SOLVE flight on 2 February 2000. Red error bars are uncertainties in calculated O3loss rates resulting from propagating the uncertainty in inferring the amount of activated Cl for through the model. Light red lines very close to the center red line reflect uncertainties from propagating uncertainties in the rate constant for the ClO self reaction and the ClOOCl equilibrium constant through the model. Gray shaded area denotes range ofJCl
2O2 values, relative to JPL06, that