ABSTRACT: The goal of this study is twofold. The irst one is to assess the applicability of approaches based on dynamic-mechanical analysis to investigate the viscoelastic properties of a self-adhesive synthetic rubber. The second goal is to identify the parameters of a viscoelastic model which accurately represents the frequency-dependent mechanical properties. For that purpose, the time-temperature superposition principle is successfully applied to build the master curves of the material up to 1 MHz. The thickness of the samples and the thermal expansion effects are found to have a negligible inluence on the mechanical properties measured by dynamic-mechanical analysis. The parameters of a generalized Maxwell model and a fractional derivative model are identiied from the obtained master curves and lead to an accurate representation of the frequency-dependent mechanical properties of the rubber.
KEYWORDS: Dynamic mechanical analysis, Viscoelastic material, Generalized Maxwell model, Fractional derivative model.
Characterization and Modeling of the
Viscoelastic Behavior of a Self-Adhesive Rubber
Using Dynamic Mechanical Analysis Tests
Lucie Rouleau1, Rogério Pirk1,2, Bert Pluymers1, Wim Desmet1
INTRODUCTION
Structural vibration reduction is a fundamental concern in several industries to avoid failure due to mechanical fatigue, to comply with increasingly stringent Noise, Vibration and Harshness (NVH) standards, or to ensure optimal operating conditions for on-board electronics. here are several methods that may be used in order to control vibrations (Nakra, 1998), which can be divided in two categories: active and passive damping treatments. he former rely on the efect of active mechanisms, using for example piezoelectric actuators, while the latter takes advantage of the inherent energy dissipation efects of systems, using for example viscoelastic materials (VEM).
Passive damping treatments based on VEM have been widely used in a variety of industrial applications and especially in aircrat and automotive systems (Rao, 2003). Since their molecular structure allows the internal dissipation of part of the vibration energy (Ferry, 1980), VEM are usually applied on the surface of vibrating structures, as a constrained or unconstrained layer of material. Some add-on passive damping treatments are available commercially in the form of self-adhesive constrained layers, which ofer the advantage of introducing damping with a minimum mass addition, while also being easily applied to structures with complex geometries.
he characterization and modeling of VEM mechanical properties are essential in the design and analysis of damped structures, to provide solutions with adequate damping properties. However, the VEM material properties depend on many factors,
1.Katholieke Universiteit Leuven – Department of Mechanical Engineering – Heverlee – Belgium. 2.Departamento de Ciência e Tecnologia Aeroespacial – Instituto de Aeronáutica e Espaço – São José dos Campos/SP – Brazil.
Author for correspondence: Lucie Rouleau | Cnam Paris – Structural Mechanics and Coupled Systems Laboratory | 2 rue Conté, 75003 | Paris – France Email: [email protected]
such as temperature, excitation frequency, amplitude, pre-stress or relative humidity (Sjöberg, 2002; Kergourlay, 2004). Temperature and frequency being the most relevant factors, it is indispensable to determine the material properties over the range of operational temperatures and frequencies.
Various existing techniques are available in the literature to characterize VEM as a function of temperature and frequency and are reviewed, among others, in Lakes (2004). Among them, dynamical mechanical analysis (DMA) is one of the most common and standard methods used to measure the dynamic properties of VEM (ASTM D4065-12; Menard, 2008). In this method, the response of VEM samples to a sinusoidal excitation at diferent frequencies and temperatures is measured. he dynamic properties over a wide frequency range are then extrapolated by means of the time-temperature superposition principle (TTSP). his method has been successfully applied to the characterization of many polymers (Ferry, 1980; Emri, 2005; Dealy and Plazek, 2009). However, for some materials such as polymeric blends (Van Gurp and Palmen, 1998) or polymers with long chain branching (Hatzikiriakos, 2000), the TTSP may not be applicable anymore. Moreover, in the case of adhesive polymers, the nonlinearity of the adhesive behavior may have an inluence on the mechanical properties measured by DMA, as evidenced in García-Barruetabeña et al. (2011). hese observations motivate this study, of which the irst goal is to assess the applicability of the DMA-based approach to investigate the viscoelastic properties of a self-adhesive synthetic rubber. In particular, since self-adhesive materials (also called pressure-sensitive adhesives) are a type of polymer blends (Creton, 2003), both the applicability of the TTSP and the nonlinearity of the adhesive behavior should be studied.
Once the frequency-dependent properties of the VEM are determined, one needs to model viscoelasticity in order to obtain accurate results using inite element models and thus assess the performance of the passive damping treatment. Several models exist in the literature to describe the viscoelastic behavior of VEM (Bert, 1973; Vasques et al., 2010). The capacity of a viscoelastic model to represent the frequency-dependent mechanical properties depends on the material. For instance, a fractional derivative model may lead to a good it of the viscoelastic properties of some polymers (Pritz, 2003), but a poor one for others (Corn et al., 2009). The second goal is then to identify the parameters of a viscoelastic model which accurately represents the frequency-dependent mechanical properties. In this study, two viscoelastic models
are investigated: the generalized Maxwell model and the fractional derivative model.
THEORY OF LINEAR VISCOELASTICITY
Considering an isotropic viscoelastic material under small isothermal and small deformation conditions, the theory of linear viscoelasticity assumes the existence of a constitutive relation between stress and strain histories, which for a one-dimensional system is given by a convolution integral (Christensen, 1982):
where σ (t) and ε (t): respectively, the stress and strain at a given time t; E (t): stress relaxation modulus.
A convenient way of representing the viscoelastic behavior in the frequency domain is through the complex modulus approximation. Let us assume a stationary harmonic strain ε (t):
and a stationary harmonic stress σ (t):
where i : imaginary unit, deined by its property i2 = –1; σ 0 and
ε0: respectively, the stress and strain amplitudes; ω: excitation frequency; φ: phase delay between the stress and strain.
he constitutive equation linking stress and strain in the frequency domain is given by:
where the complex modulus E*(ω) can be written as:
where Eʹ(ω): storage modulus; Eʹʹ(ω): loss factor. he loss factor η(ω) = Eʹʹ(ω)/E
ʹ
(ω) is a measure of the energy dissipated in the material, expressed in terms of recoverable energy. he storage and loss moduli, as well as the loss factor, are related to the phase and amplitude diferences between stress and strain:(1)
(2)
(5) (3)
(4) t
-∞
σ (
t
) = ʃ
E
(
t
-τ)ε(
t
)
d
τ
0 iωt
σ (
t
) = σ e
0 i(ωt + φ)
σ (ω) = E
*(
ω
)
ε
(
ω
)
E
*(
ω
) =
Eʹ
(
ω
) + i
Eʹʹ
(
ω
) =
Eʹ
(
ω
)[1 + i
η
(
ω
)]
herefore, by measuring the time response of a sample of material to an imposed strain, DMA testing allows the measurement of the complex modulus deined in Eq. 5. However, the measurements which can be performed on most commercial DMA equipment are limited to the low-frequency domain (typically up to a few hundred Hz). In order to characterize the material on a broader frequency range, the TTSP is applied (Ferry, 1980). his principle relates the material response at a given time t (or frequency ω) and at a given temperature T to that at other conditions (denoted by subscript r):
frequency range on which the material properties are known. However, the TTSP holds only for materials which are called thermo-rheologically simple (Dealy and Plazek, 2009). The Black diagram (Van Gurp and Palmen 1998) (plot of the phase
angle versus the amplitude of the complex modulus) and the
Cole-Cole diagram (Han and Kim, 1993) (plot of the storage
modulus versus the loss modulus) are two indicators commonly
used to assess the applicability of the TTSP.
METHODS
DYNAMICAL MECHANICAL ANALYSIS EXPERIMENTS
The material studied is a self-adhesive synthetic rubber (SR) from an automotive TIER supplier. Measurements of where aT(T, Tr )and bT(T, Tr): coeicients which indicate
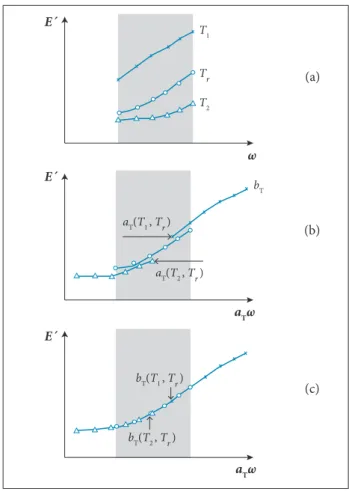
the amount of horizontal and vertical shiting (respectively) to be applied to isotherms of storage and loss moduli measured at a temperature T in order to estimate the material properties at a reference temperature Tr (see Fig. 1).
The horizontal shift factors aT(T, Tr ) describe the temperature dependence of the relaxation time and usually follow the empirical Williams-Landel-Ferry (WLF) equation (Williams et al., 1955):
Figure 1. TTSP. (a) Isotherms of storage modulus on the frequency range measurable by DMA, at temperatures T
1,
T
2 and Tr, with T1 < Tr < T2; (b) Isotherms of storage modulus
after application of the horizontal shift factors, taking T
r as
the reference temperature; (c) Isotherms of storage modulus after application of both horizontal and vertical shift factors, taking T
r as the reference temperature.
where C1 and C2: empirical constants whose order of
magnitude is about 10 and 100 K, respectively.
The vertical shift factors bT(T, Tr) are related to thermal expansion effects, which for most polymers can be neglected. In that case, only horizontal shift factors are applied.
It is clear from Fig. 1 that by performing measurements at different temperatures, the TTSP allows to extend the
(6a)
(a)
(b)
(c) (6b)
(6c)
(7a)
(7b)
(7c)
(8)
η
(
ω
) = tan [
φ
(
ω
)]
ω
r=
a
T(
T, T
r)
ω
Eʹ
(
ω
r,
T
r) =
b
T(
T, T
r)
Eʹ
(
ω,
T
)
Eʹʹ
(
ω
r,
T
r) =
b
T(
T, T
r)
Eʹʹ
(
ω,
T
)
E
´(
ω
)
σ
0(
ω
)
cos[
φ(ω
)]
ε
0(
ω
)
E
´(
ω
) =
σ
0(
ω
)
sin[
φ(ω
)]
ε
0(
ω
)
´
log[
a
T(
T, T
r)] =
C
1(
T – T
r)
C
2+
T – T
rE´
E´
E´
T1
Tr
T2
bT
aT(T1 , Tr)
bT(T1 , Tr)
aT(T2 , Tr)
bT(T2 , Tr)
ω
a Tω
its frequency-dependent shear modulus are carried out on a DMA Q800 dynamical mechanical analyzer (produced by TA Instrument Corporation), available at the Department of Metallurgy and Material Engineering of Katholieke Universiteit of Leuven (see Fig. 2a). For that purpose, the testing coniguration is set in shear mode, i.e. two equal-size samples are sheared between a ixed and a moveable plate, as depicted in Fig. 2b. he lateral dimensions of the samples are 10 mm x 10 mm. When clamping the samples on the DMA, a compressive pre-strain
γ0~ 10% is applied in order to ensure a good adhesion between the samples and the clamps.
In order to study the linearity of the adhesive behavior, samples of diferent thicknesses (1.5 and 2.2 mm) are tested. he linearity of the viscoelastic behavior was studied for both samples by inducing a dynamic displacement varying from 1 to 10 μm, at a reference temperature of 20°C and a reference frequency of excitation of 100 Hz.
he dynamic behavior of the self-adhesive rubber is then studied by performing a multi-frequency test with temperature
ramp. he glass transition temperature was estimated at -60°C by Differential Scan Calorimetry (DSC) on Q2000 DSC equipment (produced by TA Instrument Corporation) from the Department of Chemical Engineering of Katholieke Universiteit of Leuven. Considering the rheological characteristics of the tested material and the operational bands of DMA Q800, 15 frequency sampling points ranging from 1 to 200 Hz are selected, and the temperature ramp is done at a heating rate of 2°C/min from –70°C to 40°C. A dynamic displacement of 10 μm is applied to the samples.
APPLICATION OF THE TIME-TEMPERATURE SUPERPOSITION PRINCIPLE
he TTSP consists in applying shit factors to isotherms in order to build the master curves of the material which represent the dynamic complex modulus as a function of frequency. Once the validity of the TTSP is checked, the master curves are built by using the method described in (Rouleau et al.
2013). his method aims at determining both horizontal and vertical shit factors to be applied to isotherms by means of a least square method which requires the fulillment of the Kramers-Kronig relations. In this way, the master curves are built in accordance with the causality principle, while also accounting for possible thermal expansion efects.
his methodology is applied to at least two samples of each dimension (1.5 and 2.2 mm), to comply with standard norms (ISO, 1996).
RESULTS AND DISCUSSION
LINEARITY OF THE BEHAVIOR
While varying the dynamic displacement applied to samples, no variation of the measured modulus is observed, conirming the assumption of linear viscoelasticity. Following this result, a dynamic displacement of 10 μm is considered for the remainder of the study.
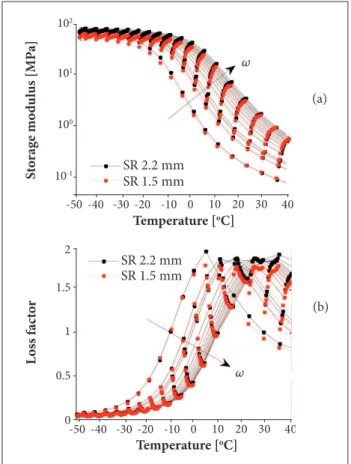
The storage modulus and loss factor measured for two samples of different thicknesses are plotted against temperature at different frequencies in Fig. 3. It can be noted that the storage modulus of the 2.2 mm thick sample is slightly higher than that of the other sample, at very low temperatures (below –30°C). A higher peak of loss factor is also observed for the 2.2 mm thick sample (about 5% higher than for the 1.5 mm thick sample). However, considering the inherent dispersion expected for this type of measurements, Figure 2. (a) Synthetic rubber samples installed on the DMA
Q800 in shear test coniguration. (b) Scheme of the test coniguration: two equal-size material samples, of thickness h,
are sheared between a ixed and an oscillating clamp. A compressive pre-strain γ0 is applied during clamping to ensure a good adhesion between the clamps and the samples.
Fixed clamps
10 mm 10 mm
ε(t)
(1 – γ0)h
the influence of the sample thickness can be neglected (see the next section).
In Fig. 3, two regions of viscoelastic behavior can be identiied. he irst one is the glassy region, corresponding to low temperature (below –30°C), where the storage modulus is roughly constant and the loss factor is close to zero. In this region, the material has an elastic behavior. he second region is the glass transition region, for temperatures above –30°C, where the dynamic modulus undergoes strong variations with frequency and temperatures. his is the region of interest for damping applications since it is characterized by a peak of loss factor. herefore, only the measurement points within the temperature range [–30°C, 30°C] are considered for the application of the TTSP.
VALIDITY OF THE TIME-TEMPERATURE SUPERPOSITION PRINCIPLE
he validity of the TTSP is checked by means of the Cole-Cole diagram, shown in Fig. 4a, and the Black diagram, shown
Figure 4. (a) Cole-Cole diagram: loss modulus G’’ versus
storage modulus G‘. (b) Black diagram: loss factor ηversus the
modulus’ amplitude |G*| for a 2.2 mm thick material sample. (b)
(a)
(a)
(b) Figure 3. Dynamic modulus variation with temperature at
frequencies from 1 to 200 Hz for 1.5 and 2.2 mm thick samples. (a) Storage modulus. (b) Loss factor.
in Fig. 4b. he G’ versus G’’ and η versus |G*| curves in double logarithmic scales at diferent temperatures coincide in one continuous curve for most points, thus meeting the assumption of a thermo-rheologically simple material. Points that deviate from the curves correspond to measurements above 60 Hz. Since they may be related to resonance phenomena in the DMA (Placet and Foltête, 2010), they are removed.
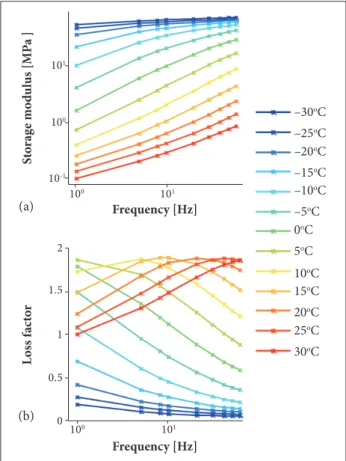
Figure 5 shows the isotherms corresponding to the 2.2 mm thick sample which are used for the application of the TTSP. hey are obtained by carrying out a polynomial curve itting of the measured isochrones (shown in Fig. 3).
he horizontal and vertical shit factors applied to isotherms of Fig. 5 are plotted against temperature in Fig. 6. It can be noted that the vertical shit coeicients are very close to unity, which implies that thermal expansion efects can be neglected. he horizontal shit factors aT are itted by the WLF equation (Eq. 8): the parameters C1 = 9.23 and C2 = 141.2 K are found to lead to a very good it. hose values are in accordance with previous studies, which give conidence in the built master curves.
Temperature [oC]
Temperature [oC]
L
oss f
ac
to
r
S
to
rage mo
d
u
lus [MP
a]
SR 2.2 mm
ω
SR 1.5 mm SR 2.2 mm SR 1.5 mm
-50 -40 -30 -20 -10 0 0
0.5 1 1.5 10-1
100
101
102
2
10 20 30 40 -50 -40 -30 -20 -10 0 10 20 30 40
ω
Modulus’ amplitude [MPa] Storafe modulus [MPa]
L
oss f
ac
to
r
L
oss mo
d
u
les [MP
a ]
100
100
101
10-1
10-1
100
101
100
–30oC
–25oC
–20oC
–15oC
–10oC
–5oC
–0oC
5oC
10oC
15oC
20oC
25oC
Figure 7. Master curves of the self-adhesive synthetic rubber at a reference temperature of 20°C obtained from DMA measurements of 5 samples of different thicknesses. Figure 6. Horizontal and vertical shift factors log(a
T) and log(b
T) applied to the isotherms of Fig. 5. The horizontal shift coeficients are itted by the WLF equation (Eq. 8).
Temperature [oC]
S hift c o effi ci en ts lo g ( aT ) a nd l o g ( bT )
Optimised aT
Optimised bT WLF fit of optimised aT
-30 -20 -10 0
-2 0 2 4 6
10 20 30
Frequency [Hz] Frequency [Hz] L oss f ac to r S to rage mo d u lus [MP
a] 102
100
100 102 104 106
100 102 104 106
10-2 0 0.5 1 2 1.5
SR 2.2 mm SR 2.2 mm
SR 1.5 mm SR 1.5 mm SR 1.5 mm
he master curves obtained from the application of the TTSP at a reference temperature of 20°C for all the tested samples are given in Fig. 7. Little dispersion is observed in the mechanical properties of the material. he peak of loss factor appears around 20 – 30 Hz, so this material should be used for damping low-frequency vibrations.
Figure 5. Isotherms of (a) storage modulus and (b) loss factor for a 2.2 mm thick material sample.
VISCOELASTIC MODELS
Generalized Maxwell Model
In the Maxwell model, springs and dashpots are used to describe the elastic and viscous components of the stress/strain response of a viscoelastic material. he generalized Maxwell model is comprised of several Maxwell elements in parallel, and the corresponding complex modulus representation is:
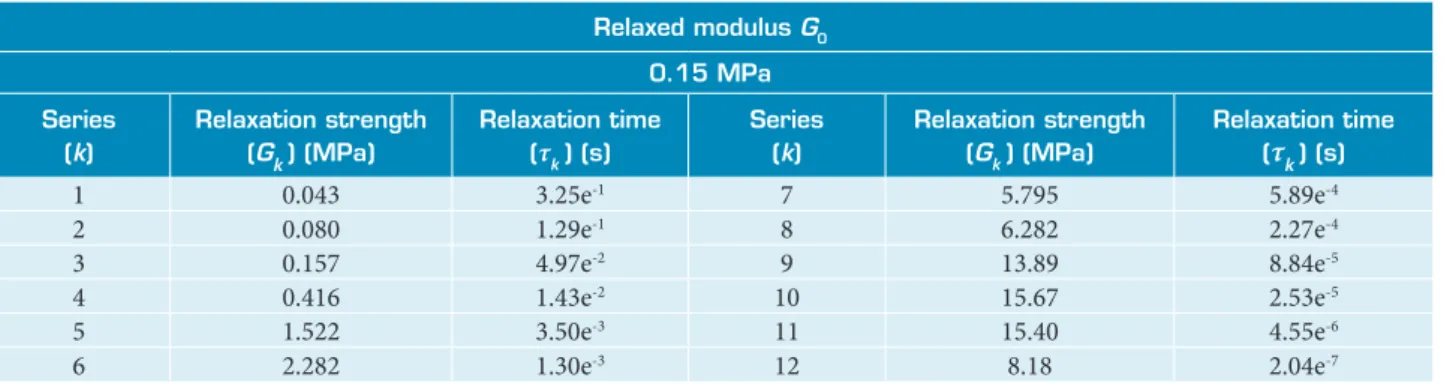
where G0: relaxed modulus, i.e. G0 = G* (ω); m: num- ber of Maxwell components; Gk and τk : respectively, the relaxation strength and relaxation time of the kth Maxwell component.
he parameters of a generalized Maxwell model are identiied from the master curves obtained for a SR sample of 2.2 mm thickness. he enclosing curve technique (Vinh, 1967; Renaud
et al., 2011), a graphical technique based on the Pole-Zero
formulation of the generalized Maxwell model, is used for that purpose. Twelve Maxwell components are found to lead to a good it of the frequency-dependent shear modulus of the SR, as shown in Fig. 8. Since the graphical identiication method uses only the characteristics of the modulus’ amplitude, the modeling of the phase is less accurate, but still reasonable. he identiied parameters are given in Table 1.
Frequency [Hz] Frequency [Hz] L oss f ac to r S to rage mo d u lus [MP a ] 100
100 101
101 0 0.5 1 10-1 100 101 2 1.5
–30oC
–25oC –20oC –15oC –10oC –5oC 0oC
5oC
10oC 15oC 20oC 25oC 30oC
(b) (a)
(9)
ωlim → 0
G*(ω) = G0 + Σ Gk m= 1 k iωτk
Figure 8. Master curves of the self-adhesive synthetic rubber (2.2 mm sample) at a reference temperature of 20°C itted by a generalized Maxwell model.
Relaxed modulus G 0
0.15 MPa
Series (k)
Relaxation strength (G
k) (MPa)
Relaxation time (τk ) (s)
Series (k)
Relaxation strength (Gk ) (MPa)
Relaxation time (τ
k) (s)
1 0.043 3.25e-1 7 5.795 5.89e-4
2 0.080 1.29e-1 8 6.282 2.27e-4
3 0.157 4.97e-2 9 13.89 8.84e-5
4 0.416 1.43e-2 10 15.67 2.53e-5
5 1.522 3.50e-3 11 15.40 4.55e-6
6 2.282 1.30e-3 12 8.18 2.04e-7
Table 1. Parameters of the generalized Maxwell model identiied by the enclosing curve technique.
Relaxed modulus (G
0) (Pa)
Unrelaxed modulus (G
∞) (Pa)
Relaxation time (ρ) (s)
Order of derivation (α)
8.59e4 5.34e7 1.0e-4 0.72
Table 2. Parameters of the fractional derivative model identiied by the least square method.
Figure 9. Master curves of the self-adhesive synthetic rubber (2.2 mm sample) at a reference temperature of 20°C itted by a fractional derivative model.
Frequency [Hz]
Frequency [Hz]
L
oss f
ac
to
r
S
to
rage mo
d
u
lus [MP
a] 102
100
100 102 104 106
100 102 104 106
10-2
0 0.5 1 2
1.5
Experimental data Generalized Maxwell model
Frequency [Hz]
Frequency [Hz]
L
oss f
ac
to
r
S
to
rage mo
d
u
lus [MP
a] 102
100
100 102 104 106
100 102 104 106
10-2
0 0.5 1 2
1.5
Experimental data Fractional derivative model Fractional Derivative Model
The fractional derivative model used in this study is a Maxwell model where the dashpot is replaced by a spring-pot element. The corresponding complex modulus represen-tation is:
where G∞: unrelaxed modulus, i.e. G
∞= G* (ω);
τ
: relaxation time; α: order of derivation which is related tointernal relaxation processes.
he four parameters constituting the fractional derivative model are identiied from the master curves of a 2.2 mm thick material sample, by using a least square method. he identiied parameters are listed in Table 2. Good correlation is obtained between the experimental master curves and the model, as shown in Fig. 9. (10)
ω → lim
∞
G* (ω) = G0 + (G∞ – G0)
(iωτ)α [1 + (iωτ)α
CONCLUSION
The viscoelastic behavior of a self-adhesive synthetic rubber, used in automotive applications, is investigated in this study by means of DMA measurements. It is found that the mechanical properties identified by this method are not influenced by the thickness of the sample tested. The viscoelastic material is proven as thermo-rheologically simple, and the TTSP is successfully applied to build master curves up to 1 MHz. The analysis of the horizontal and vertical shift factors determined when applying the TTSP shows that the thermal expansion effects can be neglected. Pre-strain effect has not been studied here and may require
further investigation since in Martinez-Agirre et al. (2014) it
was found to have an influence on the mechanical properties measured by DMA.
Following the obtaining of the material’s master curves, two viscoelastic models are identiied: a generalized Maxwell model, classically used to model viscoelastic materials in industrial sotware, and a fractional derivative model, which relies on only four parameters. Both models allow an accurate representation of the frequency-dependent properties of the material. The parameters identiied can then be used as inputs in inite element calculations to optimize the NVH performance of damped systems.
ACKNOWLEDGEMENTS
he IWT Flanders within the ASTRA project and the European Project INTERACTIVE Marie Curie Initial IAPP are gratefully acknowledged for their support. he Brazilian Program Ciência sem Fronteiras is also acknowledged by the second author.
REFERENCES
Rouleau, L., Deü, J.-F., Legay, A. and Le Lay, F., 2013, “Application of the Kramers-Kronig Relations to Time-Temperature Superposition for Viscoelastic Materials”, Mechanics of Materials, Vol. 65, pp. 66-75. doi: 10.1016/j.mechmat.2013.06.001
Bert, C.W., 1973, “Material Damping: an Introductory Review of Mathematical Measures and Experimental Techniques”, Journal of Sound and Vibration, Vol. 29, No. 2, pp. 129-153. doi: 10.1016/ S0022-460X(73)80131-2
Christensen, R.M., 1982, “Theory of Viscoelasticity”, Dover Publications, Mineola, USA.
Corn, S., Ienny, P., Dupuy, J.S. and Daridon, L., 2009, “Identiication des Propriétés Viscoélastiques d’un PMMA par Analyse Vibratoire: Comparaison entre Différentes Méthodes Expérimentales”, Proceedings of the 19ème Congrès Français de Mécanique, Marseille, France.
Creton, C., 2003, “Pressure-Sensitive Adhesives: an Introductory Course”, Material Research Society Bulletin, Vol. 28, No. 6, pp. 434-439. doi: 10.1557/mrs2003.124
Dealy, J. and Plazek, D., 2009, “Time-Temperature Superposition – a User’s Guide”, Rheology Bulletin, Vol. 78, pp. 16-31.
Emri, I., 2005, “Rheology of Solid Polymers”, Rheology Reviews, Vol. 3, pp. 49-100.
Ferry, J.D., 1980, “Viscoelastic Properties of Polymers”, John Wiley & Sons, New Jersey, USA.
García-Barruetabeña, J., Cortés, F., Abete, J.M., Fernández, P., Lamela, M.J. and Fernández-Canteli, A., 2011, “Experimental Characterization and Modelization of the Relaxation and Complex Moduli of a Flexible Adhesive”, Materials and Design, Vol. 32, No. 5, pp. 2783-2796. doi: 10.1016/j.matdes.2011.01.005
Han, C.D. and Kim, J.K., 1993, “On the Use of Time-Temperature Superposition in Multicomponent/Multiphase Polymer Systems”,
Polymer, Vol. 34, No. 12, pp. 2533-2539. doi:10.1016/0032-3861(93)90585-X
Hatzikiriakos, S., 2000, “Long Chain Branching and Polydiversity Effects on the Rheological Properties of Polyethylenes”, Polymer Engineering and Science, Vol. 40, No. 11, pp. 2279-2287. doi: 10.1002/pen.11360
Kergourlay, G., 2004, “Mesure et Prediction Vibro-Acoustique de Structures Viscoélastiques. Application à une Enceinte Acoustique”, Ph.D. Thesis, École Centrale de Paris, Paris, France.
Lakes, R., 2004, “Viscoelastic Measurement Techniques”, Review of Scientiic Instruments, Vol. 75, No. 4, pp. 797-810. doi: 10.1063/1.1651639
Martinez-Agirre, M., Illescas, S., and Elejabarrieta, M.J., 2014, “Characterisation and Modelling of Prestrained Viscoelastic Films”, International Journal of Adhesion and Adhesives, Vol. 50, pp. 183-190. doi: 10.1016/j.ijadhadh.2014.01.029
Menard, K.P., 2008, “Dynamic Mechanical Analysis: a Practical Introduction”, CRC Press, Boca Raton, USA.
Nakra, B., 1998, “Vibration Control in Machines and Structures Using Viscoelastic Damping”, Journal of Sound and Vibration, Vol. 211, No. 3, pp. 449-466. doi: 10.1006/jsvi.1997.1317
Placet, V. and Foltête, E., 2010, “Is Dynamic Mechanical Analysis (DMA) a Non-Resonance Technique?”, EPJ Web of Conference, Vol. 6, pp. 41004. doi: 10.1051/epjconf/20100641004
Pritz, T., 2003, “Five-Parameter Fractional Derivative Model for Polymeric Damping Materials”, Journal of Sound and Vibration, Vol. 265, No. 5, pp. 935-952. doi: 10.1016/S0022-460X(02)01530-4
Renaud, F., Dion, J.-L., Chevallier, G., Tawiq, I. and Lemaire, R., 2011, “A New Identiication Method of Viscoelastic Behavior: Application to the Generalized Maxwell Model”, Mechanical Systems and Signal Processing, Vol. 25, No. 3, pp. 991-1010. doi: 10.1016/j.ymssp.2010.09.002
Sjöberg, M., 2002, “On Dynamic Properties of Rubber Isolators”, Ph.D. Thesis, Royal Institute of Technology (KTH), Stockholm, Sweden.
Van Gurp, M. and Palmen, J., 1998, “Time-Temperature Superposition for Polymeric Blends”, Rheology Bulletin, Vol. 67, No. 1, pp. 5-8.
Vasques, C., Moreira, R. and Rodrigues, J., 2010, “Viscoelastic
Damping Technologies – Part I: Modeling and Finite Element Implementation”, Journal of Advances Research in Mechanical Engineering, Vol. 1, No. 2, pp. 76-95.
Vinh, T., 1967, “Sur le Passage du Régime Harmonique au Régime Transitoire Viscoélastique”, Vol. 3, Mémorial de L’artillerie Française, Saint-Ouen, France.