www.ann-geophys.net/26/1617/2008/ © European Geosciences Union 2008
Annales
Geophysicae
A physical mechanism producing suprathermal populations and
initiating substorms in the Earth’s magnetotail
D. V. Sarafopoulos
Department of Electrical and Computer Engineering, Democritus University of Thrace, Xanthi, Greece Received: 1 March 2007 – Revised: 17 March 2008 – Accepted: 16 April 2008 – Published: 11 June 2008
Abstract. We suggest a candidate physical mechanism, combining there dimensional structure and temporal devel-opment, which is potentially able to produce suprathermal populations and cross-tail current disruptions in the Earth’s plasma sheet. At the core of the proposed process is the “akis” structure; in a thin current sheet (TCS) the stretched (tail-like) magnetic field lines locally terminate into a sharp tip around the tail midplane. At this sharp tip of the TCS, ions become non-adiabatic, while a percentage of electrons are accumulated and trapped: The strong and transient electro-static electric fields established along the magnetic field lines produce suprathermal populations. In parallel, the tip struc-ture is associated with field aligned and mutually attracted parallel filamentary currents which progressively become more intense and inevitably the structure collapses, and so does the local TCS. The mechanism is observationally based on elementary, almost autonomous and spatiotemporal en-tities that correspond each to a local thinning/dipolarization pair having duration of∼1 min. Energetic proton and elec-tron populations do not occur simultaneously, and we infer that they are separately accelerated at local thinnings and dipolarizations, respectively. In one example energetic par-ticles are accelerated without anydB/dtvariation and before the substorm expansion phase onset. A particular effort is un-dertaken demonstrating that the proposed acceleration mech-anism may explain the plasma sheet ratioTi/Te≈7. All our
inferences are checked by the highest resolution datasets ob-tained by the Geotail Energetic Particles and Ion Composi-tion (EPIC) instrument. The energetic particles are used as the best diagnostics for the accelerating source. Near Earth (X≈10RE) selected events support our basic concept. The
proposed mechanism seems to reveal a fundamental build-ing block of the substorm phenomenon and may be the basic process/structure, which is now missing, that might help ex-Correspondence to:D. V. Sarafopoulos
plain the persistent, outstanding deficiencies in our physical description of magnetospheric substorms. The mechanism is tested, checked, and found consistent with substorm as-sociated observations performed∼30 and 60RE away from
Earth.
Keywords. Magnetospheric physics (Magnetospheric con-figuration and dynamics; Plasma sheet) – Space plasma physics (Charged particle motion and acceleration)
1 Introduction
At the start of this paper we want to state that our primary intent and motivation in this work was and remains neither to be involved in a longstanding contradiction justifying one side, nor to resolve the contradiction itself being the “where, how and when” a substorm initiates. This work came about, rather, as an effort to check whether a well known funda-mental concept was at work in the magnetotail dynamics. It is known from electrostatics that the surface charge densi-ties are greatest at sharp tips of conductor, and so the local electric field strength actually produce an increased charge accumulation at the sharp tip part (i.e. the very low curvature region) of an already stretched magnetic field line? Might a negatively charged sharp tip be the ultimate substorm trig-gering mechanism? Is there a capability for a sharp tip to produce suprathermal populations in the Earth’s magneto-sphere?
1618 D. V. Sarafopoulos: A physical mechanism producing suprathermal populations energization in the turbulent fields of the plasma sheet,
ap-pears to be unresolved at present (Cowley, 1991; Heikkila, 2007).
We postulate that in the Earth’s magnetotail an instability must exist as the direct cause of substorms and that expan-sion waves, cross-tail current disruption, reconnection, parti-cle energization and other dynamic phenomena may well be the nonlinear effect, but not the cause, of the growth of an unstable mode. There have been several suggestions for such instability like the cross-field current instability (Lui et al., 1991), the ballooning instability model (Roux et al., 1991), and the tearing instability responsible for the onset of recon-nection (Schindler, 1974).
In this work, we propose a candidate physical mechanism that may potentially trigger substorms, producing suprather-mal populations. In parallel, we are interested in testing the mechanism using available energetic particle datasets. We require high time-resolution measurements for protons and electrons, in order to trace possible transient accelerating electric fields. In particular, this work is mainly based on the highest resolution data obtained by the Geotail/EPIC in-strument. Finally, we infer that our main suggestion is sup-ported observationally as no serious conflict is found. How-ever, these longstanding, multi-dimensional and open prob-lems need further work to be definitely resolved. We believe that this work indicates the right direction and gives a few decisive answers.
We shall elaborate our mechanism throughout this work: A close coupling and interaction between the in situ measure-ments and our basic concept is our chief concern. However, although many aspects of the work will be clarified in the course of the paper, a preliminary description of our concept is of primary importance, being at the same time somewhat arbitrary for the reader. We are especially focused on local (likely less than 1RE), short-lived (less than 1 min), and
usu-ally successive reconfigurations of the magnetic field accom-panied by high energetic particle populations. Fundamen-tal knowledge concerning the substorm phenomenon can be found in reviews like those of Lui (1996), Baker et al. (1996), Sergeev et al. (1996), Friedel et al. (1996), Lyons (1996), Birn and Schindler (1996), and Rostoker (1996). Briefly, the basic description of the proposed mechanism is as follows:
1. During the substorm growth phase the magnetotail is stretched to a tail-like topology: A thin current sheet (TCS) is developed.
2. The magnetic field lines locally form a “sharp tip”, or an “akis” structure around the tail midplane. “Akis” (i.e. κ`ις) is an ancient Greek word giving the best descrip-tion for stretched lines terminating into a point. 3. At the sharp tip the ions become non-adiabatic, and the
involved magnetic field lines are negatively charged. 4. A test electron particle close to the tip initially feels
an outward force greater than an inward. Hence,
elec-trons, with smaller gyroradii, are able to follow the field more closely and are accumulated and trapped in the tip structure, which may eventually accommodate ex-tremely high charge densities.
5. Strong electrostatic electric fields along the magnetic field lines are established producing suprathermal ions. 6. The tip inevitably collapses, since it progressively be-comes sharper driving higher current densities. These currents, along the magnetic field lines, are mutually at-tracted like parallel current filaments.
7. The collapsing tip structure is associated with the high-est local negative charge density, which can produce a strong-transient and earthward directed electric field in front of it. This field, potentially, can cause cross-tail current reduction or even disruption.
8. With the tip collapse termed as an “electron trap col-lapse”, the first escaping electrons may be highly ener-gized by the bulk electron population of tip. Certainly under this scenario the energized electrons ought to re-main essentially on the closed magnetic field lines. 9. In parallel, during the tip formation and the build up
of negative charge, ions are accelerated. It seems that essentially the same electrostatic field acts before and after the tip collapse and accelerates ions and electrons, respectively.
10. Successive pairs of local plasma sheet thin-nings/dipolarizations will energize ions and electrons in a repetitive mode.
We assume here that charged particles are distributed along a magnetic field line much like the static electric charges are distributed all over the surface of a conductor. Over a metal-lic surface, which is considered as an infinite conducting sur-face, the charge tends to accumulate at sharp points. The consequence is that at such points high surface charge den-sityps is measured, and the normal electric field strengthEn
can locally reach extremely high values,En=ps/ε. The
sur-face charge tries to spread out as much as possible over the surface and a protruding sharp point, by its very nature, is far-thest from most of the surface, and so charges are pushed to-ward it and, once there, are trapped. This phenomenon char-acterizes the corona and arc discharges, as well as the light-ning discharges (Plonus, 1978). Modern technology uses the same principle in satellite ion propulsion systems like the Field Emission Electric Propulsion-FEEP thruster (Maral and Bousquet, 2002), as well as in the “Scanning Tunneling Microscope-STM”.
since the ion inertial length is approximately 40 times larger than the electron inertial length (Nagai et al., 2001), ions will easily become unmagnetized at the tip and escape from the magnetic field line. The ion-electron decoupling can produce negatively charged magnetic field lines. The already formed tip further redistributes the negative charge and accumulates a large part of it on the tip. A strong “electrostatic” electric field develops along the magnetic field lines because the elec-trons basically remain magnetized. In turn, this electric field may play a vital role causing local current disruption (CD) or reconnection; that is, triggering a substorm at large.
With the hydromagnetic theorem of frozen-in magnetic flux the plasma is in motion but has negligible electrical re-sistance and there are no electric fields in the frame moving with the plasma. Thus, any component of the electric field parallel to the magnetic field must vanish and, in a steady state, the magnetic field lines could be considered equipoten-tials. Certainly near the sharp tip structure, in a scale length smaller than the ion gyro-radius, the MHD approximation should break down.
Basic energetic particle reviews are the Krimigis and Sar-ris (1980) and Lopez and Baker (1994). Energetic particle electron-proton counterstreaming activations were found by Sarris et al. (1976), and extensively studied by Sarafopoulos et al. (1984) and Sarafopoulos and Sarris (1987). The con-cept of repetitive activations throughout a substorm is well established in a work by Sarafopoulos and Sarris (1988): A substorm is composed of many energetic ion bursts, and each of them shows the inverse velocity dispersion feature (IVD), that is the lower energy particles arrive before the higher energy ones. They interpreted the IVD feature as resulting from the finite growth time of the accelerating source. An-other important aspect concerning the distribution of ener-getic particle fluxes within the plasma sheet is the dawn-dusk electron-proton asymmetry which was statistically studied by Sarafopoulos et al. (2001) using the Interball 56-energy channel spectra.
It is generally accepted that the subject of magnetosphere substorms is very complex, many issues remain quite con-troversial, and the amount of literature is huge. Many sub-storm models exist, but they may be broadly classified into two categories. One invokes processes in the near-Earth re-gion (X<15RE)or some feedback instabilities at the
iono-spheric altitudes. The other invokes mid-tail magnetic re-connection atX>15REto inject plasma earthward, with the
braking (i.e. slowing down) of this plasma flow (and mag-netic flux pileup under the MHD assumption) as the cause of near-Earth disturbances. The former, is usually referred as the near-Earth current disruption (NECD) model (Lui, 2001), while the latter is usually referred to as the near Earth neutral line (NENL) model that advocates the view of X-line forma-tion to initiate substorm expansion (Baker et al., 1996). It is inevitable that the just mentioned fundamental difference between the two viewpoints would find its way into our dis-cussion.
2 Observations
According to the statistical work of Lopez et al. (1989) there are rare events, in the near-Earth (<10RE)
magneto-tail, in which the magnetic field increases at the time of lo-cal substorm onset(1|B|>0). Representative examples in this category are the AMPTE satellite events on 28 August 1986, studied by Takahashi et al. (1987), and on 25 April 1985 studied by Lopez et al. (1989). Our extraordinary first event on 4 September 1997 falls in this category, which is characterized by intense north-south turnings of the mag-netic field indicating that transient currents in the vicinity of Geotail were strong enough to cancel the Earth’s dipole field. Additionally for all the above three mentioned cases dBz/dt∼=dB/dt, and the satellite is situated essentially at the
neutral sheet, which finally justifies why these events are not detected frequently. Analyzing our first event, we try to get an insight into the particles acceleration mechanism associ-ated with the longstanding question about the role ofdB/dt variations. We use data from the Geotail Energetic Parti-cles and Ion Composition (EPIC) instrument (Williams et al., 1994) with time resolution in time series which offer reli-able and high-resolution proton and electron measurements simultaneously. Every diagnosed differentiation between the electron and proton behaviour will be our best clue to trace the energization mechanism. The electron head measures fluxes with polar angles|θ|<30◦, and the two identical pro-ton heads receive fluxes with 9◦|θ|<38◦. We use the pro-ton differential fluxes from the energetic channels P2 (58– 77 keV), P3 (77–107 keV), P4 (107–154 keV) and P5 (154– 227 keV), and the electron integral fluxes for the channel ED1 (E≥38 keV). ED1 provides an eight sector angular dis-tribution every 3 s, while P2 provides a sixteen sector angular distribution every 6 s.
Three events in the near Earth region are considered abso-lutely necessary to convey the needed supplementary infor-mation concerning the energetic particle acceleration mech-anism. Then in order to demonstrate that there are some fundamental similarities between the near Earth activations and the mid- and distant-tail energetic particle responses, we add two more events-substorms that typify the regions atX=−30.56 and−64.2RE.
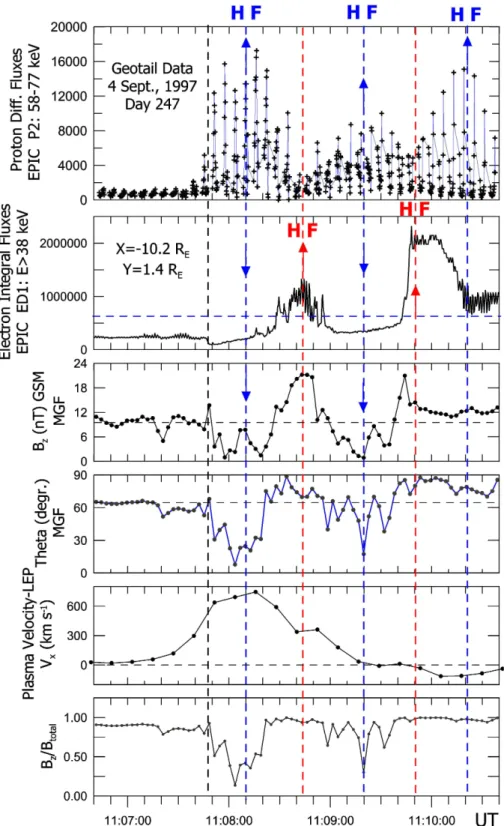
1620 D. V. Sarafopoulos: A physical mechanism producing suprathermal populations 2.1 First event on 4 September (day 247) 1997
In this case study we are focused on a short interval of four minutes extended from 11:06:40 to 11:10:40 UT of day 247, 1997 (Fig. 1), as it was seen by the Geotail satellite lo-cated at(X, Y, Z)GSM=(−10.23,−1.38, 1.08)RE, very near
the midnight meridian. It is obvious that the peak proton fluxes do not occur simultaneously with those of electrons. We pay attention to the two successive pairs of so called micro-thinning/expansion, or local thinning/expansion ge-ometries of the magnetic field. The two major local thin-nings (i.e. transient tail-like structures), which are identified by decreases in theBz and polar angleθtraces of the
mag-netic field (third and fourth panels, respectively), are centered around 11:08:05 and 11:09:20 UT. Each stretched topology of the magnetic field is followed by a local plasma sheet ex-pansion corresponding to a local dipolarization; terms used for instance by Lopez et al. (1989). These fluctuations are intense and the overall excursion1Bz is twice as much the
initial Bz magnitude. We emphasize the fact that the
ra-tioBz/Btotal is close to 1 (bottom panel) and, therefore, as
it is already stressed the event is extraordinary. Before the fluctuations the satellite was situated near the neutral sheet (Bx∼=−5 nT). The interval under study is part of an isolated
substorm, as it is evident from the sharp energetic particle injection seen by LANL 1990-095 and the AE index (not shown here). Moreover, this substorm event is included in other research studies (Lui, 2001).
Most importantly, the magnetic field fluctuations are tightly associated with energetic particle fluxes. The ener-getic proton differential fluxes (first panel, P2 channel: 58– 77 keV) essentially increase at local thinnings. In contrast, the energetic electron integral fluxes (second panel, ED1 channel: E>38 keV) mainly increase at local expansions. Therefore, Geotail detects a local injection of energetic par-ticles with the electron population being delayed by∼40 s. However, this delay is small in order to destroy the “dis-persionless” character of the injection: We mention that, for instance, Friedel et al. (1996), have classified as dispersion-less injections those having dispersion-less than 4 min dispersions, while Lopez et al. (1990) have compiled a catalog of 167 disper-sionless injections where the flux increase in any two of the channels was displaced by no more than 72-s.
We evaluate that the above detected different occurrence times between peak proton and peak electron fluxes is a ma-jor finding related to the fundamental magnetospheric dy-namics. The non-simultaneous production of protons and electrons is further emphasized in Fig. 1 using the abbrevi-ation HF (high fluxes) for the peak fluxes. Our interpreta-tion scheme is given latter on. It should be underlined that the Fig. 1 measurements are with the highest available reso-lution, which readily makes clear why the 58–77 keV ener-getic proton fluxes apparently show a periodicity of 6 s. The latter is due to the satellite spin period of 3 s: A complete an-gular distribution on the ecliptic plane is sampled every 3 s;
although one out of two angular distributions is transmitted through the telemetry subsystem. Therefore, the 3-s or 6-s periodicity in flux profile time series is an excellent indicator for the anisotropy of energetic particles; the presented proton profile shows a profound streaming character. Certainly, it must be underlined that we always pay attention to the en-velope of higher flux values. The ED1 channel of energetic electron fluxes provides an 8 sector angular distribution every 3 s.
At 11:07:50 UT the plasma sheet locally begins to thin, the near-Earth plasma sheet probably narrows in the north-south direction, the magnetic field becomes more tail-like and the energetic electron fluxes show a clear reduction. It seems that Geotail finds itself on higher latitude field lines that have less energetic electron content, although at the same time, the energetic proton fluxes increase by more than one or-der of magnitude. The electron flux reduction is probably due to the magnetic field reconfiguration; in sharp contrast, the enhanced proton fluxes are probably freshly accelerated populations. At thinnings although the magnetic field de-creases the proton fluxes increase, which provides evidence for a nonadiabatic process at work.
The energetic electrons are accelerated during the dipolarizations occurred around the times 11:08:40 and 11:09:50 UT. It is worth noticing that the freshly acceler-ated electrons show double-peaked angular distributions (not shown here) and probably stay on closed magnetic field lines characterized by latitude anglesθ≥70◦.
The energetic proton fluxes for the first peak (11:07:45 to 11:08:25 UT) of Fig. 1 are clearly earthward, whereas later, and especially for the third peak, they are changed to tailward. However, we have to take into account and subtract the contribution to the proton anisotropy which is due to the plasma convection velocity. We apply Compton-Getting transformations to achieve angular distributions in the plasma frame of reference. The Compton-Getting trans-formation of the proton intensities to the plasma frame of reference moving with a velocity V is given by Gold et al. (1975), while the same methodology is applied in the work of Sarafopoulos and Sarris (1987). The ambient con-vection velocitiesV are taken∼700 (earthward) and−100 (tailward) km s−1for the first and third peak fluxes of Fig. 1, respectively. TheVx component of plasma velocity is
dis-played in the fifth panel trace of Fig. 1. For the plasma frame of reference, presumably, the only resulting anisotropy would be due to the effect of the accelerating electric field. We compute the spectral indexγ for the channels P2 with P3, P4 and P5. It is assumed for each pair of differential intensities a power law, which is expressed by
j2/jn=(E2/En)−γ.
Fig. 1. A 4-min interval showing Geotail data sets of day 247, 1997. From top to bottom, proton differential fluxes (58–77 keV), electron integral fluxes (E≥38 keV),Bz(in nTs) and polar angleθ(in degrees) of the magnetic field,Vxcomponent of plasma velocity (km s−1),
1622 D. V. Sarafopoulos: A physical mechanism producing suprathermal populations
Fig. 2.Typical angular distributions for the 58–77 keV energetic proton fluxes of Fig. 1 in the plasma frame of reference over the XY plane. The(a)and(b)angular distributions are representative of those observed in the first and third peak fluxes of Fig. 1. The sampled flow direction or otherwise the azimuthal angle phi (in degrees) points toward Sun (tail) withφ=0◦(180◦). The satellite rpm is 20.
those transformed withγ=5.5 and corresponding to the first and third peak fluxes of Fig. 1, respectively, are shown in Fig. 2. The azimuthal phi angle shows the proton flow direc-tion that equals zero (180◦)for earthward (tailward) fluxes. It is worth noticing that the earthward fluxes in the “labo-ratory” frame of reference are really tailward in the plasma frame of reference, whereas the initially tailward fluxes are slightly affected. If we input the somewhat lower plasma ve-locityV=600 km s−1or a lower spectral indexγ=4.5 an al-most similar flow reversal will be attained. Certainly a higher indexγ further increases the anisotropy for the transformed distribution. Therefore, we infer that the energetic proton fluxes are accelerated earthward of the Geotail site.
To summarize our main points:
1. Burst-like energetic electron and proton fluxes are not produced simultaneously. A complete elementary increase-then-decrease in proton or electron fluxes lasts ∼1 min.
2. Freshly accelerated energetic proton fluxes (streaming tailward) are produced at local thinnings (Bz∼=0 nT).
3. Freshly accelerated energetic electron fluxes are pro-duced at local dipolarizations (Bz=12–21 nT) and
re-mained trapped on closed magnetic field topologies. 4. A prolonged thinning of the plasma sheet with
B∼=Bz∼=10 nT atX=−10.2RE is preceded the onset of
energetic protons. The detected 1Bz∼=B fluctuations
are associated with extremely sharp magnetic field re-configurations.
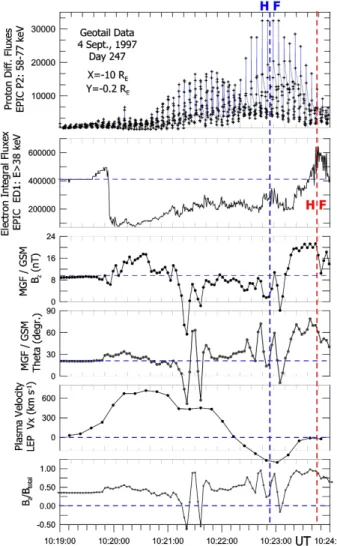
2.2 Second event on 4 September (day 247) 1997
This near Earth event occurs at(X, Y, Z)GSM=(−10,−0.2,
0.5)RE and precedes the already analyzed period. Thus, in
this situation the observed energetic particle accelerations be-long either to a substorm pseudo-breakup or to a very weak substorm, given that for this interval the AE index and the energetic particle fluxes from the LANL geostatic satellites alike (not shown here) remain unvaried. We have plotted an interval of 5 min, in Fig. 3, with the same format as in Fig. 1. In particular we pay attention to the ∼1 min interval from ∼10:23 to∼10:24 UT, since this period is associated with a satellite passage from the plasma regime characterized by distinct negative excursions inBZandθto a more dipole-like
magnetic field structure. The most prominent feature is that the highest proton fluxes (marked as HF, top panel) precede those of the highest electron fluxes (marked as HF, second panel). The proton short-lived peak flux shows an increase of about one order of magnitude. The major increase inθ occurred at ∼10:24 UT, while at that time the BZ tends to
become equal to the totalB.
From 10:20:00 to 10:21:20 UT the energetic protons clearly show earthward fluxes probably since they are strongly affected by the high plasma velocity Vx (420–
700 km s−1, fifth panel) much like as in the preceded event. From 10:22:30 to 10:24:00 UT, while theVx smoothly
weak electron fluxes are also detected streaming tailward. The latter is a very significant observation which is also iden-tified in the next case study and presented using proton an-gular distributions.
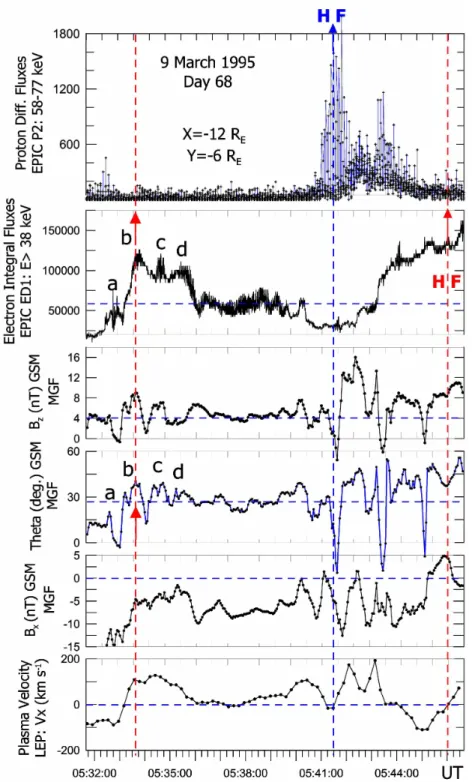
2.3 Third event on 9 March (day 68) 1995 2.3.1 First subinterval
During this ∼15 min interval Geotail was positioned at (X, Y, Z)GSM=(−12,−6,−1.7)RE. Data sets are shown in
Fig. 4 with almost the same format as in the preceded cases, and we stress the following prominent points:
1. A burst of energetic proton fluxes (marked as HF, top panel) occurs at 05:41:30 UT, whereas a simultaneous energetic electron burst is not detected. The proton fluxes are multiplied by∼20, and at this particular time, the electrons do not respond. The peak proton fluxes oc-cur with the major negativeBZexcursion.
2. From∼05:40 to 05:46 UT the magnetic field inside the plasma sheet is highly disturbed and the same does the local plasma velocity (bottom panel) showing abrupt variations. In this figure, instead of plotting the pa-rameterBz/Btotal, we have preferred to include theBX
trace. One reason is that theBX shows that the
satel-lite is repetitively crossing the neutral sheet, while an additional reason is referred below. Decreases inBZ
are frequently observed, although at the same time the averageBZ and the electron fluxes enhance. Finally,
without any doubt the highest electron fluxes are not associated with a similar peak in proton fluxes. Cer-tainly we have to note that in this event we fail to pre-cisely determine the time when the satellite leaves the one plasma regime, which is characterized by−BZ
ex-cursions, and enters into another one with more dipole-like geometry. As a matter of fact, this crossing seems to be a long-lasting one. Nevertheless, the dipolarization process is under development and this is better demon-strated around 05:44 UT, when although we observe the same average value ofθ, being∼40◦, however, theBX
component is larger; the satellite goes away from the neutral sheet and, therefore, the dipolarization process is in progress.
3. It is remarkable that the major peak proton fluxes at ∼05:41:30 UT are not associated with similar peak elec-tron fluxes. This time the energetic elecelec-tron population remains in a low level and flows tailward along the mag-netic field lines. The electron fluxes, over the ecliptic plane XY, are modulated by the satellite revolution pe-riod; and thus we know the electron flow direction ev-ery 3 s. Data from almost six satellite revolutions are plotted in Fig. 5 (top panel) showing that the four ma-jor peak fluxes (marked with arrows) occur antisunward.
Fig. 3.A 5-min interval of day 247, 1997. Same format as in Fig. 1. The blue and red vertical dashed lines mark the highest proton and electron fluxes, respectively.
The azimuthal angle phi (second panel) is the same used in Fig. 2.
4. In parallel to electrons, energetic proton fluxes also stream tailward (i.e. maximum fluxes occur with φ=180◦, third and fourth panels), and along the mag-netic field lines. Proton fluxes for six consecutive satel-lite revolutions are shown in Fig. 5. The plasma veloc-ityVxis very low and does not affect the proton angular
distributions. Finally an explanation is demanded cou-pling the simultaneously observed high tailward proton fluxes and low tailward electron fluxes. Latter on, in the discussion section, we will exhibit our interpretation. 5. The first major dipolarization seen along the θ trace
1624 D. V. Sarafopoulos: A physical mechanism producing suprathermal populations
Fig. 4.A 15-min interval of day 68, 1995. Almost same format as in Fig. 1. The blue and red vertical dashed lines mark the highest proton and electron fluxes, respectively.
distinct electron flux increases; the proton fluxes do not respond and, therefore, energetic protons and electrons are not produced simultaneously.
2.3.2 Second subinterval
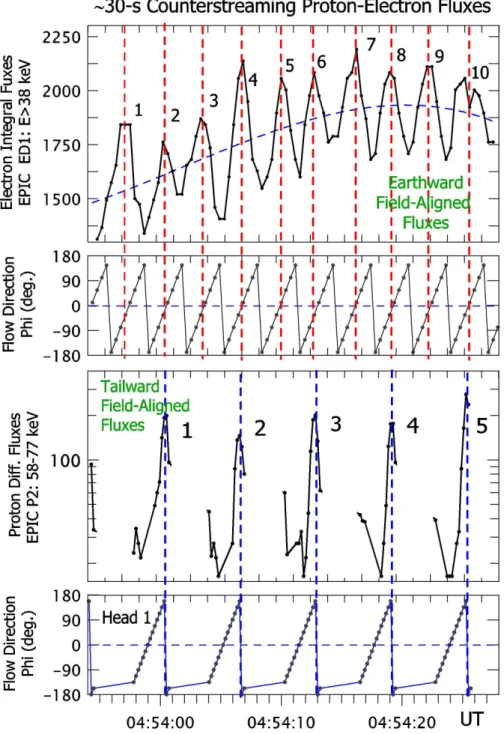
Fig. 5. Energetic electron (top two panels) and proton fluxes from the Geotail/EPIC instrument streaming tailward. The flow direction phi (in degrees) points toward Sun (tail) withφ=0◦(180◦)and is the same angle as it is used in Fig. 2. The vertical dashed lines emphasize the tailward character of flow.
without any detectable energetic electron injection seen by the four geostationary satellites 1984-124, 1991-080, 1989-046, and 1990-095. Additionally, for the same period the AE index remains unvaried and extremely low, typically less than 40 nT (not shown here). Highlighting the possible par-ticle acceleration mechanism, we focus on the subinterval of Fig. 6 characterized by a Geotail smooth crossing of the whole plasma sheet, from the north to the south lobe. The satellite encounters the neutral sheet at 04:56:30 UT (thick-dashed vertical line), when theBx component changes sign
(third panel), the polar angle of the magnetic field reaches its maximum value (θ∼=28◦, fourth panel), and the field strength affected by the plasma diamagnetic effect becomes almost zero (fifth panel). During this plasma sheet crossing, the geostationary satellite LANL 1990-095, which is located 38.75◦eastward of local midnight, identifies the local growth phase of a substorm. The latter is inferred from the 50– 75 keV energetic electron fluxes which steadily diminish un-til∼05:06 UT (bottom panel), when the local substorm onset occurs producing an energetic electron injection. The Geotail passage through the plasma sheet reveals a symmetric mag-netic field structure corresponding to a systematic increase-then-decrease of energetic electron fluxes (second panel), which are maximized at the neutral sheet. Most importantly, under these circumstances none could anticipate, during this
Fig. 6.A smooth plasma sheet crossing. Geotail data sets from top to the fifth panel: Proton differential fluxes (58–77 keV), electron integral fluxes (E≥38 keV),Bx(in nTs), polar angleθ(in degrees)
and strength B of the magnetic field. The bottom panel shows 50– 75 keV energetic electron differential fluxes from the LANL 1990-095 satellite.
1626 D. V. Sarafopoulos: A physical mechanism producing suprathermal populations
Fig. 7.An interval with∼30-s (i.e. ten satellite revolutions) counterstreaming field aligned fluxes of energetic protons and electrons obtained by the Geotail/EPIC instrument; same format as in Fig. 5. Proton and electron fluxes are slightly smoothed by a running window of∼1 s. The red and the blue vertical dashed lines mark the peak electron and proton fluxes, respectively.
fluxes (φ∼=180◦, bottom panel). The available consecutive angular distributions are numbered along the flux traces for both electrons and protons. Both proton and electron fluxes in Fig. 7 are slightly smoothed by a running window of∼1 s. Additionally, for this substorm, Wanliss et al. (2000) de-termined via ground magnetograms and meridian scanning photometer data that the expansion phase onset occurred at
Fig. 8. Schematic illustrating a locally thinned plasma sheet; neg-ative charge is accumulated in the tip structure, and the surface charge densityσ eventually produces the electric field along the magnetic field lines. The latter is considered responsible for the ob-served counterstreaming energetic proton and electron fluxes shown in Fig. 7.
electric field accelerating particles 9 min before the substorm expansion phase onset.
We now describe an interpretation scheme for the bi-directional electron-proton fluxes shown in Fig. 7. We as-sume that a tailward-pointing, field-aligned electric field E||, which accelerates these particles, develops earthward of the satellite on the sampled magnetic field lines. Figure 8 schematically illustrates the local particle acceleration mech-anism which is based on a negatively charged neutral sheet region. The latter is probably due to the charge accumula-tion at the tip of each stretched magnetic field line in a TCS. In this perspective, above and below the neutral sheet, an electric field of magnitudeE=σ/2εo arises due to “an
infi-nite sheet of uniform charge” with negative surface densityσ over the tail midplane. The component E|| being parallel to the magnetic field lines will accelerate electrons and protons in opposite directions. With a polar angle of the magnetic field 10◦–20◦, a thinned plasma sheet having length 1–2RE
and a total electric field 100 mV/m, the estimatedE|| will be 17–34 mV/m and the overall energization will be 110– 440 keV. We have hypothesized that the energetic protons become unmagnetized in the thinned plasma sheet and move tailward, something that is actually observed throughout the Fig. 6 interval. The protons move tailward and undergo ener-gization by the accelerating electric field in the TCS region.
However, the mechanism is not fully developed here, at least for the electrons, given that much higher electron fluxes are produced later with the occurring local plasma sheet dipolarizations. Progressively, as the substorm evolves the polar angle of the magnetic field increases from the initial level of 10◦ at∼04:50 UT, to∼30◦at 05:35, and ∼45◦at ∼05:45 UT; the energetic electron fluxes increase 30 and 50 times, respectively. Conversely, the energetic proton fluxes increase no more than ∼3 times as the substorm grows.
Fig. 9.An isolated substorm as has been observed on 13 February (day 44), 1994, by Geotail atX=−64.2RE. Same format as in
Fig. 1, except that the geomagnetic activity index AE is added in the top panel trace. The tailward energetic proton fluxes (second panel, blue line) are distinguished by the earthward ones (red line). The green-dashed vertical line marks the time on which the plasma changed its flow direction.
1628 D. V. Sarafopoulos: A physical mechanism producing suprathermal populations 2.4 Fourth event on 13 February (day 44) 1994: a distant
tail case study
There are some fundamental similarities between the near Earth observations and those in the distant tail. This case study typifies the distant Earth situation, and we suggest that the same underlying energization mechanism is at work near and far from Earth. We present a typical substorm ob-served at (X, Y, Z)GSM=(−64.2, 8.7, −1.4)RE that shows
a remarkable differentiation in the proton-electron response. Although a 3-h interval is exhibited here (Fig. 9), we believe that the same information is carried as in Fig. 1 treating a pe-riod of 4-min. In the distant tail, the plasma sheet recovery occurs with the substorm recovery phase, while the acceler-ation source retreats tailward; the substorm associated dipo-larization is in progress. We underline the main points for the under study substorm as follows:
1. The AE index (top panel of Fig. 9), synthesized from ground station magnetograms, documents the time his-tory of this intense (maximum value of 1500 nT) sub-storm.
2. Initially the near Earth acceleration source produces tailward proton fluxes at Geotail (second panel, blue line), whereas the proton fluxes are switched to earth-ward (second panel, red line) as the source retreats tail-ward.
3. The plasma flow velocity (sixth panel), with extremely high values (Vxoften being greater than 1000 km s−1),
changes its flow direction as the energetic proton fluxes do.
4. When the plasma flow changes its direction, the satellite spends most of its travel time in the north lobe domain because the plasma sheet is probably thinned and the retreating tip structure encounters the satellite.
5. The acceleration mechanism seems to be slightly more effective in energizing tailward than earthward proton fluxes. The tailward to earthward flux ratio is less than 2.
6. The situation is radically different for the energetic elec-tron fluxes: As the source was positioned earthward of spacecraft the electron fluxes were low, whereas with the source tailward of spacecraft 10 times greater elec-tron fluxes were counted.
7. Electrons essentially remain magnetized and are accel-erated on closed field lines associated with the plasma sheet recovery. In contrast, protons can easily escape from the closed geometry and diffuse in the nearby mag-netic field lines.
8. At times, during the plasma sheet recovery phase, we observe energetic protons and electrons stream-ing earthward simultaneously. Such a period is from
16:47:50 to 16:48:10 UT and an explanation is given bellow.
The similarity with the near Earth observations is that in front of the accelerating source (i.e. the satellite is located tail-ward of the source) mainly energetic protons are produced, whereas behind it energetic electrons are measured.
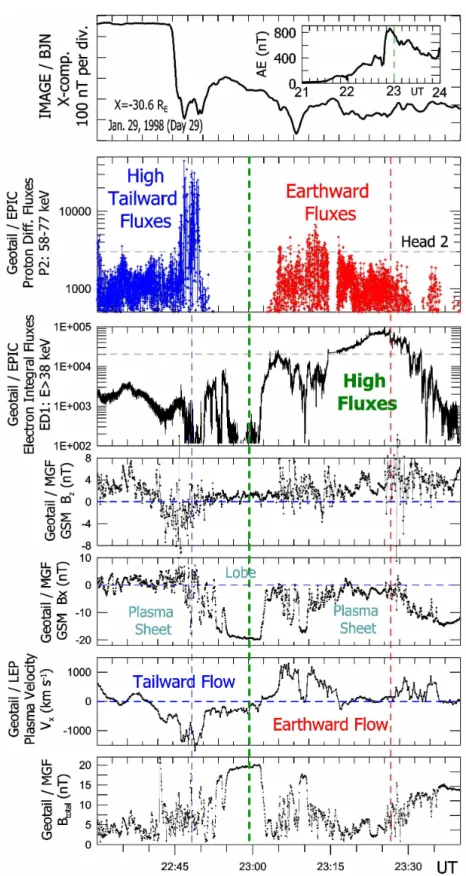
2.5 Fifth event on 29 January (day 29) 1998: a mid-tail case study
In this example (Fig. 10) the satellite remained near the current sheet throughout the substorm, a rare occurrence. Geotail being positioned at (X, Y, Z)GSM=(−30.56, 0.55, −2.53)RE clearly reveals the plasma sheet thinning and
recovery phases associated with an isolated moderate sub-storm. The latter is evident from the BJN (Bear Island) ground magnetogram of the IMAGE array shown in the top panel trace of Fig. 10. The BJN station with geographic lati-tude and longilati-tude 74.5◦ and 19.2◦, respectively, is located close to the midnight meridian and clearly shows a sharp magnetic field reduction caused by intense electrojet cur-rents. The thinning phase is characterized by intense and per-sistent tailward plasma flows (sixth panel) and recurring neg-ative turnings along theBz component trace (fourth panel).
In contrast during the recovery phase the flow is reversed and theBz is dominated by multiple positive turnings. The
3 Discussion
3.1 Electron and ion heating mechanism
3.1.1 The demand for a new acceleration scheme
In general, particle acceleration is produced by electric fields or by time-varying magnetic fields; the rate of energy gain is given by
dW
dt =qυ¯·(E¯ind+ ¯Eel)+µ ∂B
∂t
where the termµ∂B/∂tis referred to the betatron accelera-tion being significant when the time scale of magnetic field variation (Tmf)is much greater than the particle gyroperiod
(Tgyr). That is, Tmf≫Tgyr, while the first adiabatic
invari-ant, µ, is conserved. Strong inductive electric fields E¯ind
parallel to the particle velocity υ¯ may accelerate particles when the Tmf is comparable to Tgyr. Additionally,
elec-trostatic electric fields may contribute to the rate of energy gain via the termqυ¯· ¯Eel. Certainly, in the studied cases,
in-ductive or electrostatic electric fields may be at work since the energetic protons become non-adiabatic in a stretched magnetic field topology. However, all these mechanisms will produce protons and electrons simultaneously, some-thing which is not observationally supported. The latter is a major criterion leading us to introduce the “asynchronous mode” proton-electron acceleration mechanism. We system-atically observe different time response for protons and elec-trons: Near Earth proton peak fluxes correspond to localBz
minima (thinnings), whereas electron peak fluxes occur with localBzmaxima (dipolarizations). More distant from Earth,
the substorm thinning phase is dominated by high proton and weak electron fluxes, whereas the substorm recovery phase is characterized by vast energetic electron fluxes. Therefore, we infer that the energization mechanism seems not to be controlled, in a large degree, by the factordB/dt, which is mainly associated with the magnetic field reconfiguration. Conversely, the operating mechanism preferentially acceler-ates protons at local thinnings and electrons at local dipolar-izations.
We frequently observedB/dt decreases occurring imme-diately after dB/dt increases. In this situation, if we sup-pose according to Faraday’s law an accelerating electric field, then it and the energetic protons flow alike should reverse their directions. The latter is never observed; for instance in Fig. 1 thedB/dtfactor irrespective of its sign (i.e. negative at 11:07:50 and positive at 11:08:40 UT) produces proton fluxes directed earthward.
We have simultaneously observed energized proton and electron fluxes without anydB/dtvariation: on day 68, 1995, the satellite goes through a stationary TCS structure; how-ever, oppositely streaming field-aligned energetic proton and electron populations are observed. Energetic protons stream-ing tailward are clearly observed for 9 min before the sub-storm onset. This provides strong evidence for an existing
active acceleration mechanism which gives rise to an electric fieldEkparallel to the magnetic field lines.
To summarize, energetic proton and electron populations are not primarily produced bydB/dtvariations, since
(a) proton and electron fluxes are not produced simultane-ously,
(b) at times, thedB/dt rate changes sign in a repetitive mode although the energetic proton flow direction is not in-fluenced.
(c) at local expansions thedB/dtrate increases and the en-ergetic proton fluxes decline; in contrast, the electron fluxes increase, and
(d) occasionally, protons and electrons are accelerated in situ within a stationary TCS. In a case energetic protons are produced before any substorm onset.
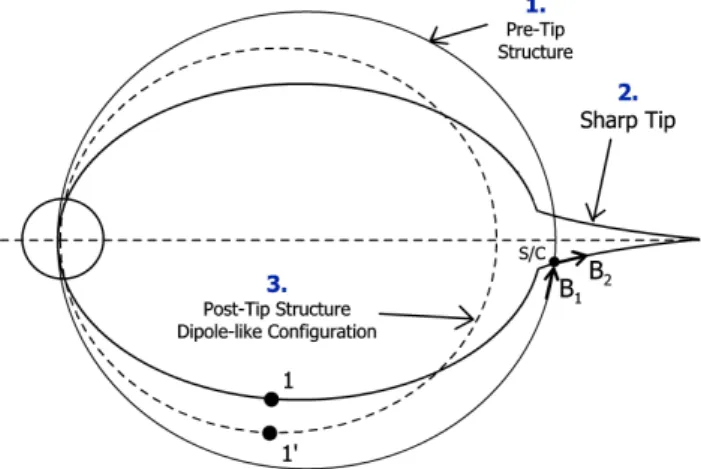
3.1.2 The proposed particle energization mechanism Our data support an earlier concept (see, e.g. Sarafopoulos and Sarris, 1988) that a substorm is assembled by putting a large number of distinct elementary activations. Each indi-vidual activation center, with∼1 min duration, is typically made up of its own local thinning and expansion phases. In the context of this work, the thinning phase is tightly associ-ated with tip structure formation and the sketch of Fig. 11 il-lustrates the successive magnetosphere reconfigurations tak-ing place durtak-ing an activation. We identify three distinct phases: The pre-tip, tip (local thinning) and post-tip struc-tures. Most importantly, electrons and ions are not accel-erated simultaneously. It is observationally inferred that pro-tons (electrons) are mainly accelerated during local thinnings (dipolarizations). The latter requires an interpretation which is exhibited below:
Electron energization
1630 D. V. Sarafopoulos: A physical mechanism producing suprathermal populations
Fig. 10.An isolated moderate substorm on 29 January (day 29), 1994, has been observed by Geotail atX=−30.6RE. Similar format with
Fig. 11. Schematic illustrating the possible successive magnetic field reconfigurations from the pre-tip (dipole-like structure) to the tip formation, and finally to the post-tip geometry; at higher lati-tudes the line (1) is moved outward to the position marked as (1′).
escape along the magnetic field lines. The once established electrostatic field has the capacity to accelerate electrons un-til the bulk charge is eventually degenerated by the repulsion forces among electrons. Figure 12a schematically illustrates the mechanism by which trapped electrons are accelerated. Proton energization
At the local thinning phase negative charge is piled up in the tip, and the once established electrostatic field accelerates protons. Figure 12b is a sketch showing the mechanism that might produce energetic protons. These protons are expelled (emitted) tailward of the tip, and this picture seems to justify the adopted term “sharp emitter tip”.
3.1.3 The proposed acceleration mechanism and the ratio Ti/Te≈7
The ion and electron temperatures in the central plasma sheet show a very high degree of correlation, withTiTe≃7 (for
instance see the work of Baumjohann et al., 1989). The lin-ear relation betweenTi andTeholds for plasma temperatures
ranging over a factor of>∼100, that is, both in a hot and cold plasma sheet and is totally independent of the distur-bance level. Therefore, the plasma as well as the energetic ion and electron populations respond collectively as a single unified particle population during plasma sheet temperature transitions (Christon et al., 1988). However, “the heating of ions and electrons in parallel has not been explained yet, ei-ther in the framework of the near-Earth neutral line model or by any other theory” (Baker et al., 1996).
We have suggested that the particle acceleration is based on the accumulated negative charge in the tip structure during its formation. That is, under this perspective the acceleration mechanism is based on a “time varying electrostatic electric
Fig. 12.Mechanism accelerating(a)electrons and(b)protons dur-ing local plasma sheet dipolarizations and thinndur-ings, respectively. At the local thinning phase negative charge is piled up in the tip, and the once established electrostatic field accelerates protons. During the local dipolarization phase a small fraction from the accumu-lated electrons have the chance to undergo acceleration by the same established electrostatic field until the bulk charge is eventually de-generated by the repulsion forces among electrons.
field” along the magnetic field lines. The question is whether such a mechanism might explain the ion to electron temper-ature ratio.
We can write TiTe=miυi2meυe2=7 or υe
. υp≃16,
whereυe,υi andυpare the thermal velocities for electrons,
ions and protons, respectively, while the plasma thermal en-ergy is kT. Certainly a simplification is introduced here that all the ions are exclusively protons. Furthermore, we sup-pose that protons and electrons are accelerated by the same electric fieldE, while their acceleration ratio isαe
.
α≃p1832, whereαe andαp are the electron and proton accelerations,
respectively. Using the equation of kinematics for “constant acceleration” and time flightstpandtefor electrons and
1632 D. V. Sarafopoulos: A physical mechanism producing suprathermal populations
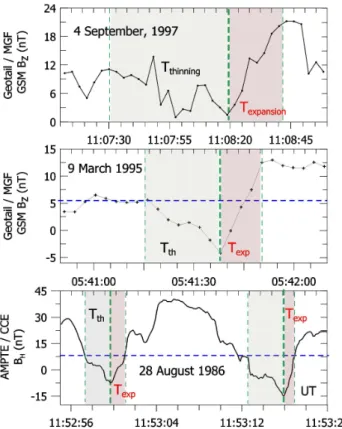
Fig. 13. Four distinct cases corresponding to three different sub-storms with intense local thinning/expansion phases. The two cases are taken from our presented Geotail data sets of days 247, 1997, and 68, 1995; the third is taken from the well-known substorm of day 240, 1986 (AMPTE/CCE data). The thinning phase identified either by the decreasingBz, or by the decreasing north-south
com-ponentBH of the magnetic field, is apparently 2–4 times longer
than the expansion phase.
tp
te
=υp
αp
υe
αe
≃114
If we hypothesize an ideal electrostatic electric field accel-erating particles and having length L, then 12αete2=12αpt
2
p, or
the same energy is achieved by electrons and protons as well, when
tp
te
=42
Therefore, the observational constraint of TiTp=7 leads
totpte=114, whereas an ideal accelerating source yields
tpte=42. We explain this discrepancy as follows: our basic
scheme is that protons are essentially accelerated during lo-cal thinnings, whereas electrons are mainly accelerated dur-ing local expansions. In both phases the involved “electro-static charge” is assumed to be the same; the novel point is that the local thinning phase seems to be longer than the ex-pansion phase and, therefore, ions have the opportunity to be accelerated for a longer time. Theoretically, from the preceded simple computation the thinning phase has to be
∼2.7 longer than the expansion one; an anticipation which is observationally supported. In Fig. 13 we show four distinct cases corresponding to three different substorms with intense local thinning/expansion phases. Two cases are taken from our Geotail case studies of days 247, 1997, and 68, 1995; the third is taken from the well-known substorm of day 240, 1986 (AMPTE/CCE data) at a radial distance of∼8 REnear
midnight. Actually the thinning phase identified by the de-creasingBz, or by the decreasing north-south component BH
of the magnetic field in the local coordinate VDH system de-scribed by Takahashi et al. (1987), is apparently 2–4 times longer than the expansion phase. The plasma sheet recon-figurations (i.e. thinning and expansion phases) hide in their duration the lifetime of the accelerating mechanism: We pos-tulate that the duration of thinning (expansion) reflects the lifetimeτρ(τe)of the proton (electron) accelerating electric
field, that isτρ andτeare primarily parameters of the
accel-erating source itself. It must be stressed, however, that we are interested in their ratio, henceτp/τe≈2.7. Otherwise, the
protons stay at thinnings is 2.7 times longer as compared to their own stay at expansions.
At this point, it is interesting to mention that the above relationship concerning the local thinning to expansion time scale ratio holds, macroscopically, for substorm associated thinnings and recoveries of plasma sheet. Sarafopoulos and Sarris (1990) statistically inferred that the plasma sheet boundary layer duration (i.e. the period spent by the satel-lite in a region of 10% depression of the lobe magnetic field) during plasma sheet thinnings is longer than plasma sheet re-coveries.
Under the assumptions that
(a) the field-aligned accelerating electric field E is the same for both expansion and thinning phases, since they are coupled through the same charge, and
(b) that there are two separate energization processes for protons and electrons which are associated withτp/τe ≈2.7,
we infer that the two acceleration sources having lengths LexpandLt hfor the expansion and thinning phases,
respec-tively, are characterized by the ratio Lt h
Lexp
= 2apτ 2
p
2apτe2
= τ
p
τe
2 ≃7
At the expansion phase, although protons and electrons gain the same amount of energy, the electron population is the dominant one, and the achieved energy gain can be written 1Wexp=qELexp
At the thinning phase protons are mainly energized by 1Wt h=qELt h. Thus the proton-electron heating process is
characterized by1Wt h1Wexp≃7.
A transient field-aligned electric field of 100 mV/m and a scale size Lexp=1000 km, will produce 100 keV electron
Fig. 14.Schematic over the XZ plane illustrating that the motion of electrons toward the tip could be considered equivalent with two parallel filaments carrying currentJ. The parallel currents are mutually attracted, the filaments move toward each other, theJ¯× ¯Bforce progressively increases and, unavoidably, the TCS structure will collapse. The collapsing tip may develop a strong electrostatic fieldExin front of it that
points earthward and, potentially, causes current disruption.
To summarize: The magnetized electrons are essentially accelerated on closed topologies during local dipolarizations, while protons attain their high energies during the longer lo-cal thinnings. However, the accelerating electric field seems to be the same producingTi/Te≈7.
3.2 TCS collapse mechanism
It is generally accepted that at the substorm growth phase a magnetic field line is highly distorted away from a dipole form by the presence of a thin but intense current sheet (TCS) located in the near-Earth plasma sheet. Under our fundamen-tal assumption, “current-carrying electrons” are piled up and trapped in the tip structure, while the motion of electrons to-ward the tip could be considered equivalent with two par-allel branches-threads carrying current J, as it is sketched in Fig. 14. The parallel currents are mutually attracted, the threads move toward each other, the J¯× ¯B force progres-sively increases and, unavoidably, the TCS structure will collapse. Additionally, the collapse mechanism is proba-bly favoured by another factor: The unmagnetized ions in front of the tip will undergo Speiser orbits across the tail, and the local cross-tail current density will increase. The lat-ter will further reduce theBzcomponent of the tip and speed
up its collapse. Moreover, it is reasonable to hypothesize that the collapsing tip develops a strong electrostatic fieldEx
(Fig. 14) in front of it that points earthward. Note that this Excould be roughly estimated by the expression
Ex =ql/2π εoR
where ql=Q/L is the linear charge density from a total
chargeQaccumulated in the tip structure and uniformly dis-tributed over a lengthL along the Y-axis. The Ex is
esti-mated in a distanceRfrom the tip, supposed thatR≪L. This
electric field, at the terminating point of the locally thinned plasma sheet region, naturally stops the ion motion and may lead to the current disruption (JCD) dictated by the local
Ex andBz ion drift. Once developed the currentJCD may
have two major consequences: first, earthward of it proba-bly induces a positiveBzcomponent which enforces a local
dipole-like geometry and, second, tailward of it probably in-duces a negativeBz component which drastically decreases
the pre-existing positiveBzand prepares the magnetosphere
for the next local thinning phase. The latter will very likely take place in a site slightly displaced tailward as compared to the preceded tip site, and in this way the activation centers seem to be gradually moving tailward. The TCS collapse is followed by the local expansion phase, while the involved field lines are displaced inward at the equator and outwards at high latitudes, to assume a more dipolar form associated with a much reduced tail current. The sketch of Fig. 11 illus-trates the possible successive reconfigurations from the pre-tip (dipole-like structure) to the pre-tip formation, and finally to the post-tip geometry; at higher latitudes the (1) line is moved outward to the position marked as (1′).
3.3 Ionospheric origin electrons favouring the tip formation and substorm triggering
1634 D. V. Sarafopoulos: A physical mechanism producing suprathermal populations
Fig. 15.Schematic illustrating the Petschek’s symmetric reconnec-tion model which consists of the inflow region, the outflow region, and the small central diffusion region around a magnetic null sit-uated at the centre of X-line. Beneath it, an asymmetry in the magnetic field topology is introduced which potentially gives an in-terpretation for the observed particle flux asymmetries in sites like those marked by A and B.
proposed mechanism based on the sharp tip formation and collapse. The dominant cold-dense population of ionosphere electrons with low velocities can readily be trapped in the tip. We have to pay more attention to the transition region between the ring current and the plasma sheet: The most plasma sheet particles are energetic enough and undergo gradient-drifts encircling the “Alfv´en layer” near the Earth. When the Bz component of the IMF is strongly negative
the magnetosphere convection is strong and the plasma sheet particles can penetrate closer to the Earth, where the plas-maspheric electrons are abundant. The newly built up strong ring current bends the magnetic field lines to a tail-like con-figuration and the electrons rush up to the tip structure; a TCS may be developed. In turn, an abrupt turning of the IMF to positiveBz values will inflate outward the Alfv´en layer
and the particles, close to the tip, will be trapped on
closed-loop trajectories, whereas the plasma sheet particles out of the Alfv´en layer will halt penetrating earthward. Therefore, the displaced Alfv´en layer is associated with decreased ring current earthward of it and dipolarized magnetic field lines. In this view, a sharp tip is enclosed in a relatively dipole-like structure; an ideal geometry for substorm triggering. Based on this substorm triggering scenario, we see no further obsta-cles accepting a substorm initiation as close to the Earth as ∼8RE.
Consequently, the ionospheric electron fluxes seem to play a key role in initiating current disruptions and particle en-ergizations. A similar claim that ionospheric oxygen ions promote substorm activity remains to be demonstrated (Lui, 1996), although it is shown that a general rise in oxygen ion abundance coexists with increased substorm activity (Daglis et al., 1994).
We previously mentioned that an abrupt excursion of the IMF toward positiveBzvalues, after a prolonged interval of
southwardBz, is generally associated with the substorm
on-set. Similarly, a stepwise dynamic pressure increase in the solar wind may further thin the plasma sheet and lead to the tip formation. In this case, one could anticipate that the near Earth region is first affected and, therefore, the near Earth region may inaugurate the substorm phenomenon.
3.4 Contradiction in terms of a symmetric reconnection model
The reconnection process merges magnetic field lines lead-ing to a rearrangement of the magnetic field. In parallel, magnetic field energy is released, heating the plasma, cre-ating a shock wave, and accelercre-ating particles. It is generally accepted that, at least in the distant magnetotail the recon-nection takes place on an absolutely symmetric structure, as it is sketched in Fig. 15. That is, the X-line is assumed hav-ing a vertical and a horizontal symmetry axis. We show the Petschek’s symmetric reconnection model which consists of the inflow region, the outflow region, and the small central diffusion region around a magnetic null situated at the centre of X-line.
Fig. 16. Once the near Earth tip structure is formed, ions are accelerated toward the tail, but most likely the energized populations are surrounded by closed magnetic field lines. Any ion diffusion process will restrict them to a small range near the Earth, in the tip vicinity. At the SAT 3 site, as it is schematically illustrated, none ion will be detected, while at the SAT 1 (SAT 2) site tailward (earthward) ion fluxes would be detected.
formation plays a vital role. Such a sharp tip embedded in the plasma sheet is schematically shown in Fig. 15, and we believe that this structure is eventually involved in the current disruption-reconnection process. At the substorm recovery phase the acceleration source retreats tailward, and it seems that the sharp tip structure removes tailward as well. In front of the tip the cross tail current may locally disrupt and the anti-parallel magnetic fields lines reconnect. In our recon-nection scheme the electrons are essentially kept magnetized earthward of the sharp tip, in front of which a X-line may be formed; however, the dynamics is primarily focused on the knife-edge tip structure.
3.5 Substorm onset site and energetic particle flow direc-tion
The distinguishing signature of the NENL model that tail-ward flow threaded by southtail-ward magnetic field is sel-dom seen inside of∼20RE (Baumjohann et al., 1990;
An-gelopoulos et al., 1993) suggests that the X line is typically formed beyond this distance (Baker et al., 1996). In the presented case studies, certainly we have observed tailward fluxes of energetic protons near the Earth (X∼=−10RE).
Most importantly, we believe that these fluxes may remain undetectable atX∼=−20RE: once the near Earth tip
struc-ture is formed, ions are accelerated toward the tail, but most likely the energized populations are surrounded by closed magnetic field lines. Any ion diffusion process will restrict them to a small range near the Earth, in the tip vicinity. At the SAT 3 site, as it is schematically illustrated in Fig. 16, no ions will be detected, while at the SAT 1 (SAT 2) site tail-ward (earthtail-ward) ion fluxes would be detected. In contrast, highly streaming energetic ion populations could be seen, for
instance atX∼=−180RE (Sarafopoulos et al., 1997),
when-ever the reconnected field lines reach the separatrix. 3.6 Sharp emitter tips and the strong-double-layer model Following the discussion in the preceding sections, para-graphs a small fraction of the trapped electrons in the tip are accelerated, whereas the bulk population will essentially remain at the initial level of∼0.5 keV temperature. In this subsection, we speculate trying to associate the supposed tip charge with what is called the “strong-double-layer model”. It is emphatically stated by Borovsky (1993) that “work is needed to connect auroral-double-layer structures to genera-tor mechanisms in the plasma sheet, in order to extend the model”. We assume that the tip formation at local thin-nings bunches electrons together, electrons which later at local dipolarizations travel along the magnetic field lines toward their conjugate points in the Northern and South-ern Hemispheres. The bottom edge of the double-layer structure resides about 1–2.5RE above the earth’s surface,
where the ionospheric plasma ions and the magnetospheric plasma electrons have densities that are approximately equal. Much like a parallel-plate capacitor the double-layer may be able to produce the typical auroral-arc-electron energies of 5–15 keV. With a plasma sheet temperature of∼0.5 keV the accelerated electrons by the double-layer will be mono-energetic, with the energy being highest near the center of the structure and falling off near the edges.
1636 D. V. Sarafopoulos: A physical mechanism producing suprathermal populations
Fig. 17. Schematic illustrating the electrostatic potential drops above auroral arcs that act to accelerate the electrons downward. We suggest that a double-layer generator mechanism might be the “plasma sheet cloud of electrons” originated by the tip structure col-lapse.
1975; Borovsky, 1992). We suggest that a double-layer gen-erator mechanism might be the locally accumulated negative charge in the sharp tip. Figure 17 is a schematic illustrat-ing the auroral acceleration region established by the “plasma sheet cloud of electrons” originated by the tip collapse. 3.7 Lack of electron energization at the initial period of a
substorm
The 28 August 1986 substorm-event (Fig. 13) was studied by many researchers; Ohtani et al. (2002) wrote that proba-bly the most puzzling result was that it reveals the lack of electron energization during the initial period of magnetic turbulence. The total magnetic field fluctuated by an order of magnitude during the interval, whereas the electron dis-tribution function seems to be unaffected. This is similar with what we observe the day 247, 1997, from 10:20:30 to 10:23:30 UT (Fig. 3). Energetic protons are abundant, but the electron fluxes are low. In our view, this is the anticipated behaviour, and it constitutes a major observational finding in this work: The energetic proton fluxes do not occur si-multaneously with energetic electron fluxes for the reason that energetic protons are mainly accelerated at local thin-nings and electrons at local expansions. Moreover, the satel-lite position is of great importance; generally, proton fluxes and slightly delayed electron fluxes will be observed at po-sitions earthward of the tip, while exclusively proton fluxes will be received tailward of the tip. The schematic Fig. 18 illustrates the geometry; although the various satellite posi-tions (1)–(3) are all characterized by intense −Bz at local
thinnings, only the position (3) is privileged to be directly associated with the tip structure at the dipolarization phase
Fig. 18. Schematic illustrating that although the various satellite positions (1)–(3) are all characterized by intense -Bzat local
thin-nings, only the position (3) is privileged to be directly associated with the tip structure at the dipolarization phase (blue-dashed line). Therefore, newly accelerated electrons can be found only at posi-tions earthward of the tip. In the satellite position (4) only a few demagnetized and tailward streaming energetic electrons can be de-tected.
(blue-dashed line). Therefore, newly accelerated electrons can be found only at positions earthward of the tip. In the satellite position (4) only a few demagnetized and tailward streaming energetic electrons can be detected; two cases in this category are observed in Figs. 3 and 4. In general, we can state: the longer the interval the satellite senses a dipole structure, the higher the likelihood to detect accelerated elec-tron. The permanent stay in a dipole-like structure is always associated with high electron fluxes supposing that the geo-magnetic activity is large enough.
3.8 The quasi-periodic mode of local dipolarizations Takahashi et al. (1987) for the AMPTE/CCE substorm of day 240 (28 August), 1986, detected the quasi-periodic char-acter ofBandBH(north-south component) and, among
oth-ers, stated that a potential physical mechanism exciting these oscillations might be associated with the bounce period of 0.5 keV electrons. In the context of our discussion, such a suggestion may be of great importance; the same periodicity ofT≈20-s, along theBztrace, is detectable in our Figs. 3 and
4. Additionally, we have to underline that the proton bursts typically show longer periodicities, for instanceT≈60-s in our Fig. 1.
Certainly the above mentioned periodicities must be thor-oughly studied in the near future in order to support firm re-sults; however, we make a preliminary suggestion. In our context, at the local dipolarization phase the once trapped in the tip structure current-carrying electrons are ejected along the magnetic field lines and prepare the magnetosphere for the next local thinning and dipolarization, in a repetitive fash-ion. The bounce period of the low energy electrons may de-termine the time between two successive negative excursions ofBz; the electron oscillatory flow seems to be in resonance
in this way, the tip becomes progressively sharper. The in-creasing number of rebound electrons, which are treated as two parallel currents, may eventually lead to the local TCS collapse (Sect. 3.2), which may be characterized by its own periodicity.
3.9 Additional comments
Liu (2001) developed a formulation generating bursty bulk flows (BBFs) without introducing any NENL model. He based on “a highly curved current sheet”, which apparently leads to the tip formation, as it is suggested in this work. Ad-ditionally, Wanliss et al. (2002) using a test particle model were able to produce fast tailward plasma flows in the near Earth central plasma sheet region as a consequence of plasma sheet boundary layer ion beam dynamics. Certainly they are exclusively focused to the substorm growth phase; however, the same methodology could be progressively applied with a tip structure retreating tailward. The magnetic field model of Wanliss et al. (2000), which take into account an azimuthally and radially confined “weak magnetic field region”, is a valu-able tool approaching the “tip structure” dynamics. Such an extended model might simulate the proposed acceleration scheme of this work. Eventually, we anticipate that theory and experiment will further converge, in the near future, to diagnose the nature and the role of each substorm related ef-fect.
4 Summary
This entire work has, at its core, the introduced “akis” struc-ture. We try to demonstrate its fundamental role in mag-netotail dynamics and energetic particle acceleration. The term “akis” involves the local extremely tail-like magnetic field topology and stresses its function as “sharp emitter tip”: In the Earth’s magnetotail this structure demagnetizes ions and accumulates negative charge. Elsewhere, similar sharp tip structures are proved to work very well (i.e., lightning discharges, Field Emission Electric Propulsion thrusters in satellite technology, Scanning Tunneling Microscopes, etc.), and potentially the same principle may reveal something more of the substorm’s mystery.
If the tip formation actually plays such a vital role, and this is further supported by future research, then we could identify the substorm initiating mechanism as the “akis in-stability”. This mechanism may cause current disruption and reconnection as well; however, the driving force is primarily set on the knife-edge tip structure. The observational ele-ment that the energetic proton and electron populations are not produced simultaneously is our major finding. We have suggested that the particle energization is essentially gained by transient electrostatic fields along the magnetic field lines, and not by anydB/dt variation according to the traditional assumption. In general, all the long-standing open questions
concerning the substorm phenomenon can be approached in a different perspective.
Acknowledgements. Concerning the use of the highest resolu-tion Geotail/EPIC data-sets, we are grateful to (a) A. T. Y. Lui, R. W. McEntire, E. T. Sarris, and D. J. Williams, (b) S. R. Ny-lund for his pre-processing of the data, and (c) The Johns Hopkins University/Applied Physics Laboratory that maintains the available data web site. We would like to thank Kazue Takahashi for his pro-vision of the 0.124-s resolution AMPTE/CCE magnetic field data of day 240, 1986. Also we thank S. Kokubun and T. Mukai for the high-resolution Geotail/MGF magnetic field and Geotail/LEP plasma data, respectively. Regarding the use of LANL energetic particle data, we thank Richard Belian and Geoffrey D. Reeves. We are grateful to the Finnish Meteorological Institute (FMI/GEO), the Technical University of Braunschweig and other institutes that maintain the IMAGE magnetometer array. The author thanks the three referees who significantly improved the initial manuscript.
Topical Editor I. A. Daglis thanks J. Wanliss and two other anonymous referees for their help in evaluating this paper.
References
Angelopoulos, V., Kennel., C. F., Coroniti, F. V., Feldman, W. C., Gosling, J. T., Kivelson, M. G., Walker, R. J., and Russell, C. T.: Observations of a quasi-static plasma sheet boundary, Geophys. Res. Lett., 20, 2813–2816, 1993.
Baker, D. N., Pulkkinen, T. I., Angelopoulos, V., Baumjohann, W., and McPherron, R. L.: Neutral line model of substorms: Past results and present view, J. Geophys. Res., 101, 12 975–13 010, 1996.
Baumjohann, W., Paschmann, G., and Cattell, C. A.: Average plasma properties in the central plasma sheet, J. Geophys. Res., 94, 6597–6606, 1989.
Baumjohann, W., Paschmann, G., and L¨uhr, H.: Characteristics of high-speed ion flows in the plasma sheet, J. Geophys. Res., 95, 3801–3809, 1990.
Baumjohann, W. and Treumann R. A.: Basic Space plasma physics, Imperial College Press-ICP, 122–124, 1996.
Belian, R. D., Gisler, G. R., Cayton, T., and Christensen, R.: High-Z energetic particles at geostationary orbit during the great So-lar Proton Event Series of October 1989, J. Geophys. Res., 97, 16 897–16 906, 1992,
Birn, J., Hesse, M., and Schindler, K.: MHD simulations of magne-totail dynamics, J. Geophys. Res., 101, 12 939–12 954, 1996. Borovsky, J. E.: Double layers do accelerate particles in the auroral
zone, Phys. Rev. Lett., 69, 1054–1056, 1992.