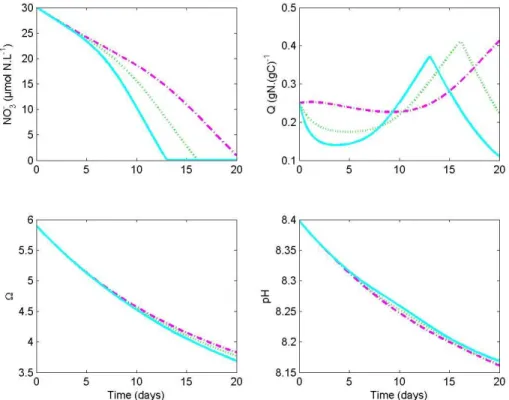
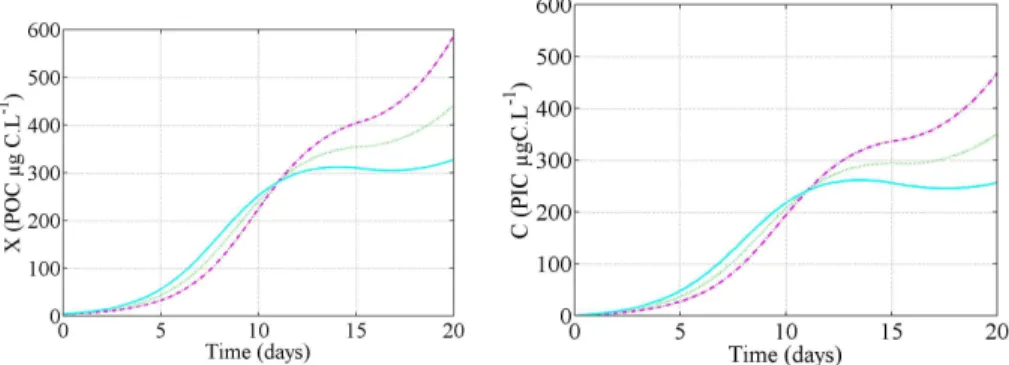
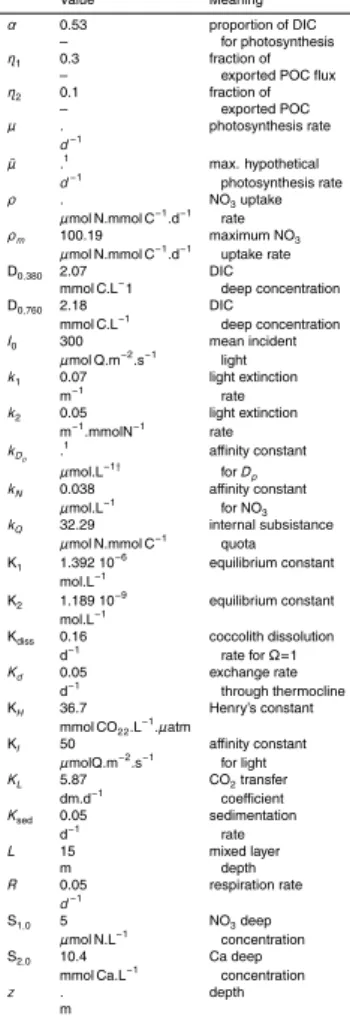
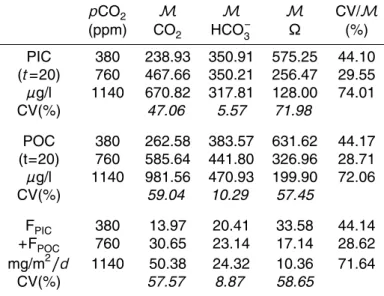
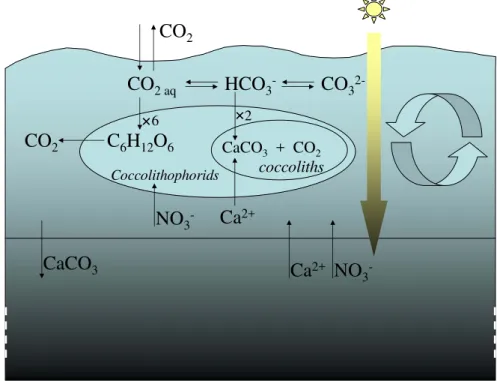
Carbon fixation prediction during a bloom of <i>Emiliania huxleyi</i> is highly sensitive to the assumed regulation mechanism
Texto
Imagem

Documentos relacionados
Water samples for bacterial abundance were taken at the start and end of the batch experiments and at equilibrium growth condition of the chemostat experiments to estimate partic-
Remelted zone of the probes after treatment with current intensity of arc plasma – 100 A, lower bainite, retained austenite and secondary cementite.. Because the secondary
The probability of attending school four our group of interest in this region increased by 6.5 percentage points after the expansion of the Bolsa Família program in 2007 and
Under this scenario, the North Atlantic spring diatom bloom occurs later and is of a smaller magnitude, but the average biomass of diatoms, coccolithophores and prasinophytes
Because of the increas- ing the speed of the decomposition of the anhydrite, together with the growth of the temperature of casting the bronze to the plaster mould, the gases
in the ACZ, and although there is low variability in bloom initiation dates, inter-annual variability in the amplitude of the bloom is high. In the MIZ, variability in bloom
The two points considered at the alternate sides, of the tangents through the diameter of the circle, and then the line joining these points divides the circle
Lines depict the long-term trends of dinoflagellate and diatom biomass (column a), dinoflagellate proportion (column b) and seasonal pattern of dinoflagellate proportion (column c)

