Work simulation of the sprayer field beam with the
use of R program
Symulacja pracy belki polowej opryskiwacza z
wykorzystaniem programu R
Stanisław PARAFINIUK1* and Joanna Tarasińska2
1
University of Life Sciences in Lublin, Faculty of Production Engineering, Department of
Machine Operation and Management of Productive Process. ul. Głęboka 28, 20-612 Lublin,
Poland,
2
University of Life Sciences in Lublin, Faculty of Production Engineering, Department of Applied Mathematics and Computer Science ul. Akademicka 13, 20-950 Lublin, Poland,
* Corresponding author: e-mail: [email protected]
Abstract
In this work the possibility of using R program to stimulate transverse distribution of sprayed liquid deposition and coefficient of variation (CV) obtained on the virtual field beam. Agricultural flat fan nozzles were tested by testing equipment where individual influence from the nozzle with a constant pressure and transverse distribution of the sprayed liquid deposition were characterized. Deposition was collected on the patternator with grooves of 50 mm wide, deposition quantity was automatically measured in measuring vessels and obtained quantities were saved in the equipment database. Sprayed liquid deposition from a single nozzle with a definite influence is saved as a normal distribution. “R” computer program enables to set
distributions obtained from single nozzles in such a way so that it was possible to stimulate the work of a field beam at 50cm agricultural nozzle spacing. In this way one can evaluate regularity of a sprayed liquid deposition and determine coefficient of variability for “virtual” field beam of the agricultural sprayer.
Keywords: coefficient of variation (CV), field beam, flat fan nozzles, R program, testing equipment
Streszczenie
W pracy przedstawiono możliwo ć wykorzystania programu komputerowego „R” do symulacji rozkładu poprzecznego opadu rozpylonej cieczy i
współczynnika zmienno ci CV, uzyskanego na wirtualnej belce polowej. Rozpylacze rolnicze płaskostrumieniowe badano na urządzeniu testującym, gdzie okre lano wypływ jednostkowy z rozpylacza przy stałym ci nieniu i
rozkład poprzeczny opadu rozpylonej cieczy. Opad zbierano na stole rowkowym o szeroko ci rowków 50 mm, wielko ć tego opadu była
automatycznie mierzona w naczyniach miarowych a uzyskane wielko ci były zapisane w bazie danych urządzenia. Opad rozpylonej cieczy z pojedynczego rozpylacza przy okre lonym wypływie jest zapisany w postaci rozkładu
normalnego. Program komputerowy „R” umożliwia ustawienie rozkładów uzyskanych z pojedynczych rozpylaczy w taki sposób, aby można było zasymulować pracę belki polowej opryskiwacza rolniczego z rozstawem rozpylaczy na belce co 50cm. W taki sposób można ocenić symulowaną równomierno ć opadu rozpylonej cieczy i okre lić współczynnik zmienno ci dla „wirtualnej” belki polowej opryskiwacza rolniczego.
Słowa kluczowe: belka polowa, program R, rozpylacz płaskostrumieniowy, urządzenie testujące, współczynnik zmienno ci CV,
Introduction
Nowadays requirements concerning a safe use of pesticides are of a greater importance. In many countries mandatory testing of agricultural nozzles was introduced. In Poland this requirement is regulated by the act of 18th
December 2003 (Dz. U. z 2004 r. Nr 11 poz. 94 z późn. zm. – Official Law Journal, 2004, No 11, item 94 with later changes).
This research is aimed at checking if equipment for using the pesticides is in working order and fulfills statutory requirements about the safety of pesticide application and environment which these substances are used in (Sawa, 2009). The most important part of the sprayer is a nozzle which decides about quality and regularity of obtained sprayed liquid stream. That is why these parts of the sprayer are tested in appropriate conditions and with the use of the appropriate equipment taking ISO 5682-2:1997 norm requirements into consideration (Equipment for crop protection - Spraying equipment)
The subject of the norm are methods for determination of quality of hydraulic nozzle spraying used in agricultural sprayers. Doing such tests is troublesome because these tests are carried out on sprayers aggregated with tractors and are made in definite conditions consistent with elaborated methods of
research. (Langman and Pedryc, 2003) stated in their work that there is lack of automatic devices to test thoroughly the agricultural nozzles disassembled from agricultural sprayers.
Taking this into consideration at University of Life Science in Lublin equipment for complex testing of agricultural nozzles within the research project MNiSW 493/N-Belgia/2009/0 called .„Opracowanie metod i urządzenia do
kompleksowych badań jako ci pracy rozpylaczy rolniczych oraz walidacja tych metod.””The study of methods and equipment for complex testing of work quality of agricultural nozzles and validation of these methods.” was developed. This device is fully automatic and allows to determine such parameters of the nozzles as: specific discharge, regularity of sprayed liquid stream, stream asymmetry and spray angle with assumed pressure of the test (Parafiniuk, 2011b) Together with the device a computer program was
developed to analyze obtained results of nozzle tests on testing equipment. This program is written in R language (R Development Core Team, 2012).
R is a programming language and at the same time it is an environment for statistical computing (Biecek, 2008). R program is free. Its installation version can be downloaded on http://www.r-project.org/. This program can be also activated without any installation. R is distributed on GPL (General Public Licence) which allows to use it free to any purposes.
Evaluation results of nozzles accepted as a fulfilling norm requirements but tested on the patternator of a testing equipment with a groove span of 50 mm (according to norm mentioned above) will undergo conversion by the program (Nozzles), to requirements of standard patternator (1000 mm). It is necessary due to the requirements connected with valid testing methodology of the field beams of agricultural sprayers. This program will define also the order of nozzle setting on the beam.
Materials and methods
Theoretical assumptions
In stations controlling sprayers in use, manual patternators over which nozzles are placed on the beam on a given height at d distance (usually 50 cm) one
from another are used. Distribution of transverse deposition of sprayed liquid collected in grooves at a given span is tested. Number of grooves depends on their span and length of the beam.
One of the tested parameters of liquid distribution is coefficient of variation of a liquid volume collected in grooves. This coefficient of variation is calculated according to the formula: V=(S*ẋ -1)*100%
whereŚ ẋ=∑xi*n-1, S2=∑(xi- ẋ )2 *n-1,
xi*(i=1,…,n) is a liquid volume collected in this i-groove, n- number of grooves on the patternator.
In calculations of a coefficient of variation a certain number of extreme grooves from both sides is not taken into consideration. In general, this
number is selected in such a way to take all grooves into account from the axis of the first nozzle to the last. A large value of a coefficient of variation shows an irregularity of liquid spraying. It is obvious that a change of the nozzle order causes the change of a coefficient of variation of a liquid volume collected in grooves. So, a coefficient of variation obtained in the control time is not maintained, if a farmer changes the order of placed nozzles.
An alternative of field research can be an electronic table of the nozzle testing equipment with grooves k=30 with span h=50mm. Each nozzle is placed over the table and liquid volume collected in grooves is measured. On the basis of obtained measures on the electronic measuring table we can evaluate a coefficient of variation for any nozzle setting over a patternator. It is assumed that liquid volume in a groove of the manual table arises by adding a liquid volume in grooves of electronic table for nozzles adjacent to one another. The
range of sprayed liquid for one nozzle is equal to the length of the electronic table, ie. k*h.
In general, grooves on the manual table have a twice bigger span (width) than on the electronic table. In this connection it is assumed that volume in each groove of the manual table is a volume sum of two grooves of the electronic table.
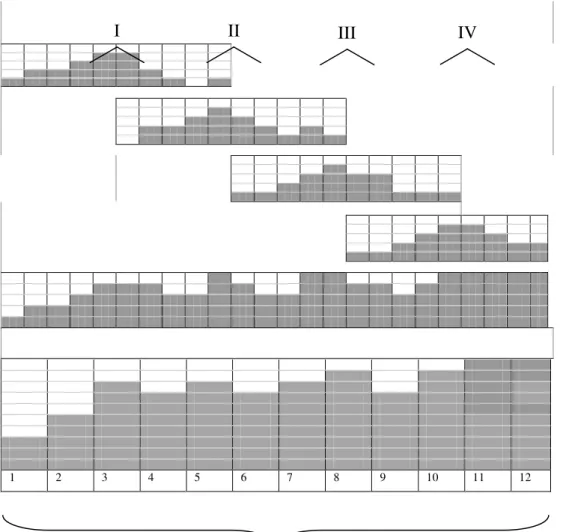
The way of evaluation of liquid volume in grooves of the manual table is presented visually in Figure 1. To make it simple, only 4 nozzles (numbered I-IV) and grooves k=10 on the electronic table were taken into consideration.
Figure 1. The way of calculating the liquid volume in grooves of the electronic table into grooves of the manual table.
Rysunek1. Sposób przeliczenia objęto ci cieczy w rowkach stołu elektronicznego na rowki stołu ręcznego
1 2 3 4 5 6 7 8 9 10 11 12
III IV
II I
grooves of the manual table rowki stołu ręcznego
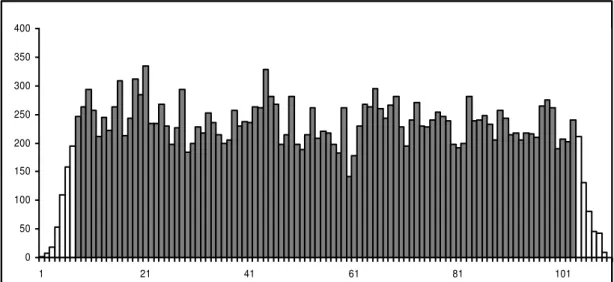
Figure 2 shows the liquid volume in grooves of the manual table determined on the basis of real measures conducted for 20 TEEJET nozzles on the electronic table with 30 grooves with the span of 50 mm.
It was assumed that the distance between axes of nozzles over the manual table equals d=50 cm. In the picture distribution of nozzles in agreed order was taken into account (1,2,3,4,5,6,7,8,9,10,11,12,13,14,15,16,17,18,19,20).
Extreme grooves which are not taken into account when calculating a coefficient of variation are marked white. For data presented in figure 2 we have ẋ=237,28; S=34,83 and v =14,7%.
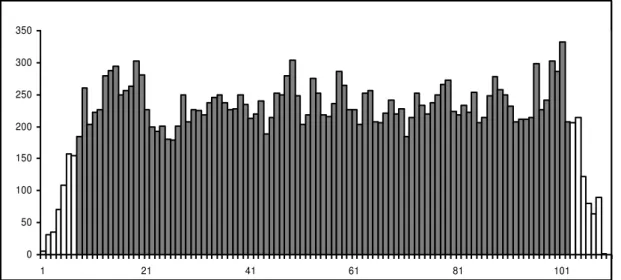
Figure 3 was drawn on the basis of the same measures but with a different randomly chosen order of nozzle distribution over the manual table. This order is as follows (9,12,8,5,10,17,6,15,1,14,16,20,7,19,13,11,2,18,3,4).
For the manual table presented in Fig. 3 we have ẋ=236,56; S=31,07 and v =13,1%.
As you can see, a coefficient of variation may take values from quite a wide range, depending on the order of nozzle distribution over the manual table.
0 50 100 150 200 250 300 350 400
1 21 41 61 81 101
Figure 2. Liquid volumes in grooves of the manual table calculated for 20 nozzles tested on the electronic table. The nozzle order
(1,2,3,4,5,6,7,8,9,10,11,12,13,14,15,16,17,18,19,20).
Rysunek 2. Objęto ci cieczy w rowkach stołu ręcznego przeliczone dla 20 rozpylaczy przebadanych na stole elektronicznym. Kolejno ć rozpylaczy (1,2,3,4,5,6,7,8,9,10,11,12,13,14,15,16,17,18,19,20).
0 50 100 150 200 250 300 350
1 21 41 61 81 101
Figure 3. Liquid volumes in grooves of manual table calculated for 20 nozzles tested on the electronic table. The nozzle order
(9,12,8,5,10,17,6,15,1,14,16,20,7,19,13,11,2,18,3,4).
Rysunek 3. Objęto ci cieczy w rowkach stołu ręcznego przeliczone dla 20 rozpylaczy przebadanych na stole elektronicznym. Kolejno ć rozpylaczy (9,12,8,5,10,17,6,15,1,14,16,20,7,19,13,11,2,18,3,4).
There are 20 all possible settings of nozzles over the manual table in this case, i.e. around 17
10 24 .
In general, if N is the number of nozzles tested on the electronic table, the number of all possible settings of these nozzles over the manual table equals the number of permutation, i.e. N!. Each of them gives a different value of coefficient of variation.
We are interested in distribution of these coefficients of variations. It is not possible to find this distribution exactly due to a great number of all
permutations. It is possible to evaluate by choosing randomly some large (e.g. 10 000) number of permutations.
The program.R file includes a code of the program calculating for a given number randomly generated setting such characteristics of distribution of coefficient of variation like the average, variance, standard deviation, coefficient of asymmetry, coefficient of kurtosis, the lowest and the highest coefficient of variation and equivalent settings of nozzles.
Preparing data collection
In catalogue C: which the program Rozpylacze (Nozzles) was saved in, one should create a text file named dane.txt and write there in the next lines the
following data:
1. number of nozzles,
2. distance between nozzles over the manual table (in cm), 3. number of grooves on the electronic table,
4. width of grooves on the electronic table (in cm),
5. number of extreme grooves on both sides of manual table which is to be omitted when calculating a coefficient of variation,
6. in following lines one should write data from the electronic table for the following nozzles, separating numbers in lines with tabulation
characters.
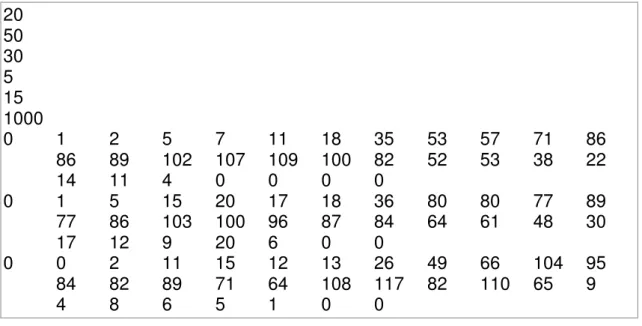
Table 1. An exemplary file with data should look as follows (distributions from three nozzles were taken into account):
Tabela 1. Przykładowy plik z danymi powinien wyglądać następująco (uwzględniono rozkłady z trzech rozpylaczy):
20 50 30 5 15 1000
0 1 2 5 7 11 18 35 53 57 71 86
86 89 102 107 109 100 82 52 53 38 22
14 11 4 0 0 0 0
0 1 5 15 20 17 18 36 80 80 77 89
77 86 103 100 96 87 84 64 61 48 30
17 12 9 20 6 0 0
0 0 2 11 15 12 13 26 49 66 104 95
84 82 89 71 64 108 117 82 110 65 9
4 8 6 5 1 0 0
Files with results
The program will create two resultant files in the same catalogue in which there is a file dane.txt:
1. a file Histogram.pdf including a histogram of received coefficients of variation with randomly generated settings with Gaussian curve matched to it,
2. a text file wyniki.txt in which the following characteristics of distribution of coefficients of variation for M randomly generated settings in program will be given:
average coefficient of variation ẋ=∑vi*M-1,
variance of coefficients of variation S2=∑(vi-ṽ)2*M-1,
standard deviation of coefficients of variation S S2 ,
asymmetry coefficient of distribution of coefficients of variation As=m3*S3, where m3=∑(vi-ṽ)3
*M-1,
kurtosis of distribution of coefficients of variation K=m4*S4, where m4=∑(vi-ṽ)4 *M-1,
the lowest coefficient of variation vmin=min (vi) and the setting for which it was obtained,
the highest coefficient of variation vmax=max (vi) and setting for which it was obtained.
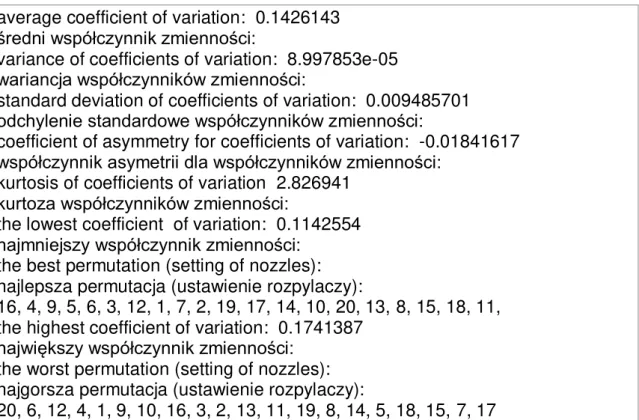
Table 2. The exemplary content of the wyniki.txt.
Tabela 2. Przykładowa zawarto ć pliku wyniki.txt.
average coefficient of variation: 0.1426143 redni współczynnik zmienno ciŚ
variance of coefficients of variation: 8.997853e-05 wariancja współczynników zmienno ciŚ
standard deviation of coefficients of variation: 0.009485701 odchylenie standardowe współczynników zmienno ciŚ
coefficient of asymmetry for coefficients of variation: -0.01841617 współczynnik asymetrii dla współczynników zmienno ciŚ
kurtosis of coefficients of variation 2.826941 kurtoza współczynników zmienno ciŚ
the lowest coefficient of variation: 0.1142554 najmniejszy współczynnik zmienno ciŚ
the best permutation (setting of nozzles): najlepsza permutacja (ustawienie rozpylaczy):
16, 4, 9, 5, 6, 3, 12, 1, 7, 2, 19, 17, 14, 10, 20, 13, 8, 15, 18, 11, the highest coefficient of variation: 0.1741387
największy współczynnik zmienno ciŚ the worst permutation (setting of nozzles): najgorsza permutacja (ustawienie rozpylaczy):
20, 6, 12, 4, 1, 9, 10, 16, 3, 2, 13, 11, 19, 8, 14, 5, 18, 15, 7, 17
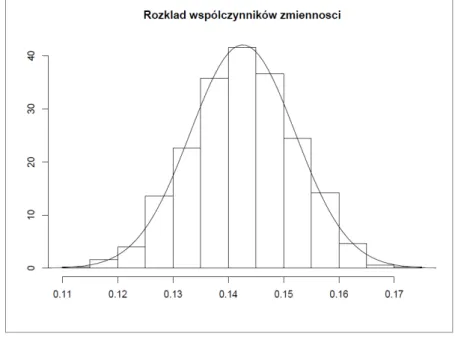
Figure 4. The exemplary content of the Histogram.pdf
Rysunek 4. Przykładowa zawarto ć pliku Histogram.pdf
Discussion
Evaluation of a technical condition of agricultural nozzles is of a great
importance for quality of treatment of plant protection. ISO 5682-2 norm tells about two ways of evaluation of a technical condition, i.e. outflow intensity and distribution of sprayed liquid. Both methods have advantages and
disadvantages, however, they do not tell clearly about the whole characteristics of the nozzle work. Deposition of sprayed liquid can be
collected on patternators with grooves 50 or 100 mm wide. As ( wiechowski et al., 2006) stated different results are obtained depending on the width of the grooves. It is also confirmed by (Sawa et al,. 2002) who states also that each change of a location of the nozzle on the sprayer beam gives a different result of CV.
A degree of wear of nozzle working slot influences also the change of spray quality and causes that it is difficult to obtain the assumed spray dose (Ozkan et al,. 1992). Tests of agricultural nozzles on equipment for their complex tests allow to eliminate worn-out nozzles both with regard to the nominal influence different from requirements and also such as those which have inappropriate spraying asymmetry (Sawa et al., 2012). Obtaining on the testing equipment the transverse distribution from single nozzles enables to combine them in a virtual field beam. Such a combining may be done in a spreadsheet program, for example in Excel both for a theoretical patternator with grooves of 50 and 100 mm wide. Difference of such a combination from the real test on electronic patternator may amount 3 percentage points (Parafiniuk et al,. 2011a).
Modeling in a spreadsheet program may be done only for a definite setting of distributions of sprayed liquid. A way of modeling and simulation of the virtual work of the field beam with the use of R program discussed in the work allows to evaluate the transverse distribution for a definite setting of the nozzles like it
is possible in the spreadsheet program. The additional advantage of modeling with the use of R program is that the program can automatically generate the order of setting of nozzles in such a way to obtain possibly the best or the worst result of coefficient of variation (CV). Additionally, we obtain other statistical information both descriptive and graphic which may allow for more accurate evaluation of modeling such a spraying process.
References
Biecek P., (2008) Przewodnik po pakiecie R”. Oficyna Wydawnicza Gis, Wrocław.
Langman J., Pedryc N., (2003) Ocena rozpylaczy płaskostrumieniowych na podstawie charakterystyki rozkładu poprzecznego strugi cieczy. Inżynieria Rolnicza. Nr 10 (52), 269-276.
Ozkan H.E., Reichard D.L., Ackerman K.D., (1992) Effect of orifice wear on spray patterns from fan nozzles. Transactions of the ASAE. No.4. Vol.35, 1091-1096.
Parafiniuk S., Sawa J., Huyghebaert B., (2011a) Ocena stanu technicznego belki polowej opryskiwacza metodą badania pojedynczych rozpylaczy. Inżynieria Rolnicza. Nr 5 (130), 207-214.
Parafiniuk S., Sawa J., Wołos D., (2011b) Automatyczne urządzenie do oceny stanu technicznego rozpylaczy rolniczych, Postępy Nauki i Techniki Ś Advances in Science and Technology, nr 10, 39-48.
Polska Norma (2005), PN –ISO 5682-2. Sprzęt do ochrony ro lin, Urządzenia opryskujące Cz.2 Metody badań opryskiwaczy hydraulicznych.
Warszawa.
R Development Core Team (2012). R: A language and environment for statistical computing. R Foundation for Statistical Computing, Vienna, Austria. ISBN 3-900051-07-0, URL http://www.R-project.org/.
Sawa J. Huyghebaert B., (2009) Plant protection risk assessment as
ecological education factor.IV International Scientific Symposium. Farm Machinery and Process Management in Sustainable Agriculture. Lublin. Poland 19-20 November, 77-78.
Sawa J. Huyghebaert B. Parafiniuk S., (2012) Testing device for a complex measurement of the performances of nozzles. Fourth European
Workshop on Standardized Procedure for the Inspection of Sprayers in Europe –SPISE 4. 27-29 March 2012 Lana Italy, 79-81.
Sawa J., Kubacki K., Huyghebaert B., (2002) Metodyczne ograniczenia w obowiązkowych badaniach opryskiwaczy. Problemy Inżynierii Rolniczej. 4(38). Warszawa, 17-25.
wiechowski W., Hołownicki R., Doruchowski G., Godyń A., (2006)
Porównanie metod oceny rozpylaczy płaskostrumieniowych. Problemy Inżynierii Rolniczej Nr 4(54). Warszawa, 5-12.
Ustawa z dnia 18 grudnia (2003) roku o ochronie ro lin (Dz.U z 2004r. Nr 11, poz 94 z późn. zm).